HAL Id: hal-00177685
https://hal.archives-ouvertes.fr/hal-00177685
Preprint submitted on 8 Oct 2007
HAL is a multi-disciplinary open access
archive for the deposit and dissemination of
sci-entific research documents, whether they are
pub-lished or not. The documents may come from
teaching and research institutions in France or
abroad, or from public or private research centers.
L’archive ouverte pluridisciplinaire HAL, est
destinée au dépôt et à la diffusion de documents
scientifiques de niveau recherche, publiés ou non,
émanant des établissements d’enseignement et de
recherche français ou étrangers, des laboratoires
publics ou privés.
The Horsehead mane: Towards an observational
benchmark for chemical models
Jérôme Pety, Javier Goicoechea, Maryvonne Gerin, Pierre Hily-Blant, David
Teyssier, Evelyne Roueff, Emilie Habart, Alain Abergel
To cite this version:
Jérôme Pety, Javier Goicoechea, Maryvonne Gerin, Pierre Hily-Blant, David Teyssier, et al.. The
Horsehead mane: Towards an observational benchmark for chemical models. 2007. �hal-00177685�
hal-00177685, version 1 - 8 Oct 2007
THE HORSEHEAD MANE: TOWARDS
AN OBSERVATIONAL BENCHMARK FOR CHEMICAL MODELS
J. Pety
1, J. R. Goicoechea
2, M. Gerin
2, P. Hily-Blant
3, D. Teyssier
4, E.
Roueff
5, E. Habart
6and A. Abergel
51 The intrinsic complexity of chemical models
Photodissociation region (PDR) models are used to understand the evolution of the FUV illuminated matter both in our Galaxy and in external galaxies. To prepare for the unprecedented spatial and spectroscopic capabilities of ALMA and Herschel, two different kinds of progresses are currently taking place in the field. First, numerical models describing the chemistry of a molecular cloud are being benchmarked against each other to ensure that all models agree not only qualitatively but also quantitatively on at least simple cases1 (R¨ollig et al. 2007). Second, new or improved chemical
rates are being calculated/measured by several theoretical and experimental groups. However, the difficulty of this last effort implies that only a few reactions (among the thousand ones used in chemical networks) can be thoroughly studied. New numerical tools are thus being developed for taking into account the impact of the uncertainties of the chemical rates on the chemical model predictions, and their comparison with observed abundances (e.g. Wakelam et al. 2005, 2006). In view of the intrinsic complexity of building reliable chemical networks and models, there is an obvious need of well-defined observations that can serve as basic references. PDRs are particularly well suited to serve as references because they make the link between diffuse and dark clouds, thus enabling to probe a large variety of physical and chemical processes. 2 The Horsehead edge as a chemical laboratory
The illuminated edge (PDR) of the western condensation presents one of the sharpest infrared filament (width: 10′′ or 0.02 pc) detected in our Galaxy by ISOCAM. The
most straightforward explanation given by Abergel et al. (2003) is that most of the dense material is within a flat structure viewed edge-on and illuminated in the plane of the sky by σOri. The H2fluorescent emission observed by Habart et al. (2005) is even
sharper (width: 5′′), implying the inclination of the PDR on the plane-of-sky to be
1 IRAM & Observatoire de Paris, France 2 LERMA-LRA, France
3 IRAM & LAOG, France
4 European Space Astronomy Centre, Spain 5 LUTH, France
6 IAS, France
1See also http://www.ph1.uni-koeln.de/pdr-comparison/intro1.htm
c
2 Molecules in Space & Laboratory
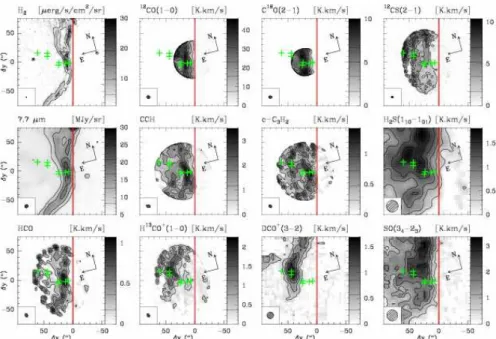
Fig. 1. Emission maps obtained with the IRAM Plateau de Bure Interferometer or 30m
single-dish, except for the H2 v=1-0 S(1) emission observed with the NTT/SOFI and the
PAH mid–IR emission observed with ISO-LW2. The maps have been rotated by 14◦counter–
clockwise around the image center to bring the exciting star direction in the horizontal direction as this eases the comparison of the PDR tracer stratifications. Maps have also
been horizontally shifted by 20′′(compared to the projection center: RA = 05h40m54.27s,
Dec = -02◦28’00′′, J2000) to set the horizontal zero at the PDR edge delineated as the
vertical red line. Either the synthesized beam or the single dish beam is plotted in the
bottom left corner. The emission of all the lines is integrated between 10.1 and 11.1 km s−1.
Values of contour level are shown on each image lookup table (contours of the H2 image
have been computed on an image smoothed to 5′′resolution). The green crosses display the
positions where we derived column densities and abundances (see Table 1).
less than 5◦. The Horsehead ridge thus offers the opportunity to study at small linear
scales (1′′corresponds to 0.002 pc at 400 pc) the physics and chemistry of a PDR with
a simple geometry, very close to the prototypical kind of source needed to serve as a reference to chemical models. Since 2001, we started to study the Horsehead PDR mainly with the IRAM Plateau de Bure interferometer at 3 mm and the IRAM-30m at 1 mm achieving spatial resolutions from 3 to 11′′(except the H2 fluorescent emission
observed at 1′′-resolution with the NTT/SOFI instrument). Figure 1 displays all
the observed, high resolution maps already acquired. Those maps trace the different layered structures predicted by photochemical models according to chemical reaction networks, excitation conditions and radiative transfer.
Abergel et al. (2003) deduced from the distance between σOri and the PDR that the intensity of the incident far UV radiation field is χ ∼ 60 relative to the interstellar radiation field in Draine’s units. Through the modelling of the H2 and CO emission,
Habart et al. (2005) showed that the PDR has a very steep density gradient, rising to nH ∼105cm−3 in less than 10′′ (i.e. 0.02 pc), at a roughly constant pressure of
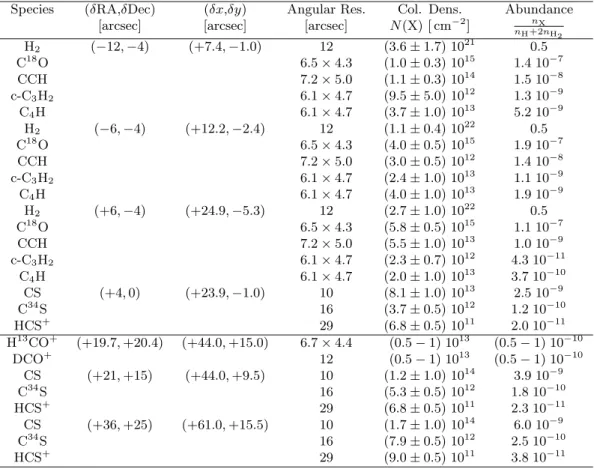
Species (δRA,δDec) (δx,δy) Angular Res. Col. Dens. Abundance
[arcsec] [arcsec] [arcsec] N(X) [ cm−2] n
X n H+2nH2 H2 (−12, −4) (+7.4, −1.0) 12 (3.6 ± 1.7) 1021 0.5 C18 O 6.5 × 4.3 (1.0 ± 0.3) 1015 1.4 10−7 CCH 7.2 × 5.0 (1.1 ± 0.3) 1014 1.5 10−8 c-C3H2 6.1 × 4.7 (9.5 ± 5.0) 1012 1.3 10−9 C4H 6.1 × 4.7 (3.7 ± 1.0) 1013 5.2 10−9 H2 (−6, −4) (+12.2, −2.4) 12 (1.1 ± 0.4) 1022 0.5 C18 O 6.5 × 4.3 (4.0 ± 0.5) 1015 1.9 10−7 CCH 7.2 × 5.0 (3.0 ± 0.5) 1012 1.4 10−8 c-C3H2 6.1 × 4.7 (2.4 ± 1.0) 1013 1.1 10−9 C4H 6.1 × 4.7 (4.0 ± 1.0) 1013 1.9 10−9 H2 (+6, −4) (+24.9, −5.3) 12 (2.7 ± 1.0) 1022 0.5 C18 O 6.5 × 4.3 (5.8 ± 0.5) 1015 1.1 10−7 CCH 7.2 × 5.0 (5.5 ± 1.0) 1013 1.0 10−9 c-C3H2 6.1 × 4.7 (2.3 ± 0.7) 1012 4.3 10−11 C4H 6.1 × 4.7 (2.0 ± 1.0) 1013 3.7 10−10 CS (+4, 0) (+23.9, −1.0) 10 (8.1 ± 1.0) 1013 2.5 10−9 C34S 16 (3.7 ± 0.5) 1012 1.2 10−10 HCS+ 29 (6.8 ± 0.5) 1011 2.0 10−11 H13 CO+ (+19.7, +20.4) (+44.0, +15.0) 6.7 × 4.4 (0.5 − 1) 1013 (0.5 − 1) 10−10 DCO+ 12 (0.5 − 1) 1013 (0.5 − 1) 10−10 CS (+21, +15) (+44.0, +9.5) 10 (1.2 ± 1.0) 1014 3.9 10−9 C34 S 16 (5.3 ± 0.5) 1012 1.8 10−10 HCS+ 29 (6.8 ± 0.5) 1011 2.3 10−11 CS (+36, +25) (+61.0, +15.5) 10 (1.7 ± 1.0) 1014 6.0 10−9 C34S 16 (7.9 ± 0.5) 1012 2.5 10−10 HCS+ 29 (9.0 ± 0.5) 1011 3.8 10−11
Table 1. Column densities and abundances of several chemical species from the UV–
illuminated PDR (upper part) to the shielded region (lower part) of the Horsehead edge. Coordinates offsets are given both in the Equatorial system from RA = 05h40m54.27s, Dec
= -02◦28’00′′(J2000) and in the coordinate system adapted to the source geometry and used
in Figure 1. Abundances are computed with respect to the density of protons (nH).
P ∼4 × 10⁶
K cm−3. These observations were followed by a chemical study of small
hydrocarbons (CCH, c-C3H2, C4H). Pety et al. (2005) showed that the abundances
of the hydrocarbons are higher than the predictions based on pure gas phase chemical models (Le Petit et al. 2002 and reference therein). These results could be explained either by the photoerosion of the large aromatic molecules and/or small carbon grains (C. Joblin, 2007, this volume) or by a turbulent mixing which would transport in the illuminated part of the PDR molecules after their productions in the dark part (M. Gerin, 2007, this volume). Goicoechea et al. (2006) linked the PDR model predictions with detailed non-LTE, nonlocal excitation and radiative transfer models adapted to the Horsehead geometry. They showed that the gas sulfur depletion invoked to account for CS and HCS+ abundances is orders of magnitude lower than in previous
studies of the sulfur chemistry.
Finally, Pety et al. (2007) studied the deuterium fractionation in the Horsehead edge from observations of several H13
CO+
and DCO+
lines. A large [DCO+
]/[HCO+
] abundance ratio (≥ 0.02) is inferred at the DCO+ emission peak, a condensation
4 Molecules in Space & Laboratory
shielded from the illuminating far-UV radiation field where the gas must be cold (10–20 K) and dense (nH ≥ 4 × 105cm−3). DCO+ is not detected in the warmer
photodissociation front, implying a lower [DCO+
]/[HCO+
] ratio (< 10−3). To our
knowledge, this is the brightest DCO+
emission (4 K) detected in an interstellar cloud close (angular distance < 40′′) to a bright H
2/PAH emitting region. This opens the
interesting possibility to probe at high resolution the chemical transition from far-UV photodominated gas to “dark cloud” shielded gas in a small field of view.
3 Towards an observational benchmark
An ideal observational benchmark would deliver to chemists a set of abundances (with the associated uncertainties) as a function of the distance (or extinction) to the illuminating star. This goal is difficult to achieve for several reasons: 1) The geometry of the source is never as simple as wished when it is known at all; 2) The spectra produced by the instruments must be inverted to obtain abundances; 3) The spectra are often measured at very different angular resolutions, implying beam dilution and/or mixing of different gas components. For several years now, we have started to systematically study the western edge of the Horsehead nebula because its geometry is not only well understood but also quite simple (almost 1D and viewed edge-on). The density profile across the PDR is well constrained and there are several current efforts to constrain the thermal profile. The combination of low distance to Earth (400 pc), low illumination (χ ∼ 60) and high density (n ∼ 105
cm−3) implies
that all the interesting physical and chemical processes can be probed in a field-of-view of less than 50′′ with typical spatial scales ranging between 1 and 10′′.
All those observations are done by the same team, using the same instruments (mainly IRAM Plateau de Bure and 30m) and the same methods both of data reduc-tion and data analysis. For each species, we are trying to observe several transireduc-tions at similar angular resolutions (from 5 to 15′′) to constrain properly the excitation
conditions and derive accurate column densities and abundances. Obtaining emission maps when possible has proved essential to understand the spatial distributions of the species. We are preparing the public release of cuts of spectra so that the radia-tive transfer analysis can be refined as knowledge of collisional rates progresses. In the meantime, Table 1 is our first attempt at quantitatively summarizing the results obtained up to now. In the future, the zoom capacity and resolving power of ALMA will enable to measure many different specie transitions at a resolution of 1′′, enabling
to resolve all the physical and chemical gradients. References
Abergel, A., Teyssier, D., et al. A&A, 410, 577
Goicoechea, J. R., Pety, J., Gerin, et al. 2006, A&A, 456, 565 Goicoechea, J. R., & Le Bourlot, J. 2007, A&A, 467, 1
Habart, E., Abergel, A., Walmsley, C. M., Teyssier, D., & Pety, J. 2005, A&A, 437, 177 Le Petit, F., Roueff, E., & Le Bourlot, J. 2002, A&A, 390, 369
Pety, J., Teyssier, D., Foss´e, et al. 2005, A&A, 435, 885
Pety, J., Goicoechea, J. R., Hily-Blant, P., Gerin, M., Teyssier, D., 2007, A&A, 464, L41
R¨ollig, M., Abel, N. P., Bell, T., et al. 2007, A&A, 467, 187
Wakelam, V., Herbst, E., & Selsis, F. 2006, A&A, 451, 551