Elsevier Editorial System(tm) for Applied Energy Manuscript Draft
Manuscript Number: APEN-D-11-00891R1
Title: Development of Benchmark Models for the Egyptian Residential Buildings Sector Article Type: Original Paper
Keywords: residential buildings, simulation, energy model, benchmark, load patterns, air conditioning, Egypt
Corresponding Author: Mr Shady Galal Attia, MSc
Corresponding Author's Institution: Université catholique de Louvain First Author: Shady G Attia, Msc
Order of Authors: Shady G Attia, Msc; Arnaud Evrard, PhD; Elisabeth Gratia, PhD
Abstract: The aim of this study is to develop representative simulation building energy data sets and benchmark models for the Egyptian residential sector. This study reports the results of a recent field survey for residential apartment buildings in Egypt. Two building performance simulation models are created reflecting the average energy consumption characteristics of air-conditioned residential apartments in Alexandria, Cairo and Asyut. Aiming for future evaluation of the cost and energy affects of the new Egyptian energy standard this study established two detailed models describing the energy use profiles for air-conditioners, lighting, domestic hot water and appliances in respect to buildings layout and construction. Using EnergyPlus simulation tool the collected surveyed data was used as input for two building simulation models. The simulation models were verified against the apartment characteristic found in the survey. This paper presents details of the building models including the energy use patterns and profiles created for this study.
Data was collected from surveying almost 1500 apartments in Egypt
Two apartment benchmark models have been constructed representing typical residential buildings in Alexandria, Cairo and Asyut.
In Alexandria, the average the use of air conditioning yearly is between 49 and 29 percent. In Cairo, the average the use of air conditioning yearly is between 57 and 44 percent. In Asyut the average the use of air conditioning yearly is between 65 and 57 percent.
The average energy use per apartments in Typology 1 was 22.4 kWh/m2/year in Alexandria, 26.6 kWh/m2/year in Cairo and 31 kWh/m2/year in Asyut.
For Typology 2 the average consumption for a typical apartment was 11 kWh/m2/year in Alexandria, 14 kWh/m2/year in Cairo, and 18 kWh/m2/year in Asyut.
1
Development of Benchmark Models for the Egyptian Residential Buildings
Sector
The aim of this study is to develop representative simulation building energy data sets and benchmark models for the Egyptian residential sector. This study reports the results of a recent field survey for residential apartment buildings in Egypt. Two building performance simulation models are created reflecting the average energy consumption characteristics of air-conditioned residential apartments in Alexandria, Cairo and Asyut. Aiming for future evaluation of the cost and energy affects of the new Egyptian energy standard this study established two detailed models describing the energy use profiles for air-conditioners, lighting, domestic hot water and appliances in respect to buildings layout and construction. Using EnergyPlus simulation tool the collected surveyed data was used as input for two building simulation models. The simulation models were verified against the apartment characteristic found in the survey. This paper presents details of the building models including the energy use patterns and profiles created for this study.
Keywords:
residential buildings, simulation, energy model, benchmark, load patterns, air conditioning, Egypt1. Introduction
In Egypt, the reliance on mechanical equipment in residential buildings has increased sharply over the last ten years. This increase is due to several changes that have occurred. The successive economic, social and climatic change has resulted in higher energy consumption rates. The continuously growing urban population and economic growth, coupled with long hot summers, has resulted in a relatively improvement of living standard among Egyptians [1]. The economic growth nourishes the demand for building space, comfort and services, which raises the demand for residential energy. Also, the heavily subsidised domestic energy costs, which get rapidly eroded due to inflation, have resulted in a great deal of energy inefficiency in the residential building sector [2]. Traditional knowledge of appropriate environmental design and construction has been
*Manuscript
2
neglected during last 60 years. For example, passive design strategies such as shading, orientation, thermal mass, natural lighting and ventilation are no longer used. In addition, the construction industry in Egypt is still characterised by its poor quality [3-4]. As a consequence, the existing built environment reflect a repetition of minimalistic, identical, modular and poorly constructed residential blocks that are strongly dependent on environmental control-equipment [5]. All these factors have increasingly accelerated the reliance on mechanical acclimatisation all over the country and resulted in peaking energy consumption rates and patterns. For example, sales figures for fans and conditioners are growing rapidly. Between 1996 and 2006 the sale of air-conditioning (AC) units exceeded 54,000 units per year, while between 2006 and 2010 this number has increased to reach an average 766,000 units per year, as shown in Figure 1 [6-10].
Figure 1
In Egypt, residential buildings are the major consumer of energy, in a country where 45% of the population live in urban areas. In 2008, the residential building sector consumed more than 47% of the total nationally generated electricity. Approximately 11 Million tons of oil equivalents (Mtoe) of energy were consumed by approximately 20 million apartments. The rise in average
consumption per capita and the desire for better comfort are reflected in a strong upward trend in
electricity consumption. In Egypt, electrification has reached 99% of households, where 80% of the residential customers use 50% of the total households’ electricity [11]. If the current consumption trend expands further, which is expected, building electricity consumption and peak loads will continue to rise rapidly as more sectors of the growing population benefit from rising incomes, thus expanding their housing space and upgrading their living standards [12]. Demand projections see residential and other building’s demand increase from 8 Mtoe in 2005 to 25 Mtoe in 2030. Between 1998 and 2008, electricity consumption for residential purposes has been growing at over 7-10 percent a year. Most probably this trend is expected to grow in future years by about 35% [13]. Lead by the Egyptian National Institute of Planning (ENIP) many different governmental reports warned that the primary energy supply will not be able to meet demand by 2015.
3
As a reaction to this trend, and in order to accommodate the prognosis for accelerating
population growth and rising energy prices, the Egyptian government declared the commencement of its program for nuclear power plants for electricity production in 2007 [13]. Driven by the desire to provide cheap electricity to its population, where more than 20 percent live below the poverty line, the government considered nuclear energy as the easiest central solution to concentrate its effort to solve the energy problem centrally [14]. At the same time, no consideration was given to the reform of the building energy sector. The wish for energy conservation in the building sector has been given a lower profile in Egyptian energy policy. The rising energy consumption trend was not curbed by the interest of energy conservation and environmental protection to reform the building energy sector. Overseeing this problem, in 2004 the United Nations Development Programme (UNDP) granted Egypt funding through the Housing and Building Research Centre (HBRC) in Cairo to develop a residential energy standard ([15]. In 2005, a standard for residential buildings was completed and published [16]. The development of the standard required knowledge about the building design details and the end-user energy characteristics of residential buildings in Egypt. The standard was based on several end-user surveys conducted between 1998 and 2005 and
described in section 2.1.
However, the information available for residential buildings in Egypt is either incomplete or outdated. Almost no current published work addressed the status of energy consumption in the residential building sector or presented current representative models describing the pattern of use of air-conditioners, fans, lighting and other appliances in residential buildings. This information is critical in estimating the space cooling loads and their influence on the electric load profile. There is a need for validated data on the representative load patterns of air-conditioned residential
apartments. Applying this information can help future studies in estimating the cost and energy effect of the new Egyptian energy standard in order to reform the building energy sector, since the cost of saving 1kWh of energy through energy-efficiency programs has proven much less expensive than producing 1kWh of energy by building a new power plant [17].
Consequently, the main objective of this paper is to create two simulation models that represent electricity consumption patterns of residential apartments, for the year 2008, in three central
4
metropolitan areas representing the three climates in Egypt. This is done by conducting field surveys that report on the building characteristics and end-use energy patterns and profiles. Thus a
number of original works have been carried out in this study including the creation of an up to date benchmark model for the Egyptian residential buildings sector based on the data collected from surveying almost 1500 apartments in Alexandria, Cairo and Asyut. The study highlights the building physical characteristics and occupancy energy profiles and enables the reflection on the difficulties, barrier and opportunities for development.
This paper is organised into six sections. The first and second sections identify the research problem, position it in the Egyptian context and explore the research methodology. The third section reports and analyses the survey results and defines the consumption patterns and load profiles for two typical air conditioned apartments. The final two sections discuss the validity of the model and its energy performance characteristics.
2. Literature Review
2.1 Energy modelling for residential building sector
In the area of residential energy modelling different methods have been applied to estimate the energy use in many countries. In literature, the most common three methods to estimate energy use in buildings are (1) linear regression models, (2) neural networks and (3) surveys. For example, Aydinalp et al. developed residential energy consumption models for the Canadian residential sector. The study used a neural network method to estimate the consumption of appliances, lighting and space-heating and cooling components [18]. Other similar studies using neural networks include the work of Sozen et al. in Turkey, Azadeh et al. in Iran, Karatasou et al. in Greece, Gonzalez in Spain and Abdel-Aal in Saudi Arabia [19, 20, 21, 22 and 23]. On the other side, examples using linear regression model is the work of Bianco et al. who tried to forecast electricity consumption in Italy [24, 25]. Similar studies using linear regression include the work of Ranjan in India, Abosedra in Lebanon, Mohamed in New Zealand, Pachauri in India and Murata et al. in China [26, 27, 28, 29 and 30].
However, the neural network method and linear regression method require validation by
5
Despite the importance of the neural network and linear regression techniques the two methods are not investigated further in this paper. The main focus of this paper is real data and surveys of the buildings energy consumption to build a comprehensive and detailed residential energy model.
Chronologically, many studies aimed to identify the energy consumption use and patterns in residential building by conducting field visit surveys. A major survey conducted by Mansouri et al. in 1996 identified the utilization patterns and energy consumption in UK households. The survey aimed to estimate the variations in energy consumption per household and the annual consumption nationally [31]. In 1996, Lam gathered and analyzed energy-consumption data in the residential sector in Hong Kong. He surveyed 200 households in 5 different classes of residential units. Sub-sector and end-use electricity consumption have been estimated [32]. Another study in 1997, by Xiaohua et al., applied a stratification sampling method to investigate 384 households in 12 villages of four towns in Yangzhong County. Responses to a questionnaire show that the average annual energy consumption per rural household is 740 kWh/year per family [33]. In 2000, a study was published by Lam on the household electricity use for air conditioning in the residential sector in Hong Kong. DOE-2 building energy modelling program used was used to estimate the energy consumption. It was found that air conditioning accounts for about one third of the total electricity use in the residential sector [34]. Another study in Hong Kong published in 2003 by Tso et al. provides descriptive information on domestic energy usage patterns and investigates the effect of housing type, household characteristics and appliance ownership on electricity energy consumption level. Data were collected via a two-phase self-administered diary survey for households with average monthly electricity consumption of 100 kWh or above [35]. Also Wan el al. conducted a survey in 2004 aiming to define energy-use characteristics of high-rise residential buildings in Hong Kong. The study obtained various energy data on household energy and electricity uses for
domestic appliances and their utilization pattern. The estimated and surveyed average annual electricity-consumption in a typical flat was 144 kWh.m2 where 45% of was for air-conditioning electricity using 66kWh/m2 per household [36]. The same authors published in the same year the results of surveys that have been conducted to obtain information about the building design and energy end-use characteristics of high-rise residential buildings in Hong Kong. The energy data
6
obtained include the household energy and electricity uses, and the type and quantity of appliances used in residential units. The saturation rates of various domestic appliances and their utilisation patterns, and the annual energy use for air-conditioning and water heating in residential units in Hong Kong have been estimated based on the collected data. The average annual household electricity-use intensity was about 110 kWh/m2. The average annual air-conditioning electricity-use intensity was estimated to be about 40–45 kWh/m2
[37].
The summarized review of previous studies shows that comprehensive information and detailed data for the residential building stock worldwide is rather limited. There is a shortage of available data in many countries and the overall lack of national residential building energy benchmarks and models [38].
2.2 Past and recent surveys in Egypt
In Egypt, during the past two decades, Energy surveys and audit exercises were developed and monitored by several institutions including the Organization for Energy Planning (OEP), universities and research centres [39]. For example, in 1998, an energy survey on a sample from the residential sector was conducted by the OEP and Cairo University. The sample size consisted of 2634
apartments distributed among 16 zones in Greater Cairo. The average annual end-use energy consumption was 2866 kWh/m2 per apartment, ranging between 2991kWh/m2 during the summer and decreasing to 2741 kWh/m2 during winter. Also the survey reported the degree of saturation of air conditioners at 17% [40-44]. Later in 2001 and 2002, the OEP conducted three other surveys. One was carried out in Port Said involving 926 apartments and another in Alexandria, studied 2750 apartments [45]. A third survey was conducted together with the Faculty of Engineering in Asyut and surveyed the energy consumption of 807 apartments in 13 different districts representing different urban densities and social-economic classes [46]. However, the information revealed by the surveys was not sufficient to develop representative energy models. In addition there was no energy breakdown for the consumption of the average apartment.
In 2001 and 2003, two surveys were conducted by the Egyptian Housing and Building Research Centre (HBRC) on residential and commercial buildings. A residential survey was done in two phases [47]. The first phase included a survey of 125 housing apartments, of which 95 were located
7
in Cairo and 30 in Alexandria. Of the 125 sampled housing apartments, 22% were in high-rise buildings of more than 6 storeys, 70% were in mid-rise building buildings from 5 to 6 storeys, and only 8% in low-rise buildings with two floors. The survey defined prototypical housing apartments and developed prototypical occupancy schedules by family type for major residential spaces (bedroom, living room, kitchen and bathroom). Unfortunately, the survey did not present energy consumption data [15]. The second phase included a survey on commercial buildings, which was completed in September 2003 [48].In contrast to the residential survey, the commercial survey consisted of an analysis of sectored data from the 1986 Census, OEP and the Ministry of Electricity and Energy, complemented by energy audits and surveys of a relatively small sample of 19
commercial buildings in Cairo, including 3 banks, 2 shopping malls, 2 residential/commercial mixed-use building, 3 offices, 1 hospital, and 5 government ministries. The report presented general observations on the typical size, shape, number of floors, envelope conditions and cooling and ventilation equipment of offices, hotels, and retail stores. The energy use characteristics of the audited buildings were also documented. The small sample size made it difficult to generalise the survey findings.
In 2006, Michel and Elsayed conducted field surveys in both the Cairo and Alexandria regions, where construction activities were flourishing. The survey evaluated the design, construction, and energy use of typical new residential buildings with a view to improving current building practices and introducing new energy-efficient features through comprehensive building codes. In order to have a survey sample, representative of new construction, the building selection was carried out according to a predefined sampling scheme for different zones in Cairo (Maadi, Nasr City and New Cairo) and Alexandria (Agami and Borg El-Arab). A total number of 140 buildings were surveyed, analysed and classified into two main building typologies aiming to evaluate the energy
performance of different apartments as part of developing the new standard [49].
In 2006 and 2007 Attia et al. [50] conducted a field survey to estimate the average energy consumption for 87 apartment blocks in Cairo. The study presented passive and active renovation strategies for an existing residential community in order to evaluate the impact and potential of a
8
low-energy retrofit. However, the research focused on a small sample of higher income apartments with high energy demand and only considered the saving potential for this particular category.
The summarised review of previous studies cannot provide a general snapshot about the energy end-use in residential buildings in Egypt. Most cases are outdated and do not properly document long performance periods. More importantly, information about the air-conditioners use and power intensities of installed appliances and their usage patterns are missing. This information is essential to predict the energy use of air-conditioners in residential apartments and to construct
representative simulation models. However, the previous surveys were used to form a basis for the new survey.
3. Methodology
The methodology implemented in this paper includes aspects which determine the energy consumption characteristics of air-conditioned residential buildings in Egypt. The methodology followed is similar to other recent international energy consumption studies [17, 36, 51 and 52]. The first step was to carry out a literature review on past and recent surveys. The second step was to identify typical building typology and characteristics through field surveys and literature review. The survey plan included a description of a comprehensive set of building construction, equipments and dimensions. Several specific energy consumption issues were addressed during the on-site
surveys. For the third and final step, actions were taken to develop two representative benchmark models of air-conditioned apartments and conducting parametric simulations. The EnergyPlus program was used for modelling the energy performance of the representative apartment models [53]. Hourly weather readings for the year 2008 in the three cities were obtained from the Egyptian Meteorological Authority (EMA) in Excel format and formatted into EPW format for use in
EnergyPlus [54]. The following sections describe in detail the steps undertaken.
3.1 Selection of representative residential apartments
In Egypt, the hot arid climate predominates. The overheating period lasts for about 7 months and the peak shade temperatures reach about 40oC. Between April and October the peak shade temperatures reached about 40 oC. According to the 2006 Census [6] 88% of air-conditioned apartments are found in the high-rise residential buildings in the three major cities namely,
9
Alexandria, Cairo and Asyut. Therefore, the following three cities were selected Alexandria (31.2oN, 29.95oE), Cairo (30.13oN and 31.0oE) and Asyut (31.18oN and 27.18oE) where the outdoor design temperature are 32oC, 38.5oC and 41.2oC, respectively [55]. The size of the apartments in those cities varies substantially but they are classified according to the census into classes from A to D:
A: 7 percent have gross areas greater than 130 m2 B: 47 percent have gross areas between 110 and 130 m2 C: 23 percent have areas between 90 and 110 m2 D: 11 percent have areas between 60 and 90 m2
Based on this classification, the majority of air-conditioned residential apartments are in class B. Therefore, the survey plan was aimed at screening and selecting three middle class
neighbourhoods that fall in class B with high penetration values of air-conditioning units. This step was done with help from the local electricity utility companies and from on site observation in the three cities. The selection resulted in three neighbourhoods, namely Sidi Gaber in Alexandria, Mohandessin in Cairo and Firyial in Asyut as shown in Figure 2. The site observations showed that those residential neighbourhoods have buildings with minimalist and replicated modular
architecture. Apartment blocks and concrete walk-up buildings are dominant.
The major limitation of this data collection method is that it cannot be proven to be statistically representative on any given national population. However, with nearly 1500 survey responses collected, representing the three neighbourhoods, we believe that patterns could be identified and cross-discipline analysis was possible. Already several recent international studies had the same approach [17, 36, 51 and 52].
. Figure 2
From the data collected it was observed that the floor layout of residential building blocks would be most probably rectangular. Two typical common block typologies were identified among Class B, referred to as Typology 1 and Typology 2. The resulting two typologies are selected and defined as representative residential building blocks for this study (see Figure 3 and 4). Typology 1 has six
10
floors with two apartments per floor. Typology 2 has 12 floors with four apartments per floor. The position of those typologies within the urban context was also documented. In each of the three cities, more than 250 apartment samples which fall in Typology 1 were surveyed and more than 240 apartment samples were surveyed falling in Typology 2.
Figure 3 and Figure 4
3.2 Building Description
The two blocks shown in Figures 3 and 4, were found to be representative models for residential buildings in the three cities. Typology 1 is a block of base 25m x 11m x 18m with a 2.3:1 aspect ratio. The total area of one apartment is 122 m2 with a net conditioned area of 60 m2,representing three rooms per apartment. The basic building construction is a reinforced-concrete post and beam structure with 0.15m thick brick infill walls without insulation. Windows are single glazed,
transparent and have a 0.003m thick glass pane. The total amount of glass in the North and South facades is estimated to be between 45% and 35% of the total wall area. There is no solar protection for the facades and most wooden windows are draughty. Typology 2, shown in Figure 4, is a twelve story building block of base 30m x 20m x 34m with a 1.5:1 aspect ratio. The building’s gross floor area is 7200 m2 and the net conditioned area is 60 m2 representing three rooms per apartment. The building has the same construction properties as Typology 1. The amount of glass used is estimated at 46% in the short façades and 20% in the longer facades of the total wall area. There is no solar protection for the facades and most wooden windows are draughty. For both typologies, a multi-thermal-zone configuration per floor was used in conducting energy simulations. To address
the different orientation of the surveyed apartments, the benchmark models performance was generated by simulating the building with its actual orientation and again after rotating the entire building 90, 180, and 270 degrees, then averaging the results. Table 1, lists the
general description of the sample building and some properties for the construction materials used.
11
3.3 Energy characteristics of representative residential apartments
Two types of energy audit were conducted for the selected apartments during August and
September 2008. First analyses of the utility bills, and second a walk-through survey. The utility bill analysis was made prior to the walkthrough survey to become familiar in advance with the
consumption patterns of the apartment visited. This step helped in obtaining more accurate information from the apartment’s occupants. A request to the electricity utility companies in the three cities was made to provide the utility bills for the year 2006 and 2007.The bills were analysed and entered in spreadsheets to identify the patterns of use, peak demand, weather and Ramadan effects. Then the walkthroughs were conducted. During the walkthrough visit, major energy use equipment (air-conditioners, ceiling fans, lighting, water heaters, stoves, etc.) were identified and apartment members were asked about the hours of operations during summer, winter and Ramadan. Also the characteristic construction and layout of every visited apartment was noted. Later the utility bills for the year 2008 were collected from the utility companies.
The collected information was combined and analysed to reflect the energy performance of representative realistic situations in air-conditioned residential buildings. The development of the two representative residential apartments was underlined by building design characteristics and audited energy use data collected during the surveys. On the basis of this set of data the building models together with hourly usage profiles and operation patterns of air-conditioners and other equipment were established, representing typical residential apartments in Alexandria, Cairo and Asyut. Details of the representative building benchmark models are described in the results section.
4. Survey Results
For each of the following issues, results from the surveys are presented and, where comparable macro information exists, comparisons are made against citywide averages. Where data on citywide averages do not exist, data have been based on the survey. In some cases only survey information is available. Combining the collected data in a representative simulation model took calibration and validation work.
12
As the survey addressed the billing history of the sample groups we found average consumption for a typical apartment in Typology 1 to be 22.4kWh/m2/year in Alexandria, 26.6kWh/m2/year in Cairo and 31kWh/m2/year in Asyut. For Typology2 the average consumption for a typical apartment was 11kWh/m2/year in Alexandria, 14kWh/m2/year in Cairo and 18kWh/m2/year in Asyut. Figure 5 illustrates the surveyed average monthly electricity consumption for both apartment typologies in the three major cities. The average consumption of apartments of Typology1 was higher than the average consumption values of apartments in Typology2, primarily due to smaller exposed surface area of external walls of apartment in Typology 2 resulting in reduced heat gains.
Figure 5
4.2 Occupancy Rates
The occupant’s behaviour influences energy consumption in residential buildings. The influence of the occupant’s consumption patterns has a remarkable national character. In each of the three
cities, more than 250 apartment samples (Typology 1) and 240 (Typology 2) were surveyed.
In order to define the occupancy rates the average occupancy density and occupancy schedules of typical air-conditioned apartments were investigated. The investigation focused on air-conditioned spaces including living space and bedrooms. However, when the collected data samples were
combined and analysed no significant difference, regarding the occupant behaviour in the three neighbourhoods, was found. This is mainly due to the similarity of air-conditioning units’ penetration values, which probably reflects the same economic and consequently lifestyle status. It might be also possible that the short sampling time (August September) did not allow to the recognition of significant difference. The following paragraphs report the
findings.
4.2.1 Occupancy Density
According to the 2006 Census the national average apartment occupancy is 4.19 people per apartment and the national average occupancy density is 10.75m2 on usable floor areas per person [6]. The average apartment occupancy in Alexandria, Cairo and Asyut is 3.83, 4.69 and 3.75 people
13
per apartment
,
respectively. On the other hand, the survey results indicate that the averageapartment occupancy is 4 to 5 people per apartment with an average density of 24-28 m2 on usable floor areas per person in the air-conditioned apartments. Based on the above statistics, it would be considered reasonable to assume the same average areas per occupant in air-conditioned
residential apartments in Alexandria, Cairo and Asyut, which would be around 26 m2 and could accommodate up to 5 people.
4.2.2 Occupancy Schedules
According to the 2006 Population Census the national dominant age groups within apartments are people younger than 45 (50%) and people younger than 15 (21%). Similarly, in the three cities, the dominant age groups are younger than 45 (Alexandria 51%, 51% Cairo and Asyut in 47%) and younger than 15 (Alexandria 18%, 17% Cairo and 25% in Asyut). People between 15 and 45 would most likely be secondary school or university students or working adults while people younger than 15 were most likely school students.
In our survey sample we will assume that over 50% of the apartment occupiers are within the age range of 22 to 60. Most of the apartment occupants would be away from home between 08:00 and 15:00 on weekdays. About 25% of the apartment residents would not return home until after 17:00. Nearly all residents would stay at home after 23:00. Most residents would stay at home on Fridays because the weekend in Egypt is Friday and Saturday.
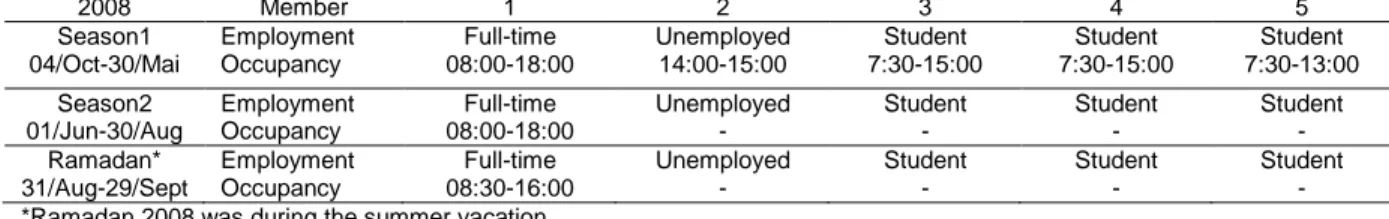
In the light of the government statistics and the survey results, a representative family type was selected for the establishment of the two models in Alexandria, Cairo and Asyut. The selected family type represented the most dominant type among the surveyed apartments in the three cities. The characteristics of this family type is based on a nuclear family where an adult female would be at home during the daytime, while other family members would be at work or at school. Table 2, summarises the surveyed employment status for each family member and the daily hours spent at home. Daily and weekly profiles, defining the number of occupants that would be present in living areas and bedrooms in a residential apartment at different times of the day during the three seasons, are shown in Figure 6.
14
Table 2Figure 6
4.2.3 Internal load intensities
Estimating the average load is a difficult and complex task, in order to generate accurate results the internal loads were categorised and studied under the three following headings.
4.3 Lighting intensity and schedules
The data collected in the survey shows that the lighting power density installed in the living spaces and bedrooms vary significantly depending on the types and number of lamps used. The dominant types of lamps used were incandescent lamps and fluorescent tubes. As found from the survey, the average lighting-power intensity for living room and bedrooms are 17 and 13W/m2, respectively. The rest of the space had an intensity of 9 W/m2.Those values were adopted as the typical lighting power intensities for the established models. Figure 7 shows the daily profiles of lighting use for a typical living and bedroom for the selected family type.
Figure 7
4.4 Plug load intensity and schedules
In order to estimate the plug load intensities and their operation schedules, an inventory of electrical appliances was included in the field survey. The saturation rates and penetration rates of apartment appliances were determined based on the survey findings. Table 3 summarises only those types of domestic appliance that had a saturation rate higher than 60% from the surveyed sample. The appliances that are assumed to be commonly used are classified based on the field survey results.
The unit capacity of the continuously plugged appliances and standby power appliances and the average running hours of each appliance were determined with reference to the collected survey data and appliance catalogues. To facilitate and unify the communication of plug loads for the estimated model, all appliance powers were summarised under one unit of power density. The average plug load power intensity is 6 W/m2.
15
Table 34.5 Cooking and Domestic hot water
The residential sectors in Egypt mostly consume liquefied petroleum gas (LPG) and natural gas for cooking, electricity and for heating water. Until the early 1990s, the use of LPG canisters for cooking and water heating was the most common way in all three cities. It was not until the beginning of the new millennium that Egypt developed a large transmission network for natural gas thanks to the discovery of deposits in the Delta and Mediterranean. In 2008, 460,000 new apartments were connected to the grid, meaning a total of more than 3.3 million apartments were connected to the national natural gas transmission network (NNGTN). In most large Delta cities, Suez Canal cities, Alexandria and Cairo the NNGTN is well developed, however in Upper Egypt cities (South Cairo) only got connected recently.
In the light of the above review the survey investigated the type of energy and appliances used for cooking and water heating. In the samples of the three cities, most of the investigated
apartments had gas stoves for cooking and water heaters for Domestic Hot Water (DHW). However, many water electric heaters were found in the surveyed apartments in the three cities. Based on the gas utility bills, Figure 8 illustrates the average monthly natural gas consumption for the year 2008 in the three cities. The difference between the summer and winter gas consumption is mainly due to the DHW. On average, the surveyed apartments consume 16000 to 20000 litres per apartment annually. By analysing the gas utility bills we found that during October to April the consumption increased by 2 to 3 times compared to the rest of the year. Thus the pattern of use of water heaters has two different schedules throughout the year. For the simulation model the average DHW was estimated to be 0.35litres/m2/day for the first period (October-April) and 0.05litres/m2/day for the second period (May-September).
16
4.6 Mechanical cooling load intensities 4.6.1 Electric Fans
Fans are an appliance in almost daily use in Egypt and its usage increases especially in the summer season. Electric fans are one of the oldest mechanical devices that entered Egyptian apartments. On a national level, more than 89% of apartments have at least one fan. The most common type is the ceiling fan, besides pedestal, wall and table fans. Figure 1 shows the annual market sales since 1996 [56-57]. Out of the total production, approximately 12 percent of fans are the pedestal type, 25 percent table fans and wall fans and the remaining 63 percent are ceiling fans.
The data collected in the survey shows that the average home in Alexandria, Cairo and Asyut has an average of 2.8, 3.5 and 4.3 ceiling fan units, respectively. The most common fan type is the three blades (48 inch) with a speed of 330 RPM and air flow rate of 3,000 CF/M. The average annual operation time in Alexandria, Cairo and Asyut is 1400, 1800 and 2300 hours respectively with a power of 60watt. The survey results indicate two operational periods for the use of fans. Figure 9 shows an example for annual operation profile of electric fan use in Cairo. The survey results indicate that the apartment usage modes depend on the thermal comfort level. During the warm periods only fans are used and during the hot periods fans and air conditioners are used simultaneously.
Figure 9
4.6.2 Air-conditioners (ACs)
80% of the apartments in the sample had air conditioners (split or window units) serving mainly bedrooms and/or living rooms. At least, one AC unit was found in all apartments surveyed. The operation patterns of air-conditioners serving living rooms and bedrooms followed the occupancy schedules presented in previously in Figure 10. Also the daily winter and summer electricity load profiles were verified by comparing the operation schedules to the national average daily load profiles provided by the National Egyptian Electricity Holding Company as shown in Figure 10.
17
During the summer season air-conditioners in living rooms operated between 17:00 and 23:00 and those serving bedrooms were operative between 23:00 and 5:00. During Ramadan air-conditioners ran for longer periods in living rooms starting from 15:00.
Figure 10
The final survey findings (Figure 11) show that in average the use of air-conditioning raised the annual electricity bill by between 49 and 29 percent (Typology 1 and 2) in Alexandria. In Cairo, the annual electricity bill increase was between 57 and 44 percent, and in Asyut there was an increase of between 65 and 57 percent (Typology 1 and 2).
Figure 11
4.7 Two representative benchmark models
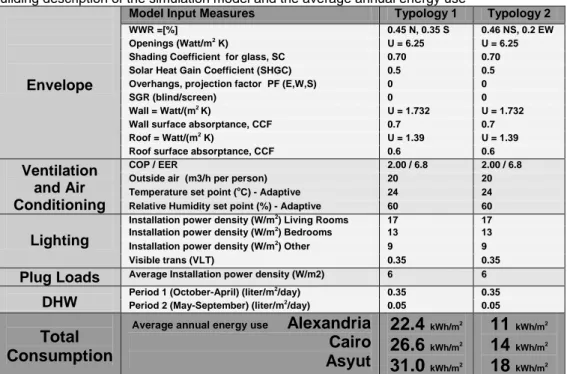
Two representative simulation models were constructed based on the previously described representative internal load intensities and patterns. The capacity and power demand of air-conditioning units, ceiling fans, water heaters, plug loads and lighting appliances for the living rooms and bedrooms in the reference flat were calibrated based on the surveyed monthly utility bills using EnergyPlus for prediction. Table 4 summarises the major simulation input parameter values. The validity of the estimate has been further checked against the public statistics and verified through a model calibration and utility bill comparison.
Table 4
As shown in Figure 11, the estimated average monthly electricity usage matches the simulated one. The model calibration was done over a year and involved several reviews from peer modellers. All the previous load schedules were included in both models. The most significant calibration strategy was the coupling of the ceiling fans’ yearly schedule with the air-conditioning yearly
18
schedule. Three major operation periods are defined resulting in a match with the surveyed monthly electric utility bills profile.
There is good agreement in annual energy consumption behaviour and curve shapes between the simulated data and the survey collected data. The estimated energy demand curve shapes are slightly offset towards high limits than the predicted consumption during summer months and the total annual predicted consumption is higher than the actual by about 2%.
5. Discussion
The great need to approach the opportunities for energy efficiency in the Egyptian residential sector requires the development of verified and updated knowledge on energy performance of residential buildings. Therefore, the main objective of this study was to create simulation models that match the electricity consumption patterns of representative residential apartments. Based on the surveyed apartments, the characteristics and electricity consumption patterns were analysed and the average annual apartment electricity use intensity was defined. During the model verification process several important lessons were learned and other questions were raised.
First of all, the model verification shows that the use of air-conditioners dominated the energy usage in residential buildings in the three cities. Therefore, the electricity consumption patterns of residential apartments would be significantly affected during the extended summer period
(April-October). Identifying the frequency and pattern of use of air-conditioners in relation to indoor
thermal comfort should be a basic step in any future investigation. However, this step is difficult especially during warm periods when mixed mode acclimatisation strategies occur (see Figure 9). The survey results revealed that most of the occupants operate their mechanical equipments within an individual adaptive comfort strategy, integrating natural ventilation (diurnal and nocturnal), electric fans and air-conditioners. Occupants in most of the apartments investigated did not
maintain comfort in their spaces by relying on fixed, preset temperatures. For example, adapting the Fanger‘s or ASHRAE’s comfort model in the simulation resulted in higher energy consumption values that did not match the real consumption patterns [58-60]. At the same time, there is almost no study that documents occupant behaviour in relation to thermal comfort in Egyptian apartments. Therefore, it was necessary during the calibration process to compare simulation results with the
19
monthly electricity bills to match real consumption patterns and to create a consistent operating schedule. Also the comparison showed the importance of identifying the usage pattern of electric fans. Future studies should further investigate the indoor thermal comfort in relation to
environmental control-equipment.
Secondly, the study revealed that all surveyed buildings had a very poor thermal performance and indoor air quality. The building envelopes of most of the buildings investigated are not airtight, with single glazed openings, with non-insulated walls and without shading treatment. On the other hand, the majority (80%) of apartments have been equipped with at least one air conditioner unit which results in peak electric loads that the existing electricity grid cannot provide. For example Cairo has been witnessing frequently electric blackouts every summer since 2004. Thus the potential in energy savings in the area are necessarily and in the same time high. Also the indoor air quality of most investigated apartments is poor. During the field visit in August and September 2008 it was realised that during the operation times of the air conditioners, the occupants keep the apartment closed, sometimes exceeding 10 hours a day without fresh air intake. Keeping in mind that pollution has reached a dangerous level in the three investigated cities and particularly Cairo, providing fresh air and mechanical acclimatisation of indoor spaces for thermal comfort must be coupled with hygienic indoor air quality conditions. This is also an important problem that requires extra attention in the future.
The third lesson learned from this study is related to occupants’ behaviour. Surprisingly, the study revealed that most occupants were conscious about responsibly operating the
air-conditioners, in particular during summer. This is due to the utility bills values that double at
least 6 to 8 times more during June, July and August compared to the winter months (December, January and February). However, the study proved that during the month of
Ramadan there are behavioural changes. TV watching and air-conditioner usage hours increase sharply. Families across the nation gather in the evening to break their fast simultaneously, which results on a spike in power consumption. Also working hours are shortened during the day, which extends the occupancy hours. Despite the difficulty to quantify the occupant behavioural changes during Ramadan, it is sure that there will be a remarkable increase in energy consumption in the
20
residential apartments throughout the coming years during the summer. The Ramadan month will begin approximately 11 days earlier each year, and people will be required to fast for longer periods, exceeding 14 hours per day which consequentially will increase the demand and use of environmental control-equipment. Further comparable studies should investigate the occupant behaviour in relation to energy consumption during this seasonally shifting month.
The fourth remark is related to the appliances and lightings. The survey results showed that the penetration rates of air conditioners, washing machines, were very high. This is due to the
increasing personal income that leads to an unprecedented increase in energy demand. This finding is significant as it matches recent research findings in most of the metropolitan areas located in hot-climate developing countries [61]. The survey findings revealed high penetration and
saturation of domestic appliances among the survey sample. Most apartments were equipped with air-conditioners, fridges, washing machines and fans. However, almost all appliances have no energy description labels. There must be an effort to phase out poor quality and high energy consumption products. Also the efficiency of electric appliances used for lighting could be increased significantly if incandescent lamps were replaced by energy-efficient light bulbs. There is a potential of energy saving in the existing building stock if high efficiency lighting equipment and appliances are used.
The fifth remark is related to global climate change and the heat island effect. Due to the long hot summers in Egypt, there is already an in increase in temperature profiles during the last 10 years all over Egypt [1]. The increasing trend of summer discomfort is creating on top of the current energy demand an incremental demand due to cooling [62]. The continuation of this trend will imply a greater demand for cooling specially in metropolitan areas. This increased cooling demand is unwanted given its impacts on energy consumption and associated emissions, grid feeding stability and the vicious heat island effect [50, 61-62].
A solution to those problems might be switching to solar thermal or solar electric air conditioning systems to break this circle in the future. The use of renewable energy technologies for cooling residential buildings in Egypt should be further investigated. This might result into energy neutral or net zero energy buildings [63]. However, this will require
21
theoretical and experimental studies on urban solar access, urban scale development, solar cooling, thermal comfort, grid interaction, loads matching, feed-in tariffs [64].
Finally, this study proves that there is sufficient evidence that energy efficiency can be improved in the building sector. Despite a great part of precious resources being wasted daily, there is an opportunity to reduce the apartment consumption of energy resources through improved end-use utilisation efficiency. Improving the end-use utilisation efficiency may be achieved by improving the building envelopes, operation patterns and by installing more efficient appliances.
This study builds on earlier studies that have documented the energy consumption in residential buildings in Egypt [42, 46-50, 65-66]. None of these studies, however, provided
detailed benchmark energy models describing the energy characteristics of residential apartments. The present study is an essential first step towards establishing models for the real application of a new energy standard in Egypt. A step that will allow the evaluation of the impact of the new
standard though detailed parametric studies.
6. Conclusion:
Based on the data collected from surveying almost 1500 apartments and examining relevant public statistics, two apartment models comprising a living room, dining room and a bedroom have been constructed for the representation of typical residential buildings in Alexandria, Cairo and Asyut. The key findings from those surveys have been summarised in this paper. The survey results include building physical characteristics and occupancy energy profiles. Also based on that set of data, the average operating patterns of appliances were identified. These energy characteristics of residential apartments were intended to be used to model representative benchmark and reference conditions of residential buildings in Egypt.
The survey results show that electricity use is significantly dominated by the seasonal use of air-conditioners. The use of fans reduced the total annual operation hours of air–conditioners, in particular during the early and late summer periods. The average energy use per apartment for Typology 1 was 22.4kWh/m2/year in Alexandria, 26.6kWh/m2/year in Cairo and 31kWh/m2/year in Asyut. For Typology 2 the average consumption for a typical apartment was 11kWh/m2/year in Alexandria, 14kWh/m2/year in Cairo, and 18kWh/m2/year in Asyut. In addition, the frequency and
22
pattern of use of appliances has been identified. Finally, the results presented in this paper, can provide a good basis for investigating the potential energy savings of applying the new Egyptian energy standard.
7. Acknowledgement
The authors express their thanks to all respondents who participated in the survey and
appreciate their valuable comments and feedback. This paper is part of an ongoing PhD research funded by the Université catholique de Louvain in Belgium.
8. References
[1] Boko M, Niang I, Nyong A, Vogel C, Githeko A, Medany M, Osman-Elasha B, Tabo R, Yanda P. Africa. Climate Change 2007: Impacts, adaptation and vulnerability; Cambridge University
Press.Cambridge UK:433-467.2007.
[2] Abdallah H. Energy efficiency and the Egyptian economy. OPEC Review 1995;19(3):263–281. [3] Abdel-Razek R. Factor affecting construction quality in Egypt: identification and relative
importance. Engineering construction and architectural management 1998;5(3):220-227. [4] El Araby MM. Urban growth and environmental degradation the case of Cairo Egypt. Cities 2002;19(6):389-400.
[5] Fahmi W, Sutton K. Greater Cairo's housing crisis: Contested spaces from inner city areas to new communities, Cities 2008,25(5):277-297. ISSN 0264-2751.
[6] CAPMAS. The final results of population and housing census 2006. Cairo: Central Agency for Public Mobilization and Statistics; 2008.
[7] EEHC. 2008 Annual Report: Egyptian Electricity Holding Company.Cairo;2008.
[8] MTI. A study on the apartment appliances market in Egypt: Ministry of Trade and Industry. Cairo; 2004 ((in Arabic)).
[9] MTI. A study on the apartment appliances market in Egypt: Ministry of Trade and Industry.Cairo; 2004 ((in Arabic)).
[10] IDA. Annual Report: Industrial Development Agency.Cairo;2003 ((in Arabic)).
[11] Mourtada A. National consultation on Egypt’s policies for energy efficiency in buildings in Egypt: Energy efficiency codes in the policy mix. JCEE. MED-ENEC.Cairo;2009. <http://www.jcee-eg.net/download.asp?path=library/NC%20Building%20energy%20Egypt%2009%20report%200906 15.doc> [retrieved 10.10.10].
[12] Soliman A. Legitimizing informal housing: accommodating low-income groups in Alexandria, Egypt. Environment and Urbanization 1996,8(1):183-194.
[13] Georgy R, Soliman A. Energy Efficiency and Renewable Energy Egypt-National study. Cairo: NREA; 2007.
[14] UNHDR. United Nations Human Development Report. Egypt Human Development Report. 2010.<http://www.undp.org.eg/Default.aspx?tabid=227> [retrieved 17.11.10].
[15] Huang J, Deringer J, Krarti M, Masud J. The development of residential and commercial building energy standards for Egypt. Energy Conservation in Buildings Workshop Proceedings. Kuwait;2003.1-16.
[16] HBRC. Egyptian code for energy efficiency improvement in buildings 2006: ECP306. Housing and Building Research Center;Cairo.2005.
[17] Khalil E. Energy efficiency in residential and commercial buildings: Codes and Standards. Global Conference on renewable and energy efficiency for desert regions;Amman.2009.
[18] Aydinalp M, Ugursal V, Fung A, Modeling of the appliance, lighting and space cooling energy consumptions in the residential sector using neural networks. Applied Energy 2002;71:87-110.
23
[19] Sozen A, Arcaklioglu E, Ozkaymak M. Turkey's net energy consumption. Applied Energy 2005;81(2):209-221.
[20] Azadeh A, Ghaderi SF, Sohrabkhani S. A simulated-based neural network algorithm for forecasting electrical energy consumption in Iran. Energy Policy 2008;36(7):2637-2644. [21] Karatasou S, Santamouris M, Geros V. Modeling and predicting building's energy use with artificial neural networks: Methods and results. Energy and Buildings 2006;38(8):949-958. [22] Gonzalez P, Zamarreno J. Prediction of hourly energy consumption in buildings based on a feedback artificial neural network, Energy and Buildings 2005;37(6):595-601.
[23] Abdel-Aal RE, Al-Garni AZ, Al-Nassar YN. Modelling and forecasting monthly electric energy consumption in eastern Saudi Arabia using abductive networks. Energy 1997;22(9):911–21. [24] Bianco V, Manca O, Nardini S. Electricity consumption forecasting in Italy using linear regression models. Energy 2009;34(9):1413–21.
[25] Bianco V, Manca O, Nardini S. Linear regression models to forecast electricity consumption in Italy. Energy Sources, Part B: Economy Plan Policy 2010; in press.
[26] Ranjan M, Jain VK. Modelling of electrical energy consumption in Delhi. Energy 1999;24(4):351–61.
[27] Abosedra S, Dah A, Ghosh S. Electricity consumption and economic growth, the case of Lebanon. Applied Energy 2009;86:429–32.
[28] Mohamed Z, Bodger P. Forecasting electricity consumption in New Zealand using economic and demographic variables. Energy 2005; 30(10):1833–43.
[29] Pachauri S. An analysis of cross-sectional variations in total household energy requirements in India using micro survey data. Energy Policy 2004;32:1723–1735.
[30] Murata A, Kondou Y, Hailin M, Weisheng Z. Electricity demand in the Chinese urban household-sector. Applied Energy 2008;85(12):1113-1125.
[31] Mansouri I, Newborough M, Probert D. Energy Consumption in UK Households: Impact of Domestic Electrical Appliances. Applied Energy 1996;54(3):211-285.
[32] Lam J, An analysis of residential sector energy use in Hong Kong. Energy 1996;21(1):1-8. [33] Xiaohua W, Zhenming F. Rural household energy consumption in Yangzhong county of Jiangsu province in China. Energy 1997;22(12):1159-1162.
[34] Lam J. Residential sector air conditioning loads and electricity use in Hong Kong. Energy Conversion & Management 2000;41:1757-1768.
[35] Geoffrey T, Kelvin Y. A study of domestic energy usage patterns in Hong Kong. Energy 2003;28:1671-1682.
[36] Wan K, Yik F. Representative building design and internal load patterns for modelling energy use in residential buildings in Hong Kong. Applied Energy 2004;77:69-85.
[37] Wan K, Yik F. Building design and energy end-use characteristics of high-rise residential buildings in Hong Kong. Applied Energy 2004;78:19-36.
[38] Macmillan S, Köhler J. Modelling energy use in the global building stock: a pilot survey to identify available data sources. Technical Report 6, Tyndall Centre for Climate Change Research;2004.
[39] Khalil E. Energy Performance of Buildings Directive in Egypt: A New Direction. HBRC Journal 2005;1(11):197-213.
[40] OEP/DRTPC. Energy consumption survey on the residential sector in Cairo. Development Research and Technological Planning Center. Cairo University.1999.
[41] Abu-Alam Y. UNDP/GEF Project in Egypt energy efficiency improvement and greenhouse gas reduction. IEEE Proceedings 2000;1:648-650.
[42] GEF, UNDP. Energy Survey and Environmental Indicators in the Residential Sector in Greater Cairo, Energy Efficiency Improvement and Greenhouse Gas Reduction Project Cairo.2003. [43] Khalil E. Baseline Study for Egypt, Energy efficiency in the construction sector in Mediterranean, energy Research Center Faculty of engineering; Cairo University.2006.
<http://www.med-enec.com/sites/default/files/user_files/downloads/EGY%20Baseline%20study.pdf
>.
[44] UNDP Egypt Office. In Fact: Energy efficiency improvement and Greenhouse Gas (GHG) reduction. September 17th; 2003. <http://www.undp.org.eg/programme/updated%20factsheets/ENV /EGY_97_G31.pdf> [retrieved 09.05.10].
24
[45] ECEP/DRTPC. Residential Energy Survey and Environmental Indicators in Greater Cairo. Report prepare by the Energy Conservation and Environmental program at Development Research and Technological planning Center. University and the Organization for Energy
Planning.Cairo:2001.
[46] OEP, AU. Analysis of energy consumption pattern and environmental indicators for the residential sector of Asyut city. Asyut University, Faculty of Engineering, Organization for Energy Planning.Cairo:2002.
[47] Aziz S, Guindi SE, Shobokshi HE, Osman H, Adham R. Residential building survey in Cairo and Alexandria, Final report for the building energy code project: Housing and Building Research Centre;Cairo:2001.
[48] Aziz S. General Building Survey - Building Energy Code Project: Housing and Building Research Centre;Cairo:2003.
[49] Michel S, Elsayed H. Examples of low energy design at urban scale in Egypt. In: 26th international PLEA Conference,Geneva;2006.885-890.
[50] Attia S, De Herde A. Impact and potentials of community scale low-energy retrofit: case study in Cairo. In: international SASBE
conference,2009.Delft.<http://www.sasbe2009.com/proceedings/documents/SASBE2009_paper_IM
PACT_AND_POTENTIAL_OF_COMMUNITY_SCALE_LOW-ENERGY_RETROFIT_-_CASE_STUDY_IN_CAIRO.pdf>.
[51] Zhang Q. Residential energy consumption in China and its comparison with Japan, Canada, and USA. Energy and Buildings 2004;36(12):1217-1225.
[52] Swan LG, Ugursal VI. Modeling of end-use energy consumption in the residential sector: A review of modeling techniques. Renewable and Sustainable Energy Reviews 2009;13(8):1819-1835.
[53] DOE. EnergyPlus;2010.<http://apps1.eere.energy.gov/buildings/energyplus/>[retrieved 01.05.10].
[54] EMA. Egyptian Meteorological Authority. Cairo: Egyptian Meteorological
Authority;2010.<http://www.ema.gov.eg/map?menu=3&lang=en>[retrieved 01.04.10].
[55] Attia S, De Herde A. Bioclimatic Architecture: Design Strategies in Egypt. In: international Sustainable Energy Technologies Conference.Aachen;2009.
[56] Abdelhafiz F. Study on the apartment appliance in the Egyptian market and its export potential. Industrial Development Authority, Ministry of Trade and Industry. Cairo,2004; ((in Arabic)).
<http://www.tpegypt.gov.eg/ArStudies/d_elagalhaza.pdf
>
[retrieved 01.04.10].[57] INCOM. A study on the penetration of iron machines, fans, and mixer in Egyptian apartments for Advanced System Company. Cairo,2008; ((in Arabic)).
[58] Fanger PO. Thermal comfort: analysis and applications in environments engineering. Copenhagen: Danish Technical Press; 1970.
[59] EN ISO 7730. Ergonomics of the thermal environment – Analytical determination and interpretation of thermal comfort using calculation of the PMV and PPD indices and local thermal comfort criteria. International Organization for Standardization; Geneva 2005.
[60] AHSRAE. ASHRAE Standard 55: Thermal Environmental Conditions for Human Occupancy. American Society of Heating. Refrigerating and Air-Conditioning Engineers. 2004:35.
[61] Sivak M. Potential energy demand for cooling in the 50 largest metropolitan areas of the world: Implications for developing countries, Energy Policy 2009;37:13821384.
[62] Lam JC, Wan KKW, Wong SL, Lam TNT. Long-term trends of heat stress and energy use implications in subtropical climates. Applied Energy 2010;87(2):608-612.
[63] Bojic M, Nilolic N, Nikolic D, Skerlic J, Miletic I. Toward a positive-net-energy residential building in Serbian conditions. Applied Energy 2011;88(7):2407-2419.
[64] Attia S, De Herde A. Strategic Decision Making For Zero Energy Buildings in Hot Climates. In International EuroSun Conference.Graz;2010.
[65] Khattab AS. The impact of reducing energy subsidies on energy intensive industries in Egypt. ECES Working Paper No.124;2007.
[66] Hanna G. Energy analysis for new residential buildings in Egypt. In: international Future Vision and challenges for urban development conference.Cairo;2004.
25
Figure 1. Increasing air-conditioner and fan sales in Egypt between 1996 and 2009 Figure 2. The selected neighbourhoods (source Google).
Figure 3. Typical floor plan of Typology 1 in its urban context Figure 4. Typical floor plan of Typology 2 in its urban context Figure 5. Surveyed monthly electricity use for both apartment models Figure 6, Occupancy schedules of the surveyed apartments (average) Figure 7, Lighting schedules of the surveyed apartments (average) Figure 8, the average surveyed natural gas consumption per apartment Figure 9, Annual fan and air conditioning operation profile in Cairo
Figure 10. National daily average electrical load profiles for residential buildings in 2008 Figure 11, Surveyed and simulated monthly electricity usage for both apartment models
Table 1. Both typologies’ building description
Table 2. Occupation status of apartment members in a typical apartment of five family members *Ramadan 2008 was during the summer vacation
**During the weekend (Friday and Saturday) all members would stay home Table 3.
* per block
Table 4. Building description of the simulation model and the average annual energy use
* The design parameters list and their range of values was derived from the standard for residential conditioned buildings
Figure 01
Figure 02
Figure 03
Figure 04
Figure 05
Figure 06
Figure 07
Figure 08
Figure 09
Figure 10
Figure 11
Table 01, both typologies building description
Building Description
Typology1
Typology2
Shape No. Floors & Height
Aspect Ratio
Rectangular (25 m x 11 m) 6 & 2.8 m height per floor 2.3/1
Rectangular (30 m x 20 m) 12 & 2.7 m height per floor 1.5/1
Apartment Description
Volume External Wall area Roof area Floor area Windows area Glazing U-Value Exterior Wall U-Value Roof U-value Floor U-value Single Clear Glazing SHGC 366 m3 110 m2 122 m2 122 m2 60 m2 6.25 W/m2 K 2.5 W/m2 K 1.39 W/m2 K 1.58 W/m2 K Tv = 0.88 0.75 337.5 m3 68 m2 125 m2 125 m2 13 m2 6.25 W/m2 K 2.5 W/m2 K 1.39 W/m2 K 1.58 W/m2 K Tv = 0.88 0.75 Table 1
Table 2: occupation status of apartment members in a typical apartment for five family members 2008 Member 1 2 3 4 5 Season1 04/Oct-30/Mai Employment Occupancy Full-time 08:00-18:00 Unemployed 14:00-15:00 Student 7:30-15:00 Student 7:30-15:00 Student 7:30-13:00 Season2 01/Jun-30/Aug Employment Occupancy Full-time 08:00-18:00 Unemployed - Student - Student - Student - Ramadan* 31/Aug-29/Sept Employment Occupancy Full-time 08:30-16:00 Unemployed - Student - Student - Student - *Ramadan 2008 was during the summer vacation
**During the weekend (Friday and Saturday) all members would stay home
Table 3, Occupation status of apartment members in a typical flat for five family members Appliance Watt Daily Operating
Hours
Appliance Watt Daily Operating Hours
Exhaust fan 150 24 Television 3 6
Satellite decoder 3 0.2 Washing machine 512 0.2
Mobile charger 5 24 Refrigerator 380 24
Phone charger 3 3 Kettle 1800 0.1
*Collective Water pump 300 0.1 PC or Laptop 300/60 2
Electric Iron 1100 0.1 Mixer 127 0.05
Vacuum cleaner 630 0.1 Stereo 100 0.1
Fans (2-4) 88 (section 3.3.2) Gas Water Heater - - * per block
Table 04: Building description of the simulation model and the average annual energy use
Envelope
Model Input Measures Typology 1 Typology 2 WWR =[%] 0.45 N, 0.35 S 0.46 NS, 0.2 EW Openings (Watt/m2 K) U = 6.25 U = 6.25 Shading Coefficient for glass, SC 0.70 0.70 Solar Heat Gain Coefficient (SHGC) 0.5 0.5 Overhangs, projection factor PF (E,W,S) 0 0
SGR (blind/screen) 0 0
Wall = Watt/(m2
K) U = 1.732 U = 1.732
Wall surface absorptance, CCF 0.7 0.7 Roof = Watt/(m2
K) U = 1.39 U = 1.39
Roof surface absorptance, CCF 0.6 0.6
Ventilation and Air Conditioning
COP / EER 2.00 / 6.8 2.00 / 6.8
Outside air (m3/h per person) 20 20 Temperature set point (o
C) - Adaptive 24 24
Relative Humidity set point (%) - Adaptive 60 60
Lighting
Installation power density (W/m2
) Living Rooms 17 17 Installation power density (W/m2) Bedrooms 13 13 Installation power density (W/m2) Other 9 9
Visible trans (VLT) 0.35 0.35
Plug Loads Average Installation power density (W/m2) 6 6
DHW Period 1 (October-April) (liter/m
2/day) 0.35 0.35
Period 2 (May-September) (liter/m2
/day) 0.05 0.05
Total
Consumption
Average annual energy use
Alexandria
Cairo
Asyut
22.4
kWh/m226.6
kWh/m231.0
kWh/m211
kWh/m214
kWh/m218
kWh/m2* The design parameters list and their range of values was derived from the standard for residential conditioned buildings ** If WWR exceeds 30% then SHGC=0.1