HAL Id: hal-02989762
https://hal.archives-ouvertes.fr/hal-02989762
Submitted on 5 Nov 2020
HAL is a multi-disciplinary open access
archive for the deposit and dissemination of
sci-entific research documents, whether they are
pub-lished or not. The documents may come from
teaching and research institutions in France or
abroad, or from public or private research centers.
L’archive ouverte pluridisciplinaire HAL, est
destinée au dépôt et à la diffusion de documents
scientifiques de niveau recherche, publiés ou non,
émanant des établissements d’enseignement et de
recherche français ou étrangers, des laboratoires
publics ou privés.
spectra and GALEX photometry
A Werle, R Fernandes, N Asari, P R T Coelho, G Bruzual, S Charlot, R de
Carvalho, F Herpich, C Mendes de Oliveira, L Sodré, et al.
To cite this version:
A Werle, R Fernandes, N Asari, P R T Coelho, G Bruzual, et al.. Clues on the history of early-type
galaxies from SDSS spectra and GALEX photometry. Monthly Notices of the Royal Astronomical
Society, Oxford University Press (OUP): Policy P - Oxford Open Option A, 2020, 497 (3),
pp.3251-3263. �10.1093/mnras/staa2217�. �hal-02989762�
Clues on the history of early-type galaxies from SDSS
spectra and GALEX photometry
A. Werle,
1,2,3
?
R. Cid Fernandes,
3
N. Vale Asari,
3,4
†
P. R. T. Coelho,
2
G. Bruzual,
5
S. Charlot,
6
R. R. de Carvalho,
7
F. R. Herpich,
2
C. Mendes de Oliveira,
2
L. Sodr´e Jr.,
2
D. Ruschel-Dutra,
3
A. de Amorim
3
and V. M. Sampaio
7,8
1INAF - Osservatorio Astronomico di Padova, Vicolo dell’Osservatorio 5, 35122 Padova, Italy
2Instituto de Astronomia, Geof´ısica e Ciˆencias Atmosf´ericas, Universidade de S˜ao Paulo, R. do Mat˜ao 1226, 05508-090 S˜ao Paulo, Brazil 3Departamento de F´ısica - CFM - Universidade Federal de Santa Catarina, Florian´opolis, SC, Brazil
4School of Physics and Astronomy, University of St Andrews, North Haugh, St Andrews KY16 9SS, UK
5Instituto de Radioastronom´ıa y Astrof´ısica, Universidad Nacional Aut´onoma de M´exico, Morelia, Michoac´an, 58089 M´exico 6Sorbonne Universit´es, UPMC-CNRS, UMR7095, Institut d’Astrophysique de Paris, F-75014, Paris, France
7NAT-Universidade Cruzeiro do Sul / Universidade Cidade de S˜ao Paulo, Rua Galv˜ao Bueno, 868, 01506-000, S˜ao Paulo, SP, Brazil 8Instituto Nacional de Pesquisas Espaciais/MCT, S˜ao Jos´e dos Campos, Brazil
Accepted XXX. Received YYY; in original form ZZZ
ABSTRACT
Stellar population studies of early-type galaxies (ETGs) based on their optical stellar continuum suggest that these are quiescent systems. However, emission lines and ultra-violet photometry reveal a diverse population. We use a new version of the starlight spectral synthesis code and state-of-the-art stellar population models to simultane-ously fit SDSS spectra and GALEX photometry for a sample of 3453 galaxies at z < 0.1 with NUV − r > 5 that are classified as elliptical by Galaxy Zoo. We reproduce FUV magnitudes for 80 per cent of UV upturn galaxies selected using criteria from the lit-erature, suggesting that additional stellar population ingredients such as binaries and extreme horizontal branch stars may have a limited contribution to the UV upturn. The addition of ultraviolet data leads to a broadening of the distributions of mean stellar ages, metallicities and attenuation. Stellar populations younger than 1 Gyr are required to reproduce the ultraviolet emission in 17 per cent of our sample. These systems represent 43 per cent of the sample at 5 < NUV − r < 5.5 and span the same stellar mass range as other ETGs in our sample. ETGs with young stellar components
have larger Hα equivalent widths (WH α) and larger dust attenuation. Emission line
ratios and WH αindicate that the ionising source in these systems is a mixture of young
and old stellar populations. Their young stellar populations are metal-poor, especially for high-mass galaxies, indicating recent star formation associated with rejuvenation events triggered by external processes, such as minor mergers.
Key words: galaxies: evolution – galaxies: stellar content – galaxies: elliptical and
lenticular, cD – ultraviolet: galaxies
1 INTRODUCTION
Historically, early-type galaxies (ETGs) have been thought of as a more-or-less coeval population of galaxies. Indeed, studies based on their optical stellar continuum are limited in their ability to probe the diversity of this galaxy popu-lation. However, studying ETGs in other wavelengths (e.g.
? E-mail: ariel.werle@inaf.it
† Royal Society–Newton Advanced Fellowship
Code & Welch 1979;Kaviraj et al. 2007;Welch et al. 2010; Yi et al. 2011;Simonian & Martini 2016) or looking closely at emission lines (Herpich et al. 2018) and even specific spec-tral indices in the optical (e.g.Caldwell et al. 2003) reveals a much more complex and intriguing picture. In particular, studies in the ultraviolet (UV) range have opened an impor-tant window to our understanding of these systems.
Some ETGs exhibit a phenomenon called the UV up-turn, a strong rise in emission towards the far-UV in galax-ies with otherwise red spectra that was first identified by
Code & Welch(1979, see review byYi 2008). Several possi-ble sources have been proposed, associated with several dif-ferent kinds of stars, the most likely candidates being core helium burning stars in the horizontal branch (HB) and ex-treme horizontal branch (EHB), and their post-asymptotic giant branch (post-AGB) progeny (e.g. Greggio & Renzini 1990;Dorman et al. 1993; Yi et al. 1997;O’Connell 1999; Deharveng et al. 2002;Petty et al. 2013;Hern´andez-P´erez & Bruzual 2014). Direct evidence of UV emission from resolved hot HB stars was found byBrown et al.(2000b) in the core of the local early-type galaxy M32. Overall, the population of UV upturn galaxies is brighter, redder in the optical, and more massive than other ETGs (e.g.Dantas et al. 2020;Le Cras et al. 2016b, and references therein). There is also evi-dence for an evolution of the fraction of UV upturn systems with redshift. Brown et al.(2000a) found that the far-UV emission from quiescent galaxies is weaker at z= 0.55 than at z ∼ 0. Le Cras et al. (2016b) also find a rise in the fre-quency of UV upturn systems towards low z, in a way that is consistent with the evolution of low-mass stars.
Ultraviolet information also allows the detection of small amounts of young stellar populations in ETGs (e.g. Burstein et al. 1988; Yi et al. 2005; Jeong et al. 2009; Vazdekis et al. 2016). Several works have taken advantage of this feature.Kaviraj et al.(2007), who combined photome-try from SDSS and GALEX, find at least some level of young stellar populations (1–3 per cent of stellar mass) in ∼ 30 per cent of their sample of ETGs. Also using GALEX and SDSS photometry,Schawinski et al.(2007) find that 30±3 per cent of massive ellipticals show signs of recent star-formation. Recently, Salvador-Rusi˜nol et al.(2019) used spectra from the Baryon Oscillation Spectroscopic Survey Dawson et al. (2013) covering the near-ultraviolet range to show that ∼ 0.5 per cent of the mass of their sample of ETGs was in stars younger than 2 Gyr, with the fraction decreasing with stel-lar mass according to a downsizing pattern. Several other studies also find that the UV colours of some ETGs can-not be explained by old populations alone (e.g. Deharveng et al. 2002;Yi et al. 2011, see alsoKauffmann et al. 2007). The detection of young stellar populations is key to address whether the formation of ETGs is consistent with a a mono-lithic scenario (Larson 1974), in which galaxies form from a single burst of star-formation, or a hierarchical one, where the galaxies undergo significant merging and have a more extended star-formation history (seeKaviraj et al. 2005and references therein).
Other studies also point to this complex view of early-type galaxies.Bica & Alloin(1987) found evidence of young stellar populations in NGC 2865, NGC 4382, and NGC 5102. Recently, Pawlik et al. (2018) found that 40 per cent of massive post-starburst galaxies in the local universe are the result of red sequence galaxies undergoing ‘rejuvenation events’ and moving towards the massive end of the red se-quence through minor mergers. Such rejuvenation of ETGs has also been observed at z ∼ 0.8 byChauke et al. (2019). Works by the SAURON collaboration have found that ETGs can be divided in fast and slow rotators (Emsellem et al. 2007) according to the prominence of their rotational com-ponent, a classification that has been linked to different formation processes (Cappellari et al. 2011;Penoyre et al. 2017; Smethurst et al. 2018). A recent paper by Carleton et al.(2020) shows a discrepancy between UV and Hα
star-formation rates in massive galaxies at z ∼ 1, indicative of low-level bursty star-formation. A series of papers from the SPIDER project also shed light on the diversity of the pop-ulation of ETGs and the environmental processes involved in their formation (e.gLa Barbera et al. 2010,2014).
The interstellar medium (ISM) of ETGs also provides information on the variety of physical processes taking place in these systems. There is copious evidence of small amounts of cold gas in atomic and molecular form in the ISM of ETGs (e.g.Welch et al. 2010,Agius et al. 2013,Janowiecki et al. 2020, see also Knapp 1999), and the presence of molecular gas have been associated with younger ages (Young et al. 2014). Herpich et al. (2018) have investigated differences between ETGs with and without emission lines. The au-thors have shown that the galaxies where emission lines are detected also have more 12 µm emission (WISE W3 band), attributed to the emission from the policyclic aromatic hy-drocarbon (PAH) powered by a hard ionizing field produced by hot low-mass evolved stars (HOLMES; Stasi´nska et al. 2008;Flores-Fajardo et al. 2011).
InWerle et al. (2019, hereafter W19), we presented a combined analysis of SDSS spectra and GALEX photometry with the starlight spectral synthesis code (Cid Fernandes et al. 2005, see also L´opez Fern´andez et al. 2016). This ap-proach allows us to distinguish between different sources of UV emission in ETGs, an asset that was only briefly men-tioned by W19. In this paper, we use the W19 synthesis method to revisit previous works on the UV emission of ETGs. In particular, we focus in ETGs in the red sequence (NUV − r > 5), which are generally thought of as quiescent systems. Although a lot of work has been done to charac-terise and study the stellar populations of ETGs in the ul-traviolet (Yi et al. 2011;Hern´andez-P´erez & Bruzual 2014, to name a few), these works are based on single stellar pop-ulations or parametric fits to broad-band measurements of the spectral energy distribution (seeWalcher et al. 2011and Conroy 2013for reviews), imposing certain assumptions on the star-formation histories of ETGs. Our non-parametric star-formation histories obtained from a combination of full spectral fitting in the optical and photometric constraints in the ultraviolet allow for a more agnostic approach, which is the basis of our contribution to the field.
The paper is organised as follows. Section2 describes our data and sample. Section3details our spectral synthe-sis procedure and results. In Section4we use our synthesis results to explore some open questions in early-type galaxy formation. Finally, conclusions are summarised in Section5. Throughout this work, we assume a standard ΛCDM cos-mology with ΩM= 0.3, ΩΛ= 0.7 and h = 0.7. We adopt the
solar metallicity value of Z = 0.017.
2 DATA AND SAMPLE
Here we present a quick review of the data sources used throughout this work and how these data were processed before our analysis.
2.1 Data sources
The core analysis of this work relies on a combination of spectra from the seventh data release of the Sloan Digital
Sky Survey (SDSS DR7;York et al. 2000;Abazajian et al. 2009;www.sdss.org) and photometry from the Galaxy Evo-lution Explorer (GALEX;Martin et al. 2005).
GALEX provides photometry in two UV bands: NUV (λeff = 2267˚A) and FUV (λeff = 1528˚A). SDSS spectra
typi-cally cover the region between 3800 and 9200˚A in the rest-frame, with spectral resolution R ≡ λ/∆λ ∼ 1800. GALEX carried out a series of surveys, the main ones being the AIS (All Sky Imaging Survey), which imaged the whole sky down to a magnitude of 20.5, and the MIS (Medium Imaging Sur-vey), which observed 1000 square degrees of the sky down to magnitude 23. Here we use a combination of data from both surveys.
Although GALEX and SDSS comprise our main data sources, other catalogues are also used throughout this pa-per. We use emission line measurements fromMateus et al. (2006), galaxy environmental parameters from the catalogue of Yang et al. (2007), morphological information from the Galaxy Zoo project (Lintott et al. 2008) and mid-infrared photometry from the Wide-field Infrared Survey Explorer (WISE,Wright et al. 2010).
2.2 Pre-processing
Magnitudes used to compute NUV −r and FUV −NUV colours are k-corrected to redshift z= 0 using the kcorrect soft-ware (Blanton & Roweis 2007) and corrected for Galactic extinction using a Cardelli, Clayton & Mathis (1989) ex-tinction law with RV = 3.1 and E(B − V) values from the
dust map ofSchlegel et al. (1998), taking into account the re-calibration introduced by Schlafly & Finkbeiner (2011), i.e. setting E(B − V ) to 86 per cent of the value found in the map ofSchlegel et al.(1998). GALEX magnitudes used in the starlight fits were scaled to the SDSS spectroscopic aperture (1.5 arcsec in radius) using the process described in W19.
Spectra are corrected for offsets in the SDSS spec-trophotometric calibration by matching synthetic photom-etry in the r-band to observed r-band magnitudes in the SDSS spectroscopic aperture. This same procedure was used in the MPA/JHU value-added catalogue1. Spectra are then corrected for Galactic extinction using the same method ap-plied to the photometry and, as a last step, are shifted to the rest-frame.
2.3 Sample selection
For our core sample, we select galaxies in the SDSS Main Galaxy Sample with z < 0.1 that were observed in both GALEX bands and are classified as elliptical by Galaxy Zoo.2 Since we are interested in red sequence galaxies, we require NUV − r > 5 for the integrated (i.e. Petrosian) pho-tometry and also for the aperture phopho-tometry in a 1.5 arcsec radius, consistent with SDSS spectra. For the aperture pho-tometry, we take into account the aperture correction for
1 https://wwwmpa.mpa-garching.mpg.de/SDSS/DR7
2 Although the term “elliptical” is used in the Galaxy Zoo cat-alogue, this classification includes both elliptical and lenticular galaxies, as stressed byLintott et al.(2008). Therefore, the cor-rect term to describe galaxies in our sample is “early-type”.
the GALEX magnitudes described in W19. This constitutes a sample of 3453 early-type galaxies.
3 MODELLING THE UV-OPTICAL EMISSION
FROM EARLY-TYPE GALAXIES
Reproducing the spectral energy distributions of ETGs while correctly disentangling UV emission from young and old hot stars is challenging, especially when employing non-parametric methods. In this section we describe our method, discuss its limitations and present the main changes in the derived physical properties with respect to optical-only ap-proaches.
3.1 Spectral synthesis method
The spectral fits presented in this work are performed with starlight (Cid Fernandes et al. 2005), a spectral synthesis code that models galaxy spectra through a non-parametric combination of stellar population spectra. The code also fits for stellar kinematics and dust attenuation, assuming a fixed attenuation law. starlight’s fitting procedure is based in a custom implementation of simulated annealing and Markov Chain Monte Carlo that allows the code to capture complex star-formation histories. In this work, we use the version of the code introduced in W19 and inL´opez Fern´andez et al. (2016), which enables the simultaneous analysis of spectro-scopic and photometric data.
The stellar population spectra used in this work are built from an updated version of the Bruzual & Char-lot (2003) simple stellar population (SSP) models (Char-lot & Bruzual, in prep). These models are based on PAR-SEC isochrones from Chen et al. (2015) (see also Bressan et al. 2012) and a series of stellar libraries, including MILES (S´anchez-Bl´azquez et al. 2006) and IndoUS (Valdes et al. 2004) in the optical and a blend of theoretical libraries in the UV (e.g.Lanz & Hubeny 2003a,b;Rauch 2003;Hamann & Gr¨afener 2004;Martins et al. 2005;Lanz & Hubeny 2007; Leitherer et al. 2010, see W19 for more references). In this work, we use models obtained with aChabrier(2003) initial mass function.
In Fig.1we show the evolution in time of several SSP models in the FUV − NUV versus NUV − r colour-colour di-agram. Hashed regions in the diagram indicate the crite-ria used byYi et al. (2011) to classify ETGs according to their UV emission. We note that in a subsequent section we will present our own criteria to sub-divide the population of ETGs. Solid lines show the evolution of models used in this paper, i.e. those using the post-AGB evolutionary prescrip-tion byVassiliadis & Wood(1993,1994, VW hereafter), as described inBruzual & Charlot(2003). Models are plotted in the age range from 2 to 14 Gyr (clockwise) for three metallic-ity values. Dashed lines correspond to the same models but using the post-AGB evolution by Miller Bertolami (2019, and private communication, MB hereafter); these models do not reach the UV upturn regime. Black dots show a so-lar metallicity model for which the post-AGB evolutionary phase is removed from the tracks and replaced by an ad-hoc contribution of HB stars of increasing temperature, ranging from 8,000 to 30,000 K (clockwise). The latter models fall in the UV-upturn trapezoid for effective temperatures between
3.5 4.0 4.5 5.0 5.5 6.0 6.5 7.0 N U V − r 0 1 2 3 4 F U V − N U V Z = 0.47 Z , VW Z = Z , VW Z = 1.76 Z , VW Z = 0.47 Z , MB Z = Z , MB Z = 1.76 Z , MB Z = Z , HB UV weak UV upturn
Figure 1. Evolution of simple stellar population models in the FUV − NUV versus NUV − r colour-colour diagram. Models that follow the post-AGB evolutionary prescriptions by Vassiliadis & Wood (VW, solid lines) and Miller Bertolami (MB, dashed lines) are compared with pure HB models (black dots).
10,000 and 30,000 K. In this paper we adopt the VW models because they follow a physically motivated post-AGB evo-lution and provide reasonable fits to our data. Using models with HB stars would require updates to the SSP models that are beyond the scope of this paper.
We combine the SSP models in order to build a library of composite stellar populations (CSPs), assuming constant star-formation over a certain period of time. The main dif-ference in this regard between the stellar population models of this paper and the ones from W19 is in how we define the age intervals to build the CSPs. In W19, the CSPs are calculated in time bins that are uniformly sampled in log-arithmic space from 0 to 14 Gyr. Thus, the oldest stellar population spanned a very wide age range (from 8 Gyr to 14 Gyr). Since here we are interested in spectral features that significantly change in this age range, we split this time interval into five. We also allow for two extra metallicities (Z= 1.17 and 2.35Z ). These changes are important in
or-der to reproduce the UV slopes of some UV upturn galaxies. The strongest UV upturns are predicted to be in the very old stellar populations (older than 10 Gyr). Since in W19 we assumed logarithmically spaced age bins, some of these very old stellar populations were averaged with slightly younger (or less old) ones, and had their UV upturns diluted away. Our new base has 180 components, comprising 20 ages and 9 metallicities. We note that throughout this paper we cal-culate mean stellar ages by assigning to each CSP an age corresponding to the centre of the corresponding age bin.
As in W19, we account for dust attenuation using a Calzetti, Kinney & Storchi-Bergmann (1994) attenuation law modified in the λ < 1800 ˚A region to smoothly tran-sition to the law of Leitherer et al.(2002). The scheme to combine spectroscopic and photometric figures of merit was kept the same as in W19, as were all other starlight tech-nical parameters. The choice of parameters is conservative, in the sense that they do not allow starlight to reduce the quality of the optical fits in order to reproduce the UV.
−0.8 −0.6 −0.4 −0.2 0.0
(N
U
V
mo d−
N
U
V
obs)
/σ
N U V 5.0 5.5 6.0 6.5N U V
− r
−0.1 0.0 0.1 0.2 0.3 0.4 0.5(F
U
V
mo d−
F
U
V
obs)
/σ
F U V 0 500 1000N
0 100 200N
Figure 2. Median residuals in FUV and NUV bands plotted against NUV − r color. Projected histograms show NUV − r color (top), NUV residual (top-right) and FUV residuals (bottom-right). Error-bars represent the interquartile regions.
3.2 Quality of the fits
To evaluate the quality of our fits across the red sequence, we calculate the UV residuals, defined as the difference be-tween modelled and observed magnitudes divided by the corresponding observational error, and plot them against the NUV − r colour (Fig2). In general, the fits are remark-ably good, although we notice that the quality of the fits decreases for NUV − r > 6. While the fits remain within error-bars (residuals between −1 and 1), one notices a sys-tematic effect where FUV flux is under-estimated and NUV flux is over-estimated. We note, however, that galaxies with NUV − r > 6.5 are systematically fainter, with NUV mag-nitudes close to the detection limit of GALEX. As a conse-quence, sources can be detected only when counts fluctuate above the detection limit. Thus, the bias seen for the NUV band is related to an artifact of the sample selection.
In order to test our ability to reproduce the UV upturn phenomenon, we have selected UV upturn galaxies using the criteria ofYi et al.(2011):NUV − r> 5.4, FUV − NUV < 0.9
and FUV − r< 6.6. These criteria have been originally pro-posed to separate true UV upturn galaxies from early-type galaxies with residual star-formation, althoughDantas et al. (2020) have shown that this cut still allows for a minor con-tamination from red sequence galaxies with emission lines consistent with residual star formation. In any case these criteria are commonly used in the literature and are use-ful for comparison. We find that the FUV band is modelled within 0.25 magnitudes in 62.1 per cent of UV upturn galax-ies, with 80.8 per cent of the fits within error bars.
This indicates that the old and hot stellar components included in the stellar population models – namely the cen-tral stars of planetary nebulae and white dwarfs – can ac-count for the majority of the UV upturn phenomenon in our sample. We interpret that additional components such as binaries (e.g.Han et al. 2007;Eldridge & Stanway 2012; Hern´andez-P´erez & Bruzual 2014) or EHB stars (e.g.Brown et al. 2000a; Petty et al. 2013) are still required to model some galaxies, although their contribution is likely limited overall.
3.3 Some representative cases
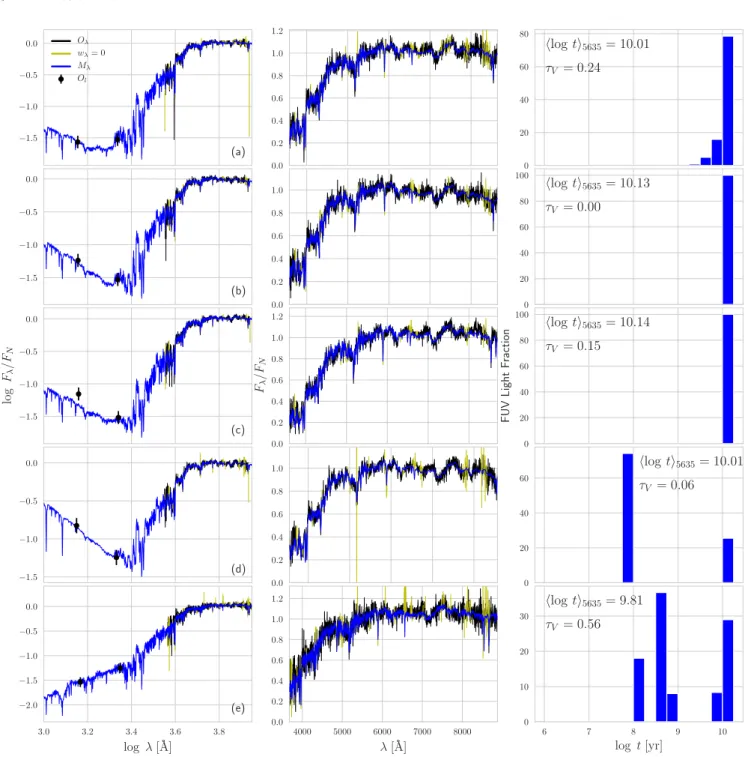
While ETGs are virtually indistinguishable from each other based on their stellar continuum in the optical, UV infor-mation reveals a wide variety of sources within these ob-jects. Such variety, coupled with the incompleteness of the available models and the ‘principle of maximum ignorance’ (seeCid Fernandes 2007) manifested in starlight’s fitting philosophy, calls for a somewhat artisanal analysis of the dataset. With that spirit in mind, we have visually inspected all of the 3543 spectral fits to evaluate their quality (or lack thereof) and interpret results. Some representative cases of spectral fits are shown in Fig.3. The left column of panels in the figure shows the UV-optical fit in log scale to high-light the UV, panels in the middle show the optical spec-tra and panels in the right handside show the FUV popu-lation vector, indicating which stellar popupopu-lations account for the FUV emission in each galaxy (see W19 for details on λ-dependent population vectors). Each row of panels corre-sponds to a particular galaxy in our sample.
Fig.3(a) shows a textbook example of ETG, with flat UV spectrum and only old stellar populations. While in the typical UV-weak ETG (such as Fig.3a) there is some mix-ture of different stellar populations, UV upturn galaxies such as the one shown in Fig3(b) are dominated only by the old-est stellar populations available in the models, which is nec-essary to simultaneously reproduce their very red NUV − r and blue FUV − NUV . For some UV upturn galaxies, the models from our library are incomplete. This is the case shown in panel (c) of Fig3, where the FUV − NUV colour achieved by starlight is slightly redder than what is ob-served. Even allowing only for the oldest stellar populations, the fact that aτV = 0.15 was found for the galaxy in panel
(c) can be an indication that starlight is using dust as a way of forcing the models to become redder in order to reproduce NUV − r, which in turn makes FUV − NUV too red. Our inability to fit the FUV band in case (c) could be due to variations in the shape of the attenuation curve, al-though we deem this unlikely as W19 showed that there is very little variation in the fits obtained with the Calzetti et al.(2000) andCardelli et al.(1989) laws at low levels of
τV. Also, we observe a large number of cases where
combina-tions of very old stellar populacombina-tions with no dust are unable to reproduce FUV − NUV colours, which also leads to the interpretation that these problems are not due to dust, but to the incompleteness in the stellar population models.
Panels (d) and (e) in Fig 3 show two representative cases of ETGs that require some star-formation in the past 1 Gyr to reproduce their integrated light. In case (d), the younger stellar population is not obscured by dust, and the emission lines in the optical indicate only trace amounts of ionised gas. In case (e), the UV colour is relatively red as the young stellar population is very dust-obscured and more mixed with older components than in the previous case. Con-spicuous emission lines in the optical indicate that the galaxy retains a fair amount of gas. Based on the emission line diag-nostic diagrams (see Fig.8in section4.2), we interpret the source of ionisation in this galaxy to be a mixture of young stars with HOLMES, with a possible contribution from an active galactic nucleus (AGN). A known issue that should be brought up at this point is that the addition of young compo-nents may lead to slightly older mean stellar ages measured in the optical. This happens because the young components required to fit the UV make the optical continuum slightly bluer, leading starlight to invoke slightly older stellar pop-ulations to fit the optical continuum, thus reducing the con-tribution of intermediate ages. One possible solution to this would be to improve our modelling of dust–star geometry. In this work we fit the same dust attenuation for all stel-lar populations, even though young stars are expected to be more attenuated by dust (e.g.Charlot & Fall 2000). Intro-ducing extra dust in the young components would have the same effect in the optical as introducing slightly older stellar populations.
3.4 Changes in physical properties
After looking at some specific cases, let us now turn to a more statistical approach. As a first step in this direc-tion, we look at the distributions of some physical properties measured by starlight with and without UV photometry. These distributions are shown in Fig.4.
Panels (a) and (b) in Fig. 4 show luminosity and mass weighted mean stellar ages, respectively. For fits based purely on SDSS spectra (dashed lines), the distribution of ages is relatively narrow due to two effects: (i) ETGs have very similar optical continuum (see mid panel of Fig. 3), which leads starlight to assign nearly the same stellar population mixture to all of them, and (ii) as mentioned in W19, starlight fits to optical spectra tend to misiden-tify young components at the levels of ∼ 2 per cent of optical light in all ETGs, which also leads to similar mean stellar ages. This second effect is caused by old hot stars disguised as young components, which is discussed byOcvirk(2010) and also byCid Fernandes & Gonz´alez Delgado(2010). In fits that take GALEX data into account (solid lines in Fig. 4), the information on the UV slope gives starlight a tool to distinguish between old and young blue stars, removing the fake young components. Also, with UV data we are able to identify differences between stellar populations older than ∼ 7 Gyr, which are almost indistinguishable from each other in the optical. This gives us a means to differentiate galax-ies that are entirely dominated by the oldest stellar
popula-−1.5 −1.0 −0.5 0.0 (a) Oλ wλ= 0 Mλ Ol 0.0 0.2 0.4 0.6 0.8 1.0 1.2 0 20 40 60 80 hlog ti5635= 10.01 τV= 0.24 −1.5 −1.0 −0.5 0.0 (b) 0.0 0.2 0.4 0.6 0.8 1.0 0 20 40 60 80 100 hlog ti5635= 10.13 τV= 0.00 −1.5 −1.0 −0.5 0.0 log Fλ /F N (c) 0.0 0.2 0.4 0.6 0.8 1.0 1.2 Fλ /F N 0 20 40 60 80 100 FUV Light F raction hlog ti5635= 10.14 τV= 0.15 −1.5 −1.0 −0.5 0.0 (d) 0.0 0.2 0.4 0.6 0.8 1.0 0 20 40 60 hlog ti5635= 10.01 τV = 0.06 3.0 3.2 3.4 3.6 3.8 log λ [˚A] −2.0 −1.5 −1.0 −0.5 0.0 (e) 4000 5000 6000 7000 8000 λ [˚A] 0.0 0.2 0.4 0.6 0.8 1.0 1.2 6 7 8 9 10 log t [yr] 0 10 20 30 hlog ti5635= 9.81 τV= 0.56
Figure 3. Spectral fits to some representative cases in our sample. Each row of panels corresponds to a different galaxy. Panels to the left show the full UV-optical fit in logarithmic scale and middle panels show a zoom into the optical region. The observed optical spectra (Oλ) and UV photometry (Ol) are shown in black. Regions masked out due to the presence of emission lines or sky features are given zero weight (wλ= 0) in the fits and are shown in yellow. The modelled spectra (Mλ) are drawn in blue. Panels on the right show the FUV population vector binned in steps of 0.25 dex in log t, with annotations indicating luminosity-weighted mean stellar ages (at λ= 5635˚A, hlog t i5635) and dust optical depth (τV). Fits represent, from top to bottom: (a) a typical UV-weak ETG, (b) an ETG with an UV upturn that is well reproduced by our models, (c) a UV upturn case that is not well reproduced by our models, (d) an ETG that has undergone star-formation in the past 1 Gyr but that does not present strong line emission, and (e) an ETG with recent star-formation, strong dust absorption, and conspicuous line emission in the optical.
tions (Fig.3b) from others that had more extended periods of star-formation in their early histories (Fig. 3a) and thus slightly younger (or less old) ages. Therefore, this increased sensitivity leads to a broadening of the age distribution.
Metallicities (panels d and e) remain around the
so-lar value when weighted by light and become slightly more metal-rich when mass-weighted. This metal rich population corresponds to galaxies in the upper red sequence to which starlight assigns old metal-rich components that are red-der in NUV − r and bluer in FUV − NUV . For some galaxies,
9.6 9.8 10.0
hlog ti
5635[yr]
0 2 4 6 8N
(a) SDSS Only SDSS+GALEX 9.8 9.9 10.0 10.1hlog ti
M[yr]
0 5 10 15 20N
(b) 0.0 0.2 0.4 0.6 0.8 1.0A
V[mag]
0 1 2 3 4 5N
(c) −0.4 −0.2 0.0 0.2 0.4hlog Z/Z
i
5635 0 1 2 3 4N
(d) −0.4 −0.2 0.0 0.2 0.4hlog Z/Z
i
M 0 1 2 3 4 5N
(e) 9.5 10.0 10.5 11.0 11.5 12.0log M
?/M
0.0 0.2 0.4 0.6 0.8 1.0N
(f)Figure 4. Physical properties measured by starlight with (solid lines) and without (dashed lines) GALEX data for our sample of ETGs. Histograms are normalized to have the same area. Panels show (a) luminosity-weighted mean stellar ages calculated atλ = 5635˚A, (b) mass-weighted mean stellar ages, (c) V -band dust attenuation, (d) luminosity-weighted mean stellar metallicities calculated at λ= 5635˚A, (e) mass-weighted mean stellar metallicities and (d) stellar masses. Mean stellar ages are calculated by assigning to each CSP an age corresponding to the centre of a given time bin.
the addition of UV information increases the V -band dust attenuation (AV, Fig.4c), and for the most part these are
ETGs with young stellar components, which will be the sub-ject of sections 4.2 and 4.3. No change is observed in the stellar mass estimates, which is expected since the bulk of the stellar mass is accounted for by populations that emit most of the optical light.
3.5 Trends with UV colours
Let us now look more directly at which stellar popula-tions contribute to ultraviolet emission as a function of UV colours. To probe this, we reduce the dimensionality of the FUV population vector, introducing the FUV weighted mean stellar ages and metallicities defined as
hlog tiFUV=Õ j xFUVj log tj (1) and hlog ZiFUV =Õ j xFUVj log Zj, (2)
where xFUVj is the fraction of the galaxy’s luminosity in the FUV band that is associated with a stellar population of age tj and metallicity Zj. These quantities allow us to easily
distinguish between sources of UV emission in ETGs. The
definitions above are analogous to starlight’s luminosity-weighted mean stellar ages and metallicities used in a series of previous works (e.g.Cid Fernandes et al. 2005;Mateus et al. 2006;Cid Fernandes et al. 2013), but using the FUV population vector to set the weights, thus measuring the properties of the populations that account for FUV emis-sion. In Fig.5we plot hlog tiFUV (top) and hlog ZiFUV
(bot-tom) against FUV − NUV for our sample, colouring points according to NUV − r. We note that average uncertainties in luminosity-weighted mean stellar ages and metallicities mea-sured by starlight are of 0.10 to 0.15 dex (Cid Fernandes et al. 2014). Typical errors in the colours are 0.15 and 0.3 magnitudes for NUV − r and FUV − NUV , respectively.
Let us now consider the upper panel of Fig.5. On the left of the plot are galaxies with young hlog tiFUV, where UV
emission is mostly due to stellar populations younger than 1 Gyr. These systems have relatively steep UV slopes, as measured by FUV − NUV , and are more common in the lower red sequence (NUV − r . 5.5). More quiescent systems form a sequence on the right, with increasingly older hlog tiFUV as FUV − NUV becomes bluer. This trend arises because larger contributions of post-AGB stars, and thus older stellar populations are required to model galaxies with blue FUV − NUV and red NUV −r. Galaxies in the bottom-right corner of the plot are the ones for which the UV upturn phenomenon is more prominent.
On the lower panel of Fig.5, one can see that the young stellar populations required to fit the UV emission from galaxies in the lower red sequence are also of low
metallic-8.25 8.50 8.75 9.00 9.25 9.50 9.75 10.00
hlog ti
F U V[yr]
−1 0 1 2 3F
U
V
−
N
U
V
−1.5 −1.0 −0.5 0.0 0.5hlog Z/Z
i
F U V −1 0 1 2 3F
U
V
−
N
U
V
5.25 5.50 5.75 6.00 6.25 N U V− rFigure 5. FUV -weighted mean stellar ages (top panel) and metallicities (bottom panel) of ETGs in our sample plotted against FUV − NUV with points colour-coded according to NUV − r . Colour saturates at NUV − r= 6.25
ity. This indicates that chemical enrichment is still ongoing on these systems, either through gas recycling or absorption of less chemically evolved galaxies through mergers. In con-trast, systems with steep UV slopes (traced by FUV − NUV ) in the upper red sequence are the most metal-rich.
4 CLUES ON THE HISTORY OF
EARLY-TYPE GALAXIES
We have shown that the addition of UV data reveals the complexity in the population of red sequence galaxies. This opens up the possibility to explore issues that cannot be tackled with optical data alone. In this section, we will use our synthesis results to explore some open questions in early-type galaxy formation.
5.25 5.50 5.75 6.00 6.25 6.50 6.75
N U V
− r
0 20 40 60 80 100 F raction [%]ETGs with young components UV upturn Other −0.75 −0.50 −0.25 0.00 0.25 0.50 0.75
log W
Hα[˚
A]
0 20 40 60 80 100 F raction [%] 10.0 10.5 11.0 11.5log M
?/M
0 20 40 60 80 100 F raction [%]Figure 6. Fraction of galaxies with young components (blue lines), UV upturn systems (green lines), and other ETGs (red dashed lines) in bins of NUV − r (top), equivalent width of H α (middle) and stellar mass (bottom). Points indicate the centre of each bin. In the middle panel, we plot only galaxies with S/N > 3 in Hα.
4.1 Sub-classes of ETGs according to their UV emission
As previously mentioned, ETGs can be divided into three groups with respect to the stellar populations that con-tribute to their UV emission: (i) ETGs where young stellar populations are required to explain the UV (e.g. Fig.3d and e), (ii) UV upturn galaxies where the very old populations dominate the UV emission (e.g. Fig.3b and c), and (iii) “in-termediate cases” that do not have young components but
are also not completely old as UV upturn galaxies, i.e. their early star-formation histories are more extended (e.g. Fig. 3a). We thus use the following criteria to identify these sub-classes in our sample. (1) We define galaxies as having young components when at least 5 per cent of the FUV emission comes from populations younger than 1 Gyr. We find 610 galaxies satisfying this criterion, corresponding to 17.6 per cent of our sample. (2) UV upturn galaxies are defined as the ones with hlog tiFUV > 9.75, FUV − NUV < 0.9 (this last
criterion is also used by Yi et al. 2011) and no young com-ponents, i.e. galaxies in the bottom right of the top panel of Fig.5. We identify 748 objects (21.6 per cent of our sample) as UV upturn galaxies. (3) Other ETGs, which do not fall in either of the previous categories, make up the remaining 2095 galaxies, 60.6 per cent of our sample.
Our definition of these sub-classes is in reasonable agree-ment with other results/criteria found in the literature. Kaviraj et al. (2007) found contributions of stellar popu-lations younger than 1 Gyr in 30 per cent of their sample, which includes systems with NUV − r< 5 where recent star-formation is more likely. Considering this caveat, our num-bers are in qualitative agreement with those authors. As for the UV upturn sub-class, were we to use theYi et al.(2011) criteria, we would identify 546 objects (16 per cent of the sample) as UV upturn, out of which 396 (53 per cent) also fall into our UV upturn sub-class. We note that we detect young components in 17.5 per cent of the galaxies classified as UV upturn using theYi et al.(2011) criteria.
The fraction of galaxies in each sub-class varies with respect to galaxy properties. To investigate these variations, we looked at the fractions of each of the sub-classes in bins of NUV − r, equivalent width of Hα (WHα) and stellar mass
(M?). Results are shown in Fig.6. The top panel shows the fraction of each of the sub-classes in bins of NUV −r. We find that ETGs with young components make up a significant part of our sample at NUV − r < 5.5, reaching negligible numbers above NUV − r= 6. More precisely, the fraction of galaxies with young components is of 43.3 per cent at 5 < NUV −r< 5.5 and only 9.5 per cent above NUV −r = 5.5. UV upturn systems are very rare in the lower red sequence and become the dominant class in the redder NUV − r bins. As in previous studies (e.g.Dantas et al. 2020) we find that UV upturn galaxies are more common in the upper red sequence; in fact, most galaxies with redder NUV − r bins are of this class.
In the middle panel of Fig.6, we look at results in terms of WHα. We plot all galaxies with S/N > 3 in Hα: 73.3 per
cent of ETGs with young components, 55.6 per cent of UV upturn galaxies and 53.9 per cent of other ETGs satisfy this criterion. We find that systems with young components represent a significant fraction of our sample at the largest WHα values, hinting that these systems have more ionized
gas than the typical ETG. One should note that, even at the largest values of WHα, a significant fraction of ETGs do
not require contributions of young stellar populations to re-produce their UV emission. This should be taken as a word of warning to the use of Hα as an indicator of star-formation in these systems at the SDSS resolution. The sources of ionis-ing photons in these galaxies will be discussed in more detail in the following section. The fraction of UV upturn systems remains almost constant in all bins of WHα, indicating that
the UV upturn has no relation with the gas content of the galaxy.
In the bottom panel of Fig.6we show results in terms of stellar mass. The fraction of ETGs with young compo-nents is larger in the lower log M? bin. In this mass range the young stellar populations are also more prominent, and younger ages can be identified from optical spectroscopy (e.g Caldwell et al. 2003), while at large masses UV information becomes crucial to identify recent events of star formation. To be more specific, the t< 1 Gyr components that we de-tect correspond, on average, to 0.8 per cent of stellar mass at log M?/M < 10.5, 0.27 per cent at log M?/M > 10.5
and ∼ 0.35 per cent overall. The larger incidence of young components at lower masses is consistent with a downsizing effect, as in the low-mass end of the red sequence galaxies are expected to have quenched their star-formation more recently (e.g Gon¸calves et al. 2012; Rowlands et al. 2018). However, it is interesting to note that the downsizing sig-nature is small, and the fraction of these objects remains almost flat for log M?/M > 10. The fraction of UV upturn
galaxies rises steadily towards larger values of log M?, which is in agreement with several works that find the UV up-turn to be more common in high-mass galaxies (e.g.Burstein et al. 1988;Smith et al. 2012;Le Cras et al. 2016b;Dantas et al. 2020).
4.2 The ISM of ETGs with young components We detect signatures of stellar populations younger than 1 Gyr in a significant fraction of galaxies at all stellar masses. A similar result was found bySalvador-Rusi˜nol et al.(2019) at 0.35 6 z 6 0.6. Despite differences in the methodology, the similarity between their results and ours shows that mas-sive galaxies must be undergoing intermittent star-formation event from z ∼ 0.6 to z < 0.1. Several studies also find that cold gas is available in atomic and molecular form in ETGs of all stellar masses (Welch et al. 2010;Young et al. 2014;Castignani et al. 2020). The molecular gas fractions are found to be related to both star-formation histories (Young et al. 2014) and kinematics (Cappellari et al. 2013), in that galaxies with rotating stellar disks have larger gas fractions. Ionised gas can also be detected in the ISM of ETGs of all masses (Herpich et al. 2018). In this section, we will inves-tigate the connection between the presence or absence of young components and the ISM properties of ETGs.
In Fig.7, we plot WHα, AVand the WISE colour W2−W3
against stellar mass for ETGs with (blue lines) and without (red lines) young components. In the top panel of Fig.7, we plot only galaxies with S/N> 3 in Hα, while in the bottom panel we exclude 3 galaxies for which WISE data are not available, all of them with no young components. We have shown in Fig.6that most galaxies in our sample that have log WHα > 0.5 ˚A require t < 1 Gyr stellar populations to explain their UV emission. In the top panel of Fig. 7, we show that these systems have larger WHαregardless of stellar
mass. ETGs with young components also have larger dust attenuation. This can be seen in terms of the V -band dust attenuation derived with starlight (middle panel) and also in the W2 − W3 colour (bottom panel). The WISE W3 band includes the 11.2 and 12.7 µm PAH features. Thus, excess emission in this band (redder W2−W3) indicates the presence of dust. The results in Fig.7are comparable to the ones of
−0.4 −0.2 0.0 0.2 0.4
log
W
H α[˚A]
ETGs with young components Other ETGs 0.1 0.2 0.3 0.4 0.5
A
V[mag]
10.00 10.25 10.50 10.75 11.00 11.25 11.50log M
?/M
0.6 0.8 1.0 1.2 1.4 1.6W
2
−
W
3
Figure 7. Median curves showing stellar mass (log M?) against Hα equivalent width (log W Hα, top) and V -band dust attenua-tion ( AV, middle) and W 2 − W 3 color (bottom). Galaxies with and without young components are plotted in blue and red, re-spectively. Points are plotted in the centre of each log M? with error bars indicating the region between the percentiles of 25 and 75 per cent. In the top panel, we plot only galaxies with S/N > 3 in Hα, while in the bottom panel we exclude 3 galaxies for which there is no WISE data.
Herpich et al. (2018), who find that, at all stellar masses, ETGs with emission lines have larger AVand redder W2−W3
when compared to ETGs without emission lines.
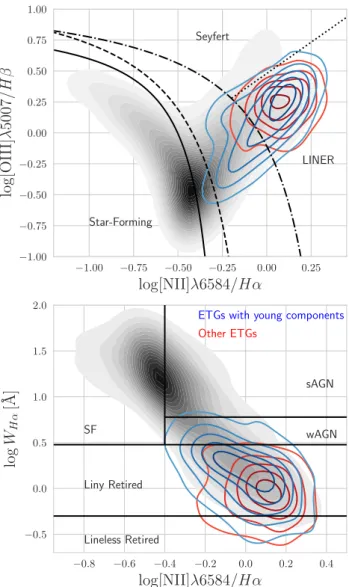
We have shown that ETGs with young components have more ionised gas than other ETGs; however, the source of this ionisation is not clear. In Fig. 8 we plot the dis-tribution of ETGs with young components in the WHAN (Cid Fernandes et al. 2011) and log [N ii]λ6584/Hα versus log [O iii]λ5007/Hβ (named BPT after Baldwin, Phillips & Terlevich 1981) diagrams, comparing them to other ETGs and to the general population of SDSS galaxies. In the BPT diagram, we plot the lines of Stasi´nska et al. (2006, solid line), Kauffmann et al. (2003, dashed line), Kewley et al. (2001, dot-dashed line) and the transposition of theKewley et al. (2006) line proposed by Cid Fernandes et al. (2010, dotted line). We also indicate the galaxy classes usually de-fined using these diagrams. We only include in the diagrams objects that have signal to noise ratios S/N > 3 in the
re-−1.00 −0.75 −0.50 −0.25 0.00 0.25
log[NII]λ6584/Hα
−1.00 −0.75 −0.50 −0.25 0.00 0.25 0.50 0.75 1.00log
[OI
II]
λ
5007
/H
β
Star-Forming Seyfert LINER −0.8 −0.6 −0.4 −0.2 0.0 0.2 0.4log[NII]λ6584/Hα
−0.5 0.0 0.5 1.0 1.5 2.0log
W
H α[˚A]
SF sAGN wAGN Liny Retired Lineless RetiredETGs with young components Other ETGs
Figure 8. BPT (top) and WHAN (bottom) diagrams. ETGs with young components are shown as blue contours, other ETGs are shown in red. Only galaxies with S/N > 3 in the lines used in each diagram are included. Filled contours in shades of gray show the distribution for the general sample DR7 galaxies that fit the same S/N criteria. Contours represent a kernel density estimation with a Gaussian kernel.
quired lines. For the BPT, these are 33.3 per cent of ETGs with young components and 20.4 per cent of the rest of the sample. For the WHAN diagram, 65.3 per cent of ETGs with young components and 47.6 per cent of the rest of the sample satisfy the S/N criterion.
The lines and classes indicated in Fig.8are useful to guide our analysis, but they should not be taken literally, as unresolved diagnostic diagrams tend to overlap multiple sources of ionisation (Sanchez 2019), and the galaxies stud-ied in this paper are especially ambiguous in this regard. Ob-jects above the line ofKewley et al.(2001) are often regarded as ‘pure AGN’; however, this line represents how far objects can go when ionised only by H ii regions. Thus, the inter-pretation is that above this line an object would need some ionisation mechanism other than star formation, although
it does not mean that there is no star formation above this line. To add to the confusion, theKewley et al.(2001) line was based on stellar atmosphere models that overestimated the hardness of the ionising field for H ii regions. An updated version of the enveloping line for H ii region photoionization models was provided byStasi´nska et al.(2006); see also Do-pita et al.(2013).Stasi´nska et al.(2006) estimate that ∼ 70 per cent of the Hα flux at theKewley et al.(2001) line may be due to young stars. Since galaxies studied in this paper are the oldest objects in the local universe, this estimate should be thought of as a conservative upper limit. Classes defined in the WHAN diagram are also misleading in the context of this work. Using integral field spectroscopy from the Calar Alto Legacy Integral Field spectroscopy Area sur-vey (CALIFA, S´anchez et al. 2012), Lacerda et al.(2018) showed that combinations of H ii regions and diffuse ionised gas may result in WHαand [N ii]λ6584/Hα values typical of the AGN region in the WHAN diagram.
Most of ETGs studied in this paper lie in the LINER re-gion of the BPT, but have low Hα equivalent width. Galaxies with these characteristics are classified as ‘retired galaxies’ or ‘fake AGN’ (Stasi´nska et al. 2008) and their dominant ionisation mechanism are HOLMES. For ETGs with young components, contours extend into the intermediate region of the BPT towards the star-forming wing, indicating an increasing contribution of young stars to the ionizing field. However, only one of these objects falls below the line of Stasi´nska et al. (2006), where ionisation can be accounted for solely by star formation. In the WHAN diagram, these contours extend towards larger values of WHα, mostly in
the region labelled as ‘weak AGN’ (wAGN). Thus we inter-pret that, at lower values of [N ii]λ6584/Hα, the ionisation in ETGs with young components likely comes from a mixture of young stars and HOLMES-powered diffuse ionised gas, as found byLacerda et al.(2018). However, some contribution of AGN cannot be dismissed, and could be verified using integral field spectroscopy. As [N ii]λ6584/Hα increases, the contribution of young stars decreases and HOLMES become the main ionising source. Regardless of the presence or ab-sence of young components, 8 per cent of galaxies with BPT classification are above theKewley et al.(2001) line and are also classified as AGN in the WHAN diagram. Thus, we do not see strong evidence for AGN feedback in our sample.
It is interesting to note that, although Herpich et al. (2018) find that ETGs with emission lines have slightly younger ages, they do not invoke young stellar populations as an ionising source. This apparent discrepancy can be eas-ily understood as their work focused only on galaxies with WHα < 3˚A, where HOLMES can solely account for all the
ionizing radiation field. Since the rate of hydrogen ioniz-ing photons in a young stellar population drops significantly after 10 Myr, and pinning down the age of the young stel-lar populations with the required precision is beyond what can be reliably achieved by our spectral synthesis method, we are unable to constrain the contribution young stars to the ionizing field from our synthesis results. Therefore, even in our sample we would not need to consider any ioniza-tion source other than HOLMES, were it not for the fact that many ETGs with young components have WHα values
at the edge or above the threshold for retired galaxies and [N ii]λ6584/Hα lower than expected for typical LINER-like emission. This makes the young + old stars scenario
pro-10.00 10.25 10.50 10.75 11.00 11.25 11.50
log M
?/M
−1.50 −1.25 −1.00 −0.75 −0.50 −0.25 0.00 0.25hlog
Z
/Z
i
METGs with young components Other ETGs
t < 1Gyr stars in ETGs with young components
Figure 9. Median mass-weighted stellar metallicity against stel-lar mass. Red lines correspond to galaxies without young com-ponents. Blue and purple lines both correspond to ETGs with young components. While the blue line is the average metallicity of all stars in the galaxy, the purple line shows the metallicity of stellar populations younger than 1 Gyr. As in other figures, points are plotted in the centre of each stellar mass bin and error-bars represent the interquartile regions.
posed by Lacerda et al. (2018) the most likely one. Also, contributions from other ionizing sources such as AGN, bi-nary stars or shocks cannot be completely ruled out.
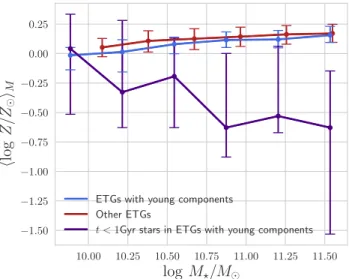
4.3 Where do young components come from? Although we have established that ETGs with young com-ponents have more dust and gas than other ETGs, and that their emission lines are consistent with recent star formation, this doesn’t take us far in explaining how these young com-ponents have formed. Broadly speaking, these recent events of star-formation can be explained either by internal pro-cesses, where stars are formed from gas recycling consistent with a closed box model (e.g.Vazdekis et al. 1997) or by ex-ternal processes such as minor mergers or cold gas accretion from the intergalactic medium. Of course, these are not mu-tually exclusive, and both effects are expected to play a role to some extent. In the first scenario, new stars form from gas that is already chemically enriched, so one expects the recently formed stars to be more metal-rich than the older stars in the galaxy. On the other hand, external processes would give origin to young components that are metal-poor. The absorption of a star-forming companion would add a population of young metal-poor stars to the galaxy and/or provide metal-poor gas from which new stars can form. Since gas in the intergalactic medium is expected to be metal-poor (seevan de Voort & Schaye 2012), stars formed from the ac-cretion of this gas would also be more metal-poor than older stellar populations.
To test these hypotheses, in Fig.9we compare the mass-weighted mean stellar metallicity of the young components (purple lines) to the global (i.e. averaged over all stellar pop-ulations) values for ETGs with (blue) and without (red) young components. We emphasise that the blue and purple
lines correspond to the same galaxies; while the blue line is averaged over all stellar populations, the purple one corre-sponds only to stars that are younger than 1 Gyr.
In terms of the global values (i.e. comparing the blue and red lines), there is very little difference in metallicity between ETGs with young components and the rest of our sample. However, it is clear that the young components are more metal-poor (i.e. comparing the purple to either the blue or red lines), and become more so with increasing stellar mass.
We interpret this as external processes becoming more relevant as stellar mass increases. At low stellar mass, galax-ies have crossed the green valley more recently. In these systems, mass assembly is more gradual, and closed box-like chemical enrichment might be still ongoing. Thus, some newly formed stars are more metal-rich than the older stellar populations. At larger stellar masses, most of the available gas in the ISM has already been turned into stars long ago, so external processes become the most likely (if not the only) path to the formation or accretion of new stars. Therefore, at large masses, it is likely that the young components are the result of rejuvenation (e.g. Pawlik et al. 2018; Chauke et al. 2019) events triggered by minor mergers or cold gas accretion in previously quiescent systems. A merger-driven scenario is consistent with results byKaviraj et al. (2011), who find that ETGs at z ∼ 0.6 showing signs of recent star-formation are more likely to exhibit disturbed morphologies reminiscent of recent minor mergers. Our interpretation is also consistent with the results ofMartin et al.(2017), who find that low-mass galaxies in the green valley are mostly quenching their star formation, while for high-mass galaxies there is a combination of quenching and bursting due to red sequence galaxies that become temporarily bluer after the triggering of star formation.
Additionally, at large stellar masses we should expect our sample to be dominated by slow rotators (seeEmsellem et al. 2011), and it was found byDavis et al.(2011) that cold gas in these systems is misaligned with the stellar compo-nent, indicating the prevalence of external processes. In fast rotators, of typically lower mass, gas tends to be aligned with the stellar component, which is also compatible with the prevalence of internal processes for lower mass systems.
4.4 Environment
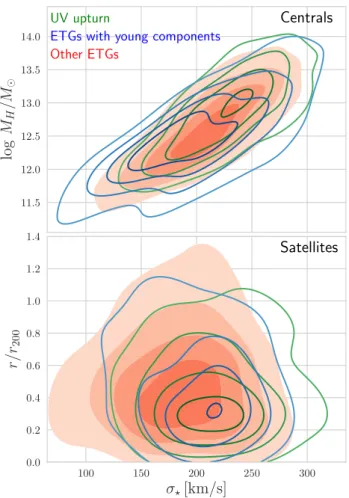
In this section, we investigate differences in environment be-tween the sub-classes defined in section 4.1. To do so, we have matched our sample to theYang et al.(2007) catalogue of galaxy groups. This catalogue is based on the method described by Yang et al. (2005) and contains estimates of dark matter halo masses and classifies galaxies as centrals or satellites.
Out of the 3453 ETGs in our sample, 3355 (97 per cent) are included in the Yang et al.(2007) catalogue. The vast majority of these (72.5 per cent) are central objects, while 27.5 per cent are satellites. There is a small variation in the proportion of centrals and satellites between the sub-classes defined in section 4.1. The fraction of centrals is 65.9 per cent for ETGs with young components, 76.9 per cent for UV upturn systems and 72.6 per cent for other ETGs, implying that galaxies with older stellar populations are more likely to be at the centre of dark matter halos.
11.5 12.0 12.5 13.0 13.5 14.0
log
M
H/M
UV upturnETGs with young components
Other ETGs
Centrals
100 150 200 250 300σ
?[km/s]
0.0 0.2 0.4 0.6 0.8 1.0 1.2 1.4r/r
200Satellites
Figure 10. Top: Stellar velocity dispersion (σ?) against halo mass (log MH) for central galaxies. Bottom:σ?against the pro-jected distance to the luminosity-weighted centre of the dark mat-ter halo (normalised by r200) for satellite galaxies. Blue contours correspond to ETGs with young components, green contours cor-respond to UV upturn galaxies, and filled red contours in the background show the distribution for other ETGs. Contours trace a kernel density estimates calculated using a Gaussian kernel.
In Fig. 10 we plot parameters from the Yang et al. (2007) catalogue for galaxies in our sample. The top panel shows the distribution of halo mass (log MH) against
stel-lar velocity dispersion (σ?) for central, while in the bot-tom panel of we plot σ? against the luminosity-weighted distance to the centre of the dark matter halo, normalised by r200. Contours show kernel density estimates for ETGs
with young components (blue), UV upturn systems (green) and other ETGs (red). For central galaxies (top panel in Fig.10), we see clear differences in log MH between the sub-classes: ETGs with young components are more common in low-mass halos, UV upturn systems are in more massive halos and other ETGs represent an intermediate case. For satellites (bottom panel in Fig.10), the differences in envi-ronment between the sub-classes are unclear.
Comparing the two panels of Fig.10, one notices that ETGs with young components are mostly in the low-σ?end of the distribution for centrals and in the high-σ? end for satellites. One also notices that, at lower masses, central ETGs with young components tend to have slightly larger halo masses than other central galaxies in our sample. This
is consistent with our interpretation of Fig. 9. In low-mass halos, galaxies are more isolated, making external processes less likely. Also, star formation in these systems will be fa-cilitated in higher mass halos, where it is easier to retain gas in the circumgalactic medium. Further away from the halo’s centre, galaxies have to rely on their own dynamical masses in order to fuel star formation. Thus, star formation in satel-lites is restricted to the most massive galaxies, as seen in the middle panel of Fig.10.
UV upturn systems require larger fractions of older stel-lar populations to reproduce their UV emission. Thus, these objects are expected to have assembled their stellar mass over short timescales at an early epoch. Here we show that these systems belong to denser environments than galaxies that assembled their stellar mass more gradually. These re-sults are compatible with the top-down mass assembly sce-nario, where high-mass galaxies assembled their stellar mass earlier (Cimatti et al. 2006).
5 CONCLUSIONS
In this work, we have used state-of-the-art stellar popula-tion models to simultaneously fit SDSS spectra and GALEX photometry of a sample of 3453 early-type galaxies galaxies in the red sequence (NUV − r > 5) at z < 0.1. We use the starlight spectral synthesis code to model the integrated light of the galaxies as a non-parametric combination of stel-lar population spectra. Our main results are the following:
• The distributions of light- and mass-weighted mean stel-lar ages broaden significantly with the addition of UV data. This broadening is observed to a smaller extent in metallic-ity and dust attenuation. The trend is consistent with the fact that the distribution of colours in the red sequence is broader in the UV than in the optical;
• We are able to reproduce the FUV magnitudes within error bars for 80 per cent of UV upturn galaxies selected with theYi et al.(2011) criteria (NUV −r > 5.4, FUV −NUV < 0.9 and FUV − r < 6.6). This suggests that additional ingredi-ents like binaries or EHB stars such as the ones observed by Brown et al. (2000a) in M32 should have a limited contri-bution in the overall population of UV upturn systems;
• As in previous works (e.g.Dantas et al. 2020;Le Cras et al. 2016b), we find that UV upturn galaxies are more massive and have redder NUV − r colours than other ETGs; • In qualitative agreement with previous work (e.g. Kavi-raj et al. 2007), we find that a significant fraction (43.3 per cent) of galaxies with 5 < NUV − r < 5.5 show some contribution of stellar populations younger than 1 Gyr. For NUV − r> 5.5 the fraction drops to 9.5 per cent;
• Regardless of stellar mass, ETGs with young compo-nents have more dust and ionised gas than other ETGs, which is in agreement with Herpich et al. (2018). We in-terpret the source of ionising photons in these systems as a mixture of young stars and HOLMES, while HOLMES account for most of the ionisation in other ETGs.
• The young components that we detect are of low metal-licity, and increasingly so for larger stellar masses. This indi-cates that external processes such as mergers and accretion of cold gas from the intergalactic medium play a larger role in triggering star formation in high-mass galaxies, while in low-mass systems (that are still making their way into the
red sequence) new stars can be formed from gas recycling as if in a closed box model (e.g.Vazdekis et al. 1997);
• When examining galaxies at the centres of dark matter halos, we find that ETGs with young components are more common in low-mass halos, UV upturn systems reside in high-mass halos and other ETGs fall in an intermediate case. For satellites, the differences in environment between these sub-classes are unclear.
The combination of detailed λ-by-λ information from optical spectra and the unique constraints provided by UV data have allowed us to improve upon previous works mod-elling the stellar populations of ETGs. However, modmod-elling of UV–optical emission in these systems is challenging, and the work presented here is subject to some limitations. The stellar population models used in this work are still incom-plete and could benefit from adding additional ingredients such as binaries and EHB stars. Other limitation comes from our treatment of star-dust geometry. We work under the as-sumption that all stars are attenuated by the same dust op-tical depth, when in reality young stars are more strongly af-fected by dust. Better modelling could provide further clues in the recent and early history of ETGs, and thus contribute to our understanding these systems and of galaxy evolution in general.
ACKNOWLEDGEMENTS
We thank the anonymous referee, as well as the scientific editor, for their clear and relevant suggestions. AW thanks Maria Luiza Linhares Dantas and Roderik Overzier for im-portant discussions about this paper. AW acknowledges fi-nancial support from Funda¸c˜ao de Amparo `a Pesquisa do Es-tado de S˜ao Paulo (FAPESP) process number 2019/01768-6. RCF acknowledges financial suport from Conselho Nacional de Desenvolvimento Cient´ıfico e Tecnol´ogico (CNPq) (grant 302270/2018-3) NVA acknowledges support of the Royal So-ciety and the Newton Fund via the award of a Royal SoSo-ciety– Newton Advanced Fellowship (grant NAF\R1\180403), and of Funda¸c˜ao de Amparo `a Pesquisa e Inova¸c˜ao de Santa Catarina (FAPESC) and Conselho Nacional de Desenvolvi-mento Cient´ıfico e Tecnol´ogico (CNPq). PC acknowledges fi-nancial support from Funda¸c˜ao de Amparo `a Pesquisa do Es-tado de S˜ao Paulo (FAPESP) process number 2018/05392-8 and Conselho Nacional de Desenvolvimento Cient´ıfico e Tecnol´ogico (CNPq) process number 310041/2018-0. GB acknowledges financial support from the National Au-tonomous University of M´exico (UNAM) through grant DGAPA/PAPIIT IG100319 and from CONACyT through grant CB2015-252364. RRdC acknowledges financial sup-port from FAPESP through the grant 2014/111564. LSJ ac-knowledges support from Brazilian agencies CNPq (grant 304819/2017-4) and FAPESP (grant 2012/00800-4). Fund-ing for the SDSS and SDSS-II has been provided by the Alfred P. Sloan Foundation, the Participating Institutions, the National Science Foundation, the U.S. Department of Energy, the National Aeronautics and Space Administra-tion, the Japanese Monbukagakusho, the Max Planck Soci-ety, and the Higher Education Funding Council for England. The SDSS Web Site ishttp://www.sdss.org/. The SDSS is managed by the Astrophysical Research Consortium for the Participating Institutions. The Participating Institutions
are the American Museum of Natural History, Astrophys-ical Institute Potsdam, University of Basel, University of Cambridge, Case Western Reserve University, University of Chicago, Drexel University, Fermilab, the Institute for Ad-vanced Study, the Japan Participation Group, Johns Hop-kins University, the Joint Institute for Nuclear Astrophysics, the Kavli Institute for Particle Astrophysics and Cosmol-ogy, the Korean Scientist Group, the Chinese Academy of Sciences (LAMOST), Los Alamos National Laboratory, the Planck-Institute for Astronomy (MPIA), the Max-Planck-Institute for Astrophysics (MPA), New Mexico State University, Ohio State University, University of Pittsburgh, University of Portsmouth, Princeton University, the United States Naval Observatory, and the University of Washing-ton. This project made use of GALEX data and the Bar-bara A. Mikulski Archive for Space Telescopes. This research made use of Astropy,3 a community-developed core Python package for Astronomy (Astropy Collaboration et al. 2013; Price-Whelan et al. 2018).
DATA AVAILABILITY
The data underlying this article will be shared on reasonable request to the corresponding author.
REFERENCES
Abazajian K. N., et al., 2009,ApJS,182, 543
Agius N. K., et al., 2013,MNRAS,431, 1929
Astropy Collaboration et al., 2013,A&A,558, A33
Baldwin J. A., Phillips M. M., Terlevich R., 1981,PASP,93, 5
Bica E., Alloin D., 1987, A&AS,70, 281
Blanton M. R., Roweis S., 2007,AJ,133, 734
Bressan A., Marigo P., Girardi L., Salasnich B., Dal Cero C., Rubele S., Nanni A., 2012,MNRAS,427, 127
Brown T. M., Bowers C. W., Kimble R. A., Ferguson H. C., 2000a,
ApJ,529, L89
Brown T. M., Bowers C. W., Kimble R. A., Sweigart A. V., Fer-guson H. C., 2000b,ApJ,532, 308
Bruzual G., Charlot S., 2003,MNRAS,344, 1000
Burstein D., Bertola F., Buson L. M., Faber S. M., Lauer T. R., 1988,ApJ,328, 440
Caldwell N., Rose J. A., Concannon K. D., 2003,AJ,125, 2891
Calzetti D., Kinney A. L., Storchi-Bergmann T., 1994,ApJ,429, 582
Calzetti D., Armus L., Bohlin R. C., Kinney A. L., Koornneef J., Storchi-Bergmann T., 2000,ApJ,533, 682
Cappellari M., et al., 2011,MNRAS,416, 1680
Cappellari M., et al., 2013,MNRAS,432, 1862
Cardelli J. A., Clayton G. C., Mathis J. S., 1989,ApJ,345, 245
Carleton T., Guo Y., Nayyeri H., Cooper M., Rudnick G., Whitaker K., 2020,MNRAS,491, 2822
Castignani G., Pandey-Pommier M., Hamer S. L., Combes F., Salom´e P., Freundlich J., Jablonka P., 2020, arXiv e-prints,p. arXiv:2004.01786
Chabrier G., 2003,PASP,115, 763
Charlot S., Fall S. M., 2000,ApJ,539, 718
Chauke P., et al., 2019,The Astrophysical Journal, 877, 48 Chen Y., Bressan A., Girardi L., Marigo P., Kong X., Lanza A.,
2015,MNRAS,452, 1068
Cid Fernandes R., 2007, arXiv e-prints,pp astro–ph/0701902
3 http://www.astropy.org
Cid Fernandes R., Gonz´alez Delgado R. M., 2010,MNRAS,403, 780
Cid Fernandes R., Mateus A., Sodr´e L., Stasi´nska G., Gomes J. M., 2005,MNRAS,358, 363
Cid Fernandes R., Stasi´nska G., Schlickmann M. S., Mateus A., Vale Asari N., Schoenell W., Sodr´e L., 2010, MNRAS,403, 1036
Cid Fernandes R., Stasi´nska G., Mateus A., Vale Asari N., 2011,
MNRAS,413, 1687
Cid Fernandes R., et al., 2013,A&A,557, A86
Cid Fernandes R., et al., 2014,A&A,561, A130
Cimatti A., Daddi E., Renzini A., 2006,A&A,453, L29
Code A. D., Welch G. A., 1979,ApJ,228, 95
Conroy C., 2013,ARA&A,51, 393
Dantas M. L. L., Coelho P. R. T., de Souza R. S., Gon¸calves T. S., 2020,MNRAS,492, 2996
Davis T. A., et al., 2011,MNRAS,417, 882
Dawson K. S., et al., 2013,AJ,145, 10
Deharveng J. M., Boselli A., Donas J., 2002,A&A,393, 843
Dopita M. A., Sutherland R. S., Nicholls D. C., Kewley L. J., Vogt F. P. A., 2013,ApJS,208, 10
Dorman B., Rood R. T., O’Connell R. W., 1993,ApJ,419, 596
Eldridge J. J., Stanway E. R., 2012,MNRAS,419, 479
Emsellem E., et al., 2007,MNRAS,379, 401
Emsellem E., et al., 2011,MNRAS,414, 888
Flores-Fajardo N., Morisset C., Stasi´nska G., Binette L., 2011,
MNRAS,415, 2182
Gon¸calves T. S., Martin D. C., Men´endez-Delmestre K., Wyder T. K., Koekemoer A., 2012,ApJ,759, 67
Greggio L., Renzini A., 1990,ApJ,364, 35
Hamann W. R., Gr¨afener G., 2004,A&A,427, 697
Han Z., Podsiadlowski P., Lynas-Gray A. E., 2007,Monthly No-tices of the Royal Astronomical Society, 380, 1098
Hern´andez-P´erez F., Bruzual G., 2014,MNRAS,444, 2571
Herpich F., Stasi´nska G., Mateus A., Vale Asari N., Cid Fernandes R., 2018,MNRAS,481, 1774
Janowiecki S., Catinella B., Cortese L., Saintonge A., Wang J., 2020, arXiv e-prints,p. arXiv:2001.06614
Jeong H., et al., 2009,MNRAS,398, 2028
Kauffmann G., et al., 2003,MNRAS,346, 1055
Kauffmann G., et al., 2007,ApJS,173, 357
Kaviraj S., Devriendt J. E. G., Ferreras I., Yi S. K., 2005, MN-RAS,360, 60
Kaviraj S., et al., 2007,ApJS,173, 619
Kaviraj S., Tan K.-M., Ellis R. S., Silk J., 2011,MNRAS,411, 2148
Kewley L. J., Dopita M. A., Sutherland R. S., Heisler C. A., Trevena J., 2001,ApJ,556, 121
Kewley L. J., Groves B., Kauffmann G., Heckman T., 2006, MN-RAS,372, 961
Knapp G. R., 1999, in Carral P., Cepa J., eds, Astronomical Soci-ety of the Pacific Conference Series Vol. 163, Star Formation in Early Type Galaxies. p. 119 (arXiv:astro-ph/9808266) La Barbera F., Lopes P. A. A., de Carvalho R. R., de La Rosa
I. G., Berlind A. A., 2010,MNRAS,408, 1361
La Barbera F., Pasquali A., Ferreras I., Gallazzi A., de Carvalho R. R., de la Rosa I. G., 2014,MNRAS,445, 1977
Lacerda E. A. D., et al., 2018,MNRAS,474, 3727
Lanz T., Hubeny I., 2003a,ApJS,146, 417
Lanz T., Hubeny I., 2003b,ApJS,147, 225
Lanz T., Hubeny I., 2007,ApJS,169, 83
Larson R. B., 1974,MNRAS,166, 585
Le Cras C., Maraston C., Thomas D., 2016a,IAU Focus Meeting,
29B, 190
Le Cras C., Maraston C., Thomas D., York D. G., 2016b, MN-RAS,461, 766
Leitherer C., Li I.-H., Calzetti D., Heckman T. M., 2002, The Astrophysical Journal Supplement Series, 140, 303