HAL Id: insu-01871360
https://hal-insu.archives-ouvertes.fr/insu-01871360
Submitted on 14 Sep 2018HAL is a multi-disciplinary open access archive for the deposit and dissemination of sci-entific research documents, whether they are pub-lished or not. The documents may come from teaching and research institutions in France or abroad, or from public or private research centers.
L’archive ouverte pluridisciplinaire HAL, est destinée au dépôt et à la diffusion de documents scientifiques de niveau recherche, publiés ou non, émanant des établissements d’enseignement et de recherche français ou étrangers, des laboratoires publics ou privés.
Mechanical Weakening of Massive Quartz Due to
In-Pore Water Tension
Claudie Hulin, Lionel Mercury, Patrick Simon, Kirill Shmulovich
To cite this version:
Claudie Hulin, Lionel Mercury, Patrick Simon, Kirill Shmulovich. Mechanical Weakening of Massive Quartz Due to In-Pore Water Tension. Sixth Biot Conference on Poromechanics, Jul 2017, Paris, France. �10.1061/9780784480779.063�. �insu-01871360�
Mechanical weakening of massive quartz
due to in-pore water tension
Claudie Hulin, M. Sc.1, Lionel Mercury, Prof.1,*, Patrick Simon, Dr. habil.,2 and
Kirill I. Shmulovich, Dr. habil.,3
1Institut des Sciences de la Terre d'Orléans, UMR 7327 Université d'Orléans-CNRS-BRGM, 45071 Orléans Cedex, France ; e-mail: claudie.hulin@cnrs-orleans.fr; lionel.mercury@univ-orleans.fr (corresponding author).
2CNRS, CEMHTI UPR3079 CNRS, Univ. Orléans, 45071 Orléans Cedex 2, France; e-mail:
patrick.simon@cnrs-orleans.fr.
3Institute of Experimental Mineralogy, Russian Academy of Science, 142432 Chernogolovka, Russia; e-mail: kshmulovich@yandex.ru.
ABSTRACT
The present contribution specifically considers the tensile stress exerted by in-pore (or confined) capillary liquids and the role it possibly plays on the host solid mechanics, in absence of significant confining pressure. This situation stands for any unsaturated porous systems submitted to drying-wetting cycles. An original combination of micro-thermometric procedures applied to liquids occluded inside quartz closed cavity, with Raman scattering data collected in the solid quartz lattice, leads to conclude that not only tensile guest liquid can act on its host solid, but can result in solid cracking in subcritical conditions. These processes are of importance for natural or man-made materials present in the Earth’s environment, where water and other active species are present, for which various combination of pore fluid and confining pressure/tension are possible, and displacements and stresses are small.
INTRODUCTION
Mechanical–chemical processes in pores are under growing focus, especially due to the related influence they may have on the porosity-permeability relationship. A very common example of such processes is the crystallization (positive) pressure, the damages (host rock failure) of which are due to guest secondary precipitates crystal growth in pores. This process is activated by salt accumulation in the host rock by rain or sea sprays and regular drying by evaporative demand, until reaching the required saturation to activate nucleation. An overlooked partner in this classic scheme, at least when extrapolating laboratory experiment in the fields, is the common occurrence of capillary processes in drying rocks. This special state of liquids trapped in small enough pores is known to control the physics of sandcastles (e.g., Fraysse et al., 1999), but can also modify the strength of cementitious materials (e.g., Pihlajavaara, 1974; Lagier et al., 2011; Scherer, 2015), or deform cohesive materials (e.g., Tas et al., 2003, 2010).
The present contribution aims to examining how and to what extent an occluded tensile water may create a volumetric stress onto its host rock, and possibly damage it. To do that, synthetic fluid inclusions were fabricated in pure quartz to stand for isolated pores in crystalline and cemented solid materials. The occluded liquid was put under variable high tensions, according to micro-thermometric procedure, and the stress arising all in the crystal hosting the inclusion were monitored using Raman scattering measurements. They showed that the solid lattice remained at subcritical conditions, while the two experiments resulted into quartz failure.
MATERIALS AND METHODS
Principle. Isochoric cooling of liquids trapped in closed cavities put them under tensile strength
up to the stability limits (e.g., Shmulovich et al., 2009; Qiu et al., 2016). In situ Raman spectroscopy can be used to record the temperature/pressure shift upon external strains such as temperature or hydrostatic pressure. The frequency shift of the 464 cm–1 peak of quartz at room temperature (23°C) linearly depends on pressure up to 0.5 GPa: d/dP = 8.7 cm 1/GPa. The frequency shift for the 206 cm–1 mode is d/dP = 20 cm-1/GPa (Schmidt and Ziemann, 2000). These two Raman modes of quartz have been recorded in mapping mode all around an inclusion, submitted to a thermal cycle from room temperature to various values of temperature corresponding to diverse tensile states. The d/dP relationships allowed to translate the frequency shifts into an internal pressure state, corresponding to the isotropic value of the stress tensor.
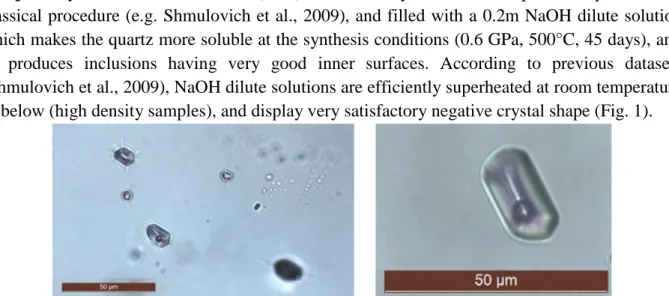
Samples. Synthetic fluid inclusions (SFIs) have been synthetized in a piece of quartz using
classical procedure (e.g. Shmulovich et al., 2009), and filled with a 0.2m NaOH dilute solution which makes the quartz more soluble at the synthesis conditions (0.6 GPa, 500°C, 45 days), and so produces inclusions having very good inner surfaces. According to previous datasets (Shmulovich et al., 2009), NaOH dilute solutions are efficiently superheated at room temperature or below (high density samples), and display very satisfactory negative crystal shape (Fig. 1).
Figure 1. Fluid inclusions-bearing quartz fragments. The left one present a series of pre-fragmented fluid inclusions (Mercury et al., submitted), but the two fragments come from
the same synthesis run, so have similar composition, density, and behavior.
Raman scattering. The spectroscopic measurements on the SFI were performed on a Renishaw
the sample). The grating was a 1800 grooves/mm one, giving a wavenumber step between two adjacent pixels of the CCD equal to 0.97 cm-1. Each measurement was done after a wavenumber calibration procedure of the spectrometer on its internal silicon reference sample (520.5 cm-1), without moving the quartz sample, which ensures the calibration state and promotes the highest possible reproducibility. The microscope (DM2500 Leica) objective was a Leica 100X long front distance (NA=0.85). Mapping measurement were done in the Renishaw StreamlineHR mode; each individual Raman spectrum was obtained with an accumulation time of 8s, a full image consists in 3621 spectra (step of 0.8µm). This mode allows a very efficient confocal filtering, and so it was possible to evaluate how the stress tensor develop either in the same plane than the inclusion itself (the optical one), or all around, specifically some 10 microns above.
Micro-thermometric protocol. The starting pore material generally contains a biphasic
liquid+vapour assemblage (L+V). By a progressive heating, the liquid density and bubble pressure change (A to B path, Fig. 2) up to a particular density, at which the trapped liquid invades the whole inclusion space: there is no more vapour and the inclusion is said to be homogenized (B point, Fig. 2), at the corresponding ‘homogenization temperature’ (TH). Further heating drives the
P-T conditions in the inclusion along the isochore curve inside the stable domain of liquid (B to C path, Fig. 2). The second step is the progressive cooling of the sample, which follows the isochoric path as long as the inclusion remains homogeneously filled with liquid (C to D path without nucleation at B, Fig. 2). The temperature of the bubble appearance is called the (instantaneous) nucleation temperature (TIN) and is always located within the tensile domain: nucleation in fluid
inclusions disobeys the saturation conditions.
This protocol mimics the tension exerted by capillary liquids on host cohesive material in a unsaturated heterometric porous network with capillary menisci at the throat and the superheated (capillary) liquid hosted in the larger pore space (Bouzid et al., 2011).
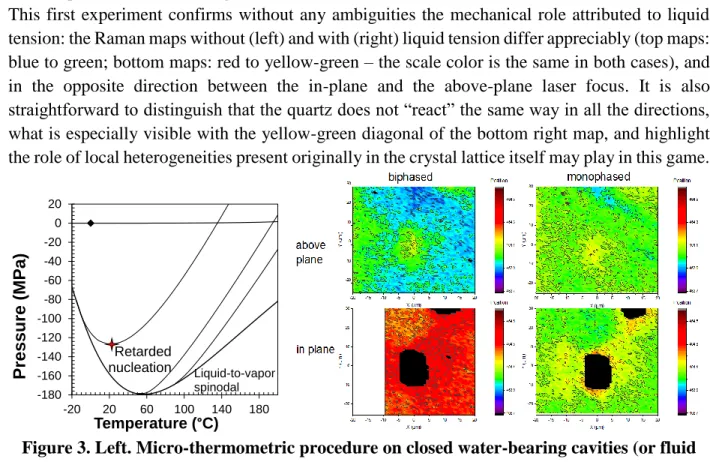
Figure 2. Micro-thermometric procedure on closed water-bearing cavities (or fluid inclusions), to promote liquid tension prone to pull upon the surrounding quartz. It mimics
the role capillary liquid may have on host cohesive material. -40 -30 -20 -10 0 10 20 30 40 50 90 130 170 210 250 290 Press ure (M Pa ) Temperature (°C) 940 900 850 kg/m3 C. Overpressure B. Homogenization D. Instantaneous nucleation A. LV assemblage Superheated water Stable liquid water
RESULTS AND DISCUSSION
Pristine fluid inclusion. This inclusion has TH = 140°C, corresponding to a liquid density
(homogenization means cavity and liquid volumes match together) DH = 926.13 kg/m3, according
to the official equation of state for pure water (hereafter IAPWS-95; Wagner and Pruss, 2002). This inclusion is readily superheated (Fig. 3) by cooling the homogenized inclusion down to room temperature (RT; 21°C), what corresponds in terms of liquid tension to PL = -132.5 MPa. After
overheating to 145°C to ensure the homogenization state (sometimes nano-bubbles keep trapped in invisible corners), Raman maps were put at RT under tensile state of the trapped water. Further cooling provoked bubble cavitation, and moving back to RT made possible to get Raman maps under biphasic stable state (Fig. 3).
This first experiment confirms without any ambiguities the mechanical role attributed to liquid tension: the Raman maps without (left) and with (right) liquid tension differ appreciably (top maps: blue to green; bottom maps: red to yellow-green – the scale color is the same in both cases), and in the opposite direction between the in-plane and the above-plane laser focus. It is also straightforward to distinguish that the quartz does not “react” the same way in all the directions, what is especially visible with the yellow-green diagonal of the bottom right map, and highlight the role of local heterogeneities present originally in the crystal lattice itself may play in this game.
Figure 3. Left. Micro-thermometric procedure on closed water-bearing cavities (or fluid inclusions), to promote liquid tension prone to pull upon the surrounding quartz. Right.
Raman maps of the 464 cm-1 peak position all around the inclusion, in the inclusion plane
(bottom, cavity marked by the black area), and above it (see text).
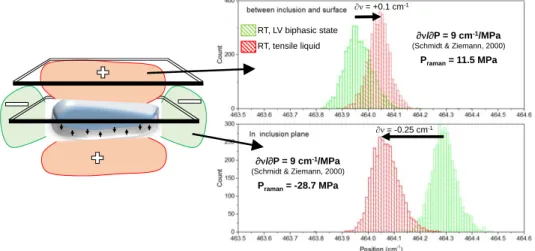
The 3621 spectra of each Raman map were processed with Origin 2016 software to extract the histograms of the main peak position in each configuration (after fitting with a pseudo Voigt profile), turning the Raman shift between the biphasic and monophasic conditions into an additional “Raman pressure”, averaging the stress tensor implied by the liquid tension. The “plane dependency” is put into light, and makes clear that the direct effect of local tension (in-plane quartz
-180 -160 -140 -120 -100 -80 -60 -40 -20 0 20 -20 20 60 100 140 180 Pressure (MPa) Temperature (°C) Liquid-to-vapor spinodal Retarded nucleation
tension) with the compressive relaxation above it and forcibly below it too. Obviously, a solid lattice cannot be put under isotropic tension, but it is also obvious from these results that the quartz reacts differently under compression and tension. The anisotropy of the tension propagation with the in-plane measurements compared to the quite homogeneous stress distribution in the above-plane experiment testify this contrasted behavior. This large difference is interpreted as a clear evidence of the role of the interfacial energy consuming in the tensile situation part of the volumetric energy along the liquid-solid interface all around the cavity (Coussy et al., 2004), compared to the insensitivity of the compressive situation to surfaces effect.
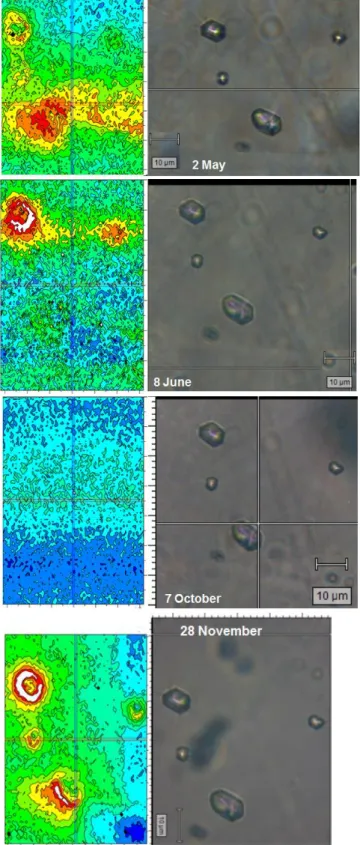
Figure 4. Left. Histograms of the main peak position (Raman shift) according to different thermodynamic conditions in the inclusion (monophasic superheated, biphasic stable). Pre-fragmented fluid inclusions. In a second experiment, a pre-fragmented sample was closely
studied, a work mainly reported in a paper under examination (Mercury et al., submitted) and the corresponding results will not be repeated here. The present contribution reports on a current long-term study about the Raman shifts of quartz around this inclusion maintained under permanent tension at RT (PL = -135 MPa). The idea is to evaluate how the stress anisotropy may lead to
mechanical relaxation, even under sub-critical stress. Practically speaking, the inclusions under study are checked regularly and put again under tension if a bubble becomes visible.
The color scale of the maps (Fig. 5) is exactly similar to the figure 3’s. Focusing on the upper inclusion, with micro-fissures at each apex of the hexagonal structure, it appears that the signal is reddening from May to June, then goes back to zero (constant blue everywhere) in October, and redden again in November. Our present interpretation is that, despite no visible cracking event, the inclusion failed to support tensile strength from liquid and developed micro-fissures around October, before resuming tensile stress at the subsequent tensile loading. Unfortunately, Raman maps were not interpreted when the system was put again under tensile stress, so the demonstration is still speculative and qualitative. Another unclear behavior is the one displayed by the bubble-bearing inclusion (bottom right) which is our non-tensile control. As visible on the top and the bottom map, it shows a blue-to-red shift making clear that stress is accumulating there, despite a no tension exists (visible bubble) inside the cavity. At the time, no clear explanation arises. On this
1 = -0.25 cm-1 = +0.1 cm-1 RT, LV biphasic state RT, tensile liquid /P = 9 cm-1/MPa
(Schmidt & Ziemann, 2000)
Praman= 11.5 MPa
/P = 9 cm-1/MPa
(Schmidt & Ziemann, 2000)
respect, the “June behavior” is simpler to understand, without any Raman signature around the bubble-bearing inclusion. However, this situation may also linked to the further relaxation step, so that no clear reasoning still clarifies this succession.
Figure 5. Raman maps of pre-fragmented inclusions (see the micro-fissures), taken at different times along a six months period under permanent tension.
This dataset appears quite promising, with apparent fatigue effects coming into play into a complex sketch of liquid-to-solid interrelationship. Further data are expected to fill the present uncertainty and afford quantitative conclusions to this current experiment.
CONCLUSION
These findings give interesting insights into the potentially complex strain-stress relationships in natural porous rocks, and the porosity-permeability relationship in drying systems with the possible role of liquid tension in natural water-depleted aquifers. On this respect, the present study with synthetic fluid inclusions demonstrates that cavities in the range of ten of microns or more, may hold pretty high tensions (beyond -100 MPa), which may participate in the geomechanical balance and the resistance to fracture or weakening of brittle polycrystalline rocks submitted to drying conditions.
Further study includes both improvement on the experimental procedure and quantitative comparison between those results and mechanical modeling prediction (finite elements).
Acknowledgement This work has received financial support from the French Agency for
Research (Agence Nationale de la Recherche), through the grant CONGE BLAN-610-01, the Equipex Planex ANR-11-EQPX-36 and the Labex Voltaire ANR-10-LABX-100-01.
REFERENCES
Bouzid M., Mercury L., Lassin, A., and Matray J.-M. (2011b) Salt precipitation and trapped liquid cavitation in micrometric capillary tubes. J. Colloid Interf. Sci. 360, 768-776.
Coussy, O., Dangla P., Lassabatère T., and Baroghel-Bouny V. (2004) The equivalent pore pressure and the swelling and shrinkage of cement-based materials. Materials & Structures 37, 15-20.
Fraysse N., Tomé H., and Petit L. (1999) Humidity effects on the stability of a sandpile. Eur. Phys. J. B 11(4), 615–619.
Lagier F., Jourdain X., De Sa C., Benboudjema F., Colliat J.B. (2011) Numerical strategies for prediction of drying cracks in heterogeneous materials: Comparison upon experimental results. Eng. Struct. 33, 920-931.
Mercury L., Simon P., De Bilbao E., Bergonzi I., Shmulovich K.I. (submitted) Soft fracking of quartz by tensile strength of occluded liquid. Acta Materialia.
Pihlajavaara S.E. (1974) A review of some of the main results of a research on the ageing phenomena of concrete: effect of moisture conditions on strength, shrinkage, and creep of mature concrete. Cement Concrete Res. 4, 761-771.
Qiu C., Krüger Y., Wilke M., Marti D., Rička J., and Frenz M. (2016) Exploration of the phase diagram of liquid water in the low temperature metastable region using synthetic fluid inclusion. Phys. Chem. Chem. Phys. (in press).
Scherer G.W. (2015) Drying, Shrinkage, and Cracking of Cementitious Materials. Transp. Porous Media 110(2), 311–331.
Schmidt C. and Ziemann M.A. (2000) In-situ Raman spectroscopy of quartz: A pressure sensor for hydrothermal diamond-anvil cell experiments at elevated temperatures. Am. Mineral., 85, 1725–1734.
Shmulovich, K. Mercury L., Thiéry R., Ramboz C., and El Mekki M. (2009) Experimental superheating of water and aqueous solutions. Geochim. Cosmochim. Acta, 73(9), 2457– 2470.
Tas N.R., Escalante M., van Honschoten J.W., Jansen H.V., and Elwenspoek M. (2010) Capillary Negative Pressure Measured by Nanochannel Collapse. Langmuir 26(3), 1473–1476. Tas N.R., Mela P., Kramer T., Berenschot J.W., and van den Berg A. (2003) Capillarity induced