Designing a Low Activation Pressure Drip Irrigation
Emitter With Constraints for Mass Manufacturing
The MIT Faculty has made this article openly available.
Please share
how this access benefits you. Your story matters.
Citation
Shamshery, Pulkit, and Amos G. Winter. “Designing a Low Activation
Pressure Drip Irrigation Emitter With Constraints for Mass
Manufacturing.” Volume 4: 21st Design for Manufacturing and the
Life Cycle Conference; 10th International Conference on Micro- and
Nanosystems (August 21, 2016).
As Published
http://dx.doi.org/10.1115/DETC2016-60078
Publisher
ASME International
Version
Final published version
Citable link
http://hdl.handle.net/1721.1/120772
Terms of Use
Article is made available in accordance with the publisher's
policy and may be subject to US copyright law. Please refer to the
publisher's site for terms of use.
Designing a low activation pressure drip irrigation emitter with constraints for
mass manufacturing
Pulkit Shamshery
Global Engineering and Research Laboratory Massachusetts Institute of Technology
Cambridge, MA, USA Email: ps544@mit.edu
Amos G. Winter, V.
Global Engineering and Research Laboratory Massachusetts Institute of Technology
Cambridge, MA, USA Email: awinter@mit.edu
ABSTRACT
This work discusses the modeling and optimization of a drip irrigation emitter for reducing activation pressure. Our model formulation focuses on analytically characterizing fluid-structure interactions in an existing 8 liters per hour (lph) pressure-compensating online emitter. A preliminary experimental validation of the resulting model was performed for three different emitter architectures. This model was used as a basis for a genetic algorithm-based optimization algorithm that focused on minimizing activation pressure. The design variables considered in our formulation include, geometric features of the emitter architecture, and practical constraints from manufacturing. We applied our optimization approach to four emitters (with flow rates of 4, 6, 7 and 8.2 lph) and were able to lower activation pressure by more than half in each case. The optimization results for all four emitters were experimentally validated in lab-studies. We performed a more exhaustive validation study for the 8.2 lph emitter with an emitter manufacturer. Results from these experiments (which followed ISO standards) showed that the optimized 8.2 lph emitter had a 75% lower activation pressure when compared to the original emitter design.
1. INTRODUCTION
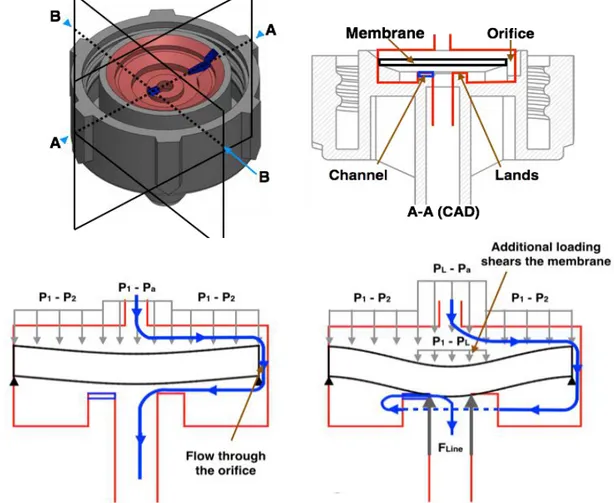
The objective of this study is to analyze coupled fluid- structure interaction in a commercially manufactured 8 liters/hour (lph) online pressure compensating (PC) drip emitter and optimize it for lowering activation pressure. Figure 1 shows the architecture of the PC emitter, key parameters and flow paths at varying inlet pressures.
Here, the term pressure compensating (PC) refers to emitters that keep the flow rate constant despite variations in inlet pressure. PC behavior is advantageous as it results in a uniform distribution of water throughout a field. Activation pressure is the minimum compensating inlet pressure (MCIP) required to induce constant flow. The primary motivation for this study is that drip irrigation, compared to rain fed and flood irrigation, can increase yields by 20- 90% depending on crop type, save water consumption per acre by 30- 70%, reduce fertilizer usage per acre by up to 40% and grow water sensitive cash crops such as floriculture and horticulture crops [1,2,3,4]. Such advancements in irrigation are essential to alleviate farmer poverty and increase worldwide food and water security. Drip irrigation has been shown to be a means to achieve farmer prosperity [5,6], but the high initial cost of a drip system, (particularly in off-grid settings) prevents the widespread dissemination of drip technology in the developing world. Proceedings of the ASME 2016 International Design Engineering Technical Conferences and
Computers and Information in Engineering Conference IDETC/CIE 2016 August 21-24, 2016, Charlotte, North Carolina
We performed a preliminary cost analysis on the drip system that revealed ~70% of total cost for an off-grid system consists of pumping- and powering-related systems. Therefore, lowering the power requirement of the system can lead to a significant reduction in the initial and recurring costs of an off-grid drip irrigation system. Additionally, the pumping power for a drip system is dependent on the flow rate through the system and the pressure head required. For a surface source, the activation pressure of the emitter accounts for 50% of the pressure required to pump the water through the system. Hence, an order of magnitude reduction in activation pressure will reduce the pressure requirement of the system by ~45% and the cost by up to 40%. In India 39% of farmers use flood irrigation to irrigate their land, if drip irrigation can be made economically accessible to developing world farmers and convert these farmers to drip irrigation there can be huge water savings per yield from a life cycle of food production point of view.
The design and the working principle of a common online emitter is summarized in Figure 1. Fluid flows into the emitter through the inlet at a pressure 𝑃!. The fluid then flows into the
chamber under the membrane through an orifice. The flow through the orifice leads to a pressure loss and the pressure in the chamber is at 𝑃!. Finally, the fluid flows out of the emitter to the atmosphere at pressure 𝑃!. Therefore, the described flow of the fluid creates a pressure differential across the membrane. As the inlet pressure increases, the compliant membrane deflects down to the lands and then further shears into the channel. The overall deflection increases with inlet pressure, resulting in more resistance to the flow of the fluid. This flow restriction behavior is pictorially seen in Figure 1.
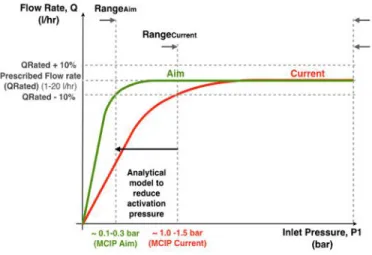
Figure 2 shows a plot of the variation in flow rate against inlet pressure to characterize the performance of a PC emitter. The red line represents the performance of a currently manufactured emitter design and the green line shows the performance of a realistically ideal PC emitter. Our goal is to optimize the design of the existing PC emitter such that its performance is as close as possible to the aimed performance.
Our work builds on the fluid-structure interaction models presented by Taylor et al. [7] and couples it with a genetic algorithms-based optimization approach. The optimization formulation is setup to vary key geometric dimensions in the
Figure 1. Schematic of a conventional PC online emitter. Top Left–Isometric view of the emitter. Top Right–View along the A-A plane. Bottom Left–Flow path of water in the emitter for low inlet pressures. When the inlet pressure is low, fluid flow path isn’t constrained and water can flow into
the inlet and out the outlet via an orifice. Bottom Right–Flow path of water in the emitter for high inlet pressures. Once the inlet pressure is high enough such that the membrane contacts the lands, fluid has to divert around the lands and flow through the channel and out through the outlet.
current emitter in order discover the design that has the lowest activation pressure for a given flow rate. The next sections discuss the problem formulation for the genetics algorithms-based optimization approach.
Figure 2. Performance metric of a PC emitter. The red line shows
the performance of a current emitter. The green line shows the aimed performance. The vertical dashed lines represent activation pressure.
2. OPTIMIZATION PROBLEM DEFINITION
The overall objective of this study is to reduce the activation pressure of an 8 lph online PC emitter. The set of design variables considered are:
• membrane radius (𝑟!) • membrane thickness (t) • channel width (𝑊) • channel length (𝐿!!) • channel depth (𝐷!!) • land height (𝐻!), t • orifice size (𝐴!"#$#%&) • outlet diameter (𝐷!)
The fluid-structure interaction is modeled as a function whose inputs are the described set of design variables and the output is the emitter performance. Here, the emitter performance is characterized using the goodness-of-fit of the inlet pressure vs. flow rate graph of the emitter to the aimed performance (see Figure 2). While the flow rate versus pressure graph for an ideal emitter is a horizontal line at the required flow rate, the aimed graph (shown in green in Figure 2) is set as a realistic target for the optimization problem due to practical considerations resulting from the orifice loss coefficient (κorifice). Therefore, the objective of the optimization problem
amounts to determining the set of design inputs that minimize the deviation between the inlet pressure vs. flow rate performance of the designed emitter and the aimed performance. The mathematical representation of this objective is shown in Equation 1. The deviation between the curves (cost function) is measured as the Euclidean distance between the vector of corresponding graph points between the designed and the aimed performance.
𝑚𝑖𝑛 𝑞!!"#$%− 𝑞!!"#$%& !
!!!
[1]
Here,
𝑛 = total discretization of inlet pressure
𝑞!!"#$% = aimed flow rate at 𝑖!! pressure discretization 𝑞!!"#$%& = design flow rate at 𝑖!! pressure discretization A genetic algorithm (GA)-based heuristic optimization method was used to minimize the objective function given in Equation 1. A GA-based approach was preferred over other optimization techniques because the objective function is non-continuous and contains non-linear constraints. Additionally, GA’s are well suited for handling integer constraints. This is necessary in order to take into account the dimensional tolerances while injection molding the emitter.
The constraints enforced are due to manufacturing and procurement constraints are detailed in Equations 2-9. The manufacturing constraint results from the requirement that currently used injection-molding machines should be able to be cost-effectively retrofitted to manufacture the new emitters. This enforces the following dimensional constraints:
1.2 ≤ 𝑚𝑒𝑚𝑏𝑟𝑎𝑛𝑒 𝑡ℎ𝑖𝑐𝑘𝑛𝑒𝑠𝑠 (𝑚𝑚) ≤ 1.4 [2] 𝑚𝑒𝑚𝑏𝑟𝑎𝑛𝑒 𝑑𝑖𝑎𝑚𝑒𝑡𝑒𝑟 𝑚𝑚 = 11 [3] 𝐿𝑎𝑛𝑑 𝐻𝑒𝑖𝑔ℎ𝑡 𝑚𝑚 ≤ 1 [4] 0.05 ≤ 𝑐ℎ𝑎𝑛𝑛𝑒𝑙 𝑑𝑒𝑝𝑡ℎ 𝑚𝑚 ≤ 1 [5] 0.5 ≤ 𝑐ℎ𝑎𝑛𝑛𝑒𝑙 𝑤𝑖𝑑𝑡ℎ 𝑚𝑚 ≤ 2 [6] 0.5 ≤ 𝑐ℎ𝑎𝑛𝑛𝑒𝑙 𝑙𝑒𝑛𝑔𝑡ℎ 𝑚𝑚 ≤ 2 [7] 𝑌𝑜𝑢𝑛𝑔!𝑠 𝑀𝑜𝑑𝑢𝑙𝑢𝑠 = 0.038 𝐺𝑃𝐴; 𝑆ℎ𝑒𝑎𝑟 𝑀𝑜𝑑𝑢𝑙𝑢𝑠 = 0.60 𝑀𝑃𝐴; 𝑃𝑜𝑖𝑠𝑠𝑜𝑛 𝑅𝑎𝑡𝑖𝑜 = 0.48; 𝑀𝑒𝑚𝑏𝑟𝑎𝑛𝑒 𝑀𝑎𝑡𝑒𝑟𝑖𝑎𝑙 = 𝑠𝑖𝑙𝑖𝑐𝑜𝑛𝑒 [8] 0.5 ≤ 𝑎𝑟𝑒𝑎 𝑜𝑓 𝑜𝑟𝑖𝑓𝑖𝑐𝑒 (𝑚𝑚!) ≤ 2 [9]
The GA optimization toolbox in MATLAB® was used for the optimization process. Values for population size, mutation rate, and crossover rate were iteratively tuned for obtaining the optimal emitter design.
If the new designs can achieve the design requirements of lowering the activation pressure for a family of flow rate emitters, they will lead to a reduction in power requirement for a surface water source by 45%. As these emitters will be a direct replacement for already manufactured emitters, from a qualitative life cycle analysis, there is no change in component level life cycle, but the new designs will consume less energy during operation over its lifetime. Also it will make drip irrigation economically accessible to smallholder farmers hence reducing a water footprint for food production. A detailed study needs to be performed to quantify the benefits.
3. MODEL FORMULATION
In this section, we describe the formulation of an analytical model for fluid-structure interaction (FSI) that characterizes emitter performance with regards to the set of input design variables. The FSI model consists of two-sub models: (1) the structural model that computes orifice deformation, and (2) the fluid flow model that computes flow rate. In this study, the FSI model is used to develop a segregated solver that solves the structural and fluid domains separately. Results from these two domains are then coupled through fixed-point iteration. Our GA-based optimization algorithm encodes all the above models into modular solvers. These modules are discussed below: 3.1 The Fluid- Structure Interaction Module
This module builds on the work by Taylor et al. [7] and takes in the set of design variables and constraints as inputs and outputs the variation of inlet pressure with flow rate. To the authors’ knowledge, there is no other existing study that analytically describes the principal operating phenomenon of a drip emitter and then utilizes the model to design lower activation pressure PC emitters.
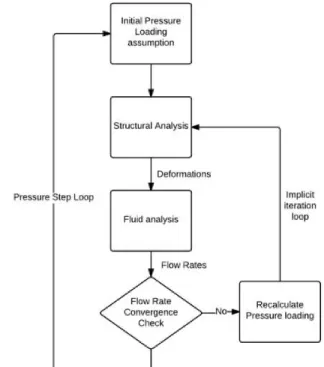
The analysis of an emitter involves coupled fluid- structure interactions (FSI). The membrane deflection is dependent on the pressure loading which is a function of fluid flow, which in turn is dependent on the deflection of the membrane. As discussed, a segregated FSI solver was used so the solid and fluid domains can be solved separately and then coupled through fixed-point iteration. This allows information transfer from the structure to the fluid module and vice versa. Figure 4 depicts this iterative process in the form of a flow chart. The output of the iterative process is a flow rate versus inlet pressure graph. Please note that this graph can be produced for different design variables.
For every inlet pressure 𝑃!, an initial loading of 𝑃!= 𝑃! was assumed. Membrane deflection and flow rate 𝑄were calculated based on this assumption. These values, were used to recalculate 𝑃! based on Equation 10.
𝑃!= 𝑃!− 1 2𝜌 𝑄 A!"#$#%& ! 𝜅!"#$#%& [10]
Here, κorifice = 0.95 is the experimentally measured loss
coefficient for the orifice in an 8 lph commercial emitter and Aorifice is the orifice area. The recalculated 𝑃! is used to update the deflection and the flow rate. This iterative process is repeated until the flow rate from the previous iteration and the new flow rate converge to within 1%. A convergence threshold of 1% was set based on the observed computational time for the overall algorithm. This iterative process is repeated for each value of inlet pressure to build up the entire flow rate versus pressure curve as shown in Figure 2.
Figure 3. Flow charts that describes the iterative process used to solve the segregarted FSI solver.
3.2 Structure Module
In this module, plate deformation is computed by dividing it into two regimes (as seen in Figure 1). The first regime models unrestricted deformation until the lands. The second regime models contact with the lands and the deformation in shear into the channel.
Unrestricted deformation is modeled using Kirchhoff Love plate theory by considering the orifice as a simply supported thin circular membrane. The loading is seen in Figure 1 and the deflection can be determined by superimposing the deflection due to uniform loading 𝑃!− 𝑃! and the deflection due to an annular loading of 𝑃!− 𝑃!. The exact solutions for these loadings are known and given in the handbook by Roark [8]. Based on the equations, deflection of the circular plate with uniform loading is calculated as shown in Equation 11.
𝑤!"#$%&'= (𝑃!− 𝑃!) 𝑟! ! 64𝐷 1 − 𝑟 𝑟! ! 5 + 𝜈 1 + 𝜈− 𝑟 𝑟! ! [11]
Equations 12 and 13 give deflection of the circular plate with annular loading.
𝑤!""#$!%= −(𝑃!− 𝑃!)𝑟! ! 2𝐷 𝐿!" 1 + 𝜈− 2𝐿!! +(𝑃!− 𝑃!)𝑟! !𝐿!" 𝑟! 2𝐷 1 + 𝜈 − (𝑃!− 𝑃!)𝑟!𝐺!! 𝐷 [12] and, 𝐷 = 𝐸𝑡 ! 12 1 − 𝜈! [13]
Here, 𝐷 is the flexural stiffness of the compliant membrane, 𝐸 is the Young’s modulus, 𝑡 is the thickness, and 𝑣 is the poisson ratio. 𝑟! is the membrane radius, 𝑟 is the spatial position in the radial direction, and 𝑟!is the radial position of the start of the annular loading. 𝐺!! is a function of 𝑟 and 𝑟!, 𝑌!, is the center of deflection and 𝑀!, is the center moment. 𝐿!!, and 𝐿!" are loading constants. These values can be found in Roark’s handbook [8].
Equation 14 gives the total deflection for the plate. 𝑤!"#$%#&= 𝑤!"#$%&'+ 𝑤!""#$!% [14] Equations [11–14 are valid for small deflections; i.e. when the maximum deflection is less than the membrane thickness. If the deflection exceeds the thickness of the membrane, it is necessary to use a correction factor to account for plate stiffening. The correction factor used was derived by Timoshenko and is presented in his book [9].
Once the membrane deflects up to the lands, an opposing circular line force is induced. This line force is due to the contact between the membrane and the inner diameter of the lands. The pressure required to deflect up to the lands is 𝑃!.
The additional pressure loading, 𝑃!− 𝑃!, causes the membrane to deflect in shear into the channel. Assuming only a small section of the membrane shears, the deflection can be approximated by the Hyperbolic Shear Deformation Theory [10] to give Equations 15 and 16.
𝑤!!!"# = 3 5 (𝑃!− 𝑃!)𝑊! 𝐺𝐴! 𝑥 𝑊− 𝑥! 𝑊! − 2 𝜆𝑊 ! 1 − 𝑐𝑜𝑠ℎ 𝜆𝑥 − 𝜆 𝑊2 𝑐𝑜𝑠ℎ 𝜆𝑊2 [15] and, 𝜆!=𝛽 𝛼 ; 𝛼 = 𝐵! 𝐴!− 𝐴! ; 𝛽 = 𝐺𝐴!𝐶! 𝐸𝐼𝐴! [16]
Here, 𝐺 is the shear modulus of the membrane, 𝐴! is the cross-sectional area of the beam, 𝑊 is the length of beam or width of the channel, and 𝑥 is the spatial position. Constants 𝐴!, 𝐵! and 𝐶! appear in the coupled Euler-Lagrange governing differential equations of a thick beam deforming in bending and shear. The output of the structure module is the total deformation of the membrane along the fluid flow path given by Equation 17.
𝑤!"!#$= 𝑤!"#$%#&+ 𝑤!!!"# [17]
3.3 Fluid Flow Module
This module computes flow rate of the fluid by dividing it into the same two regimes given in the structure module. During unrestricted membrane deflection a majority of pressure
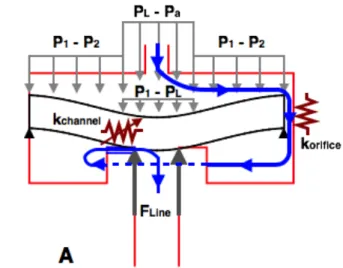
loss is via fluid flow through the orifice. As pressure increases and the membrane shears into the channel, an additional pressure loss due to fluid flow through the channel is added (see Figure 4).
Figure 4: Fluid flow modeling within a PC emitter. Loss
coefficient under low inlet loading is mainly due to orifice, κorifice.
As the pressure loading increases, a variable resistance κchannel,
is added. The pressure drop due to the orifice is calculated as given by Equation 18. 𝛥𝑃!"#$#%& = 𝑃!− 𝑃!=1 2𝜌 𝑄 A!"#$#%& ! 𝜅!"#$#%& [18] Here, κorifice = 0.95 which is the experimentally measured loss
coefficient for the orifice in an 8 lph commercial emitter. The pressure drop through the channel can be modeled using the Darcy-Weishbach equation [11,12] given in Equations 19,20.
Δ𝑃!!!""#$= 𝑃!− 𝑃!=12 𝜌𝑄 ! 𝐴!!!""#$!( 𝜅!"#$%+ 𝑓𝐿 𝐷!+ 𝜅!"#$%#) [19] where, D! =!!!!!""#$
!"#$%"&"# is the equivalent hydraulic radius [20] and 𝐴!!!""#$ is the area of channel, 𝑓 is the friction factor, 𝑄 is the flow rate, 𝐿 is the effective length of channel (channel covered by the membrane), and κinlet and κoutlet are minor inlet
and outlet loss coefficients whose values can be found in Kays and London [13]. The Colebrook equation is iteratively solved to obtain the friction factor 𝑓 as given in Equations 21–22. For 𝑅𝑒 < 2300 𝑓 = N Re [21] For 𝑅𝑒 > 2300 1 𝑓= −2 log!"( 𝜖 3.7𝐷!+ 2.51 𝑅𝑒 𝑓) [22]
Here, 𝑁 is dependent on the cross-sectional aspect ratio and 𝜖 is the roughness of the flow path and the flow is usually in the turbulent regime. The total pressure loss is the summation of pressure loss in the orifice and the channel as shown in Equation 23.
Δ𝑃!"!#$= 𝑃!− 𝑃!= Δ𝑃!"#$#%&+ Δ𝑃!!!""#$ [23]
Equations 18–23 can be rearranged to calculated flow rate, 𝑄, which is the output of the fluid flow module. As previously discussed, the FSI module takes the deformation from the structural module and flow rate from the fluid flow module and iterates until the new flow rate and the flow rate from the previous iteration has converged to within 1%, based on computational time.
4. EXPERIMENTAL MODEL VALIDATION 4.1 Experimental setup
Figure 5 shows the experimental setup used to test emitters with varying dimensions of the design variables in order to validate the predictions from the model. The setup consists of a air-pressurized tank that provides water at a prescribed inlet pressure, which can be read off the pressure gauge. The pressure-regulating valve enables the control over the prescribed pressure. This setup allows for two emitters to be tested simultaneously and the emitters flow into a 250 ml graduated cylinder, which enables the flow rate to be timed. 4.2 Experimental methodology
The performance metric of emitters is the flow rate versus inlet pressure graph. Hence, the experimental setup should be capable of reproducing the pressure versus flow rate graph for every emitter being tested. For this, we tested two emitters of each type. The test starts an initial pressure of 0.2 bar which is set using a pressure regulating valve. At each subsequent pressure, the time taken to fill up a 250 ml graduated cylinder is recorded and the flow rate derived. The average flow rate of both emitters is plotted. The test is repeated at increasing pressures intervals of 0.1bar up to a maximum pressure of 1.6 bar. We also repeated the tests with decreasing pressures. 4.3 Comparison of experiment and model results
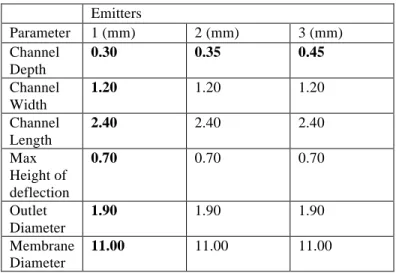
In order to validate the model, three emitters with different dimensional configurations were precision machined out of Delrin using a CNC milling machine. Table 1 shows the dimensions of the three emitters. Emitter 1 serves as the control. Emitter 2 and 3 vary in channel depth. The bold values denote the changes made to the emitters with respect to the control. The emitters and the tests were setup for a preliminary validation of our model. A complete validation will be performed in the future using a full factorial design of experiment with the 6 factors (stated in Table 1) having 2-3 levels each.
Figure 5. The experimental setup. It consists of a pressured tank and
a pressure-regulating valve which also water to flow at a prescribed pressure. The pipe and emitter try to emulate field piping network conditions. The graduated cylinders are used to determine the flow rate. Two of the same emitter are tested at a time.
Table 1. Shows the dimensions of the emitters used to validate the model. Emitters Parameter 1 (mm) 2 (mm) 3 (mm) Channel Depth 0.30 0.35 0.45 Channel Width 1.20 1.20 1.20 Channel Length 2.40 2.40 2.40 Max Height of deflection 0.70 0.70 0.70 Outlet Diameter 1.90 1.90 1.90 Membrane Diameter 11.00 11.00 11.00
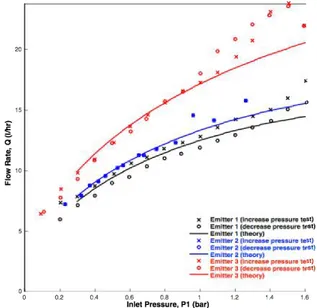
The flow rate versus pressure graph for each emitter is shown by three lines, the cross marker represents the experimental value obtained for the CNC milled emitter under increasing pressure loading, the circle marker is under decreasing pressure and the solid line is the model prediction. Figure 6 shows the close relationship between the experimental results and model predictions. Emitters 1, 2 and 3 have an 𝑅! value of 0.94, 0.96, and 0.91 respectively. These values indicate that results from the experiment were significant enough to validate the model. The trends seen are that an increase in channel depth led to an increase in flow rate.
5. RESULTS OF GA-BASED OPTIMIZATION
The experimentally validated FSI model can be used to compute the flow rate versus inlet pressure curve for a particular geometry based on variables in emitter geometry such as, channel depth, width, length, the outlet diameter, the
maximum height of deflection, the size of the orifice and the diameter and thickness of the compliant membrane. This model
for a given architecture of the emitter within a ±5% error bound. This models was used to conduct a hybrid genetic algorithm (GA)-based [14] optimization study. Hybrid GA’s combine the power of a GA with human intuition for decision-
Figure 6. Results for flow rate versus inlet pressure with variation in channel depth for increasing and decreasing pressures.
making. The GA portion excels at narrowing the design space towards a global minimum but tends to slow down as it approaches the minimum. At this stage, human intuition is used to refine the search. The following final parameters were set based on prior experiments to conduct the optimization study using the GA-optimization toolbox in MATLAB®.
• Population size = 500 genes • Mutation rate = 0.03 • Crossover rate = 0.8 • Maximum generation = 20
• Stopping conditions was set as follows: The deviation between the graphs (aimed versus design) is less than 5% OR the algorithm runs for 20 generations.
Once the iterations came to a stop, human intuition was used used to achieve a better fit.
The described procedure was followed to optimize an emitter of 8.2 lph. The result of this process is a set of optimal values for the set of input design variables described in Section 2. Please note that we are unable to share the obtained numerical values due to intellectual property agreements with the project sponsor. Therefore, in this paper, we present the results from a validation study conducted in conjunction with the project sponsor to characterize our optimal design. For this, we manufactured a Delrin emitter based on the optimal design for the 8 lph emitter. This emitter was experimentally tested using the procedure described in Section 4. Results from this experiment are shown in Figure 7. These results indicate that the optimized design had an activation pressure of 0.15 bars. This is significantly lower than the activation pressure for the
original emitter design of 1 bar. We also conducted experimental studies on optimal designs for emitters with flow rates of 4,6, and 7 lph obtained from the hybrid GA-based approach. As shown in Figure 7, we observed an activation pressure of pressure of 0.2 bar or lower for all of these models. These results helped us confirm that applicability of our optimization approach across emitter architectures with varying flow rates.
Figure 7. Flow rate versus inlet pressure for emitters that were optimized using a hybrid GA and the model presented in this study. The all have an activation pressure of 0.2 bar and lower.
To independently confirm the lab-results for the 8.2 lph emitter, the project sponsor manufactured 50 HDPE emitters at their industrial facility. These emitters could be injection molded without signifcant added costs as a result of the manufacturing constraints set in our optimization model The tests conducted conformed to ISO guidelines for testing PC emitters. . Figure 8 shows how the performance of the optimized 8.2 lph emitters (labelled MIT) when compared to other current emitters. The optimized emitter has an activation pressure of 0.15 bar. This value is close to 22% of the activation pressure measured in other commercial designs.
Figure 8. Flow rate versus inlet pressure for optimized emitter (MIT) when compared to commercially available 8.2 lph emitters.
The optimized emitter (MIT) is depicted in red and has an activation pressure that is 4 times lower than that of Netafim and 6 times lowers than Toro and Jain.
6. DISCUSSIONS & FUTURE WORK
This paper describes an optimization problem whose objective is to reduce the activation pressure of PC online emitters by changing the dimensions of the channel depth, width, length, the outlet diameter, the maximum height of deflection, the size of the orifice and the diameter and thickness of the compliant membrane while having manufacturing and practical constraints placed. While the optimization is focused on the 8.2 lph emitter, we also tested our approach across emitter designs for 4, 6 and 7 lph. The architecture of the newly optimized emitter is very similar to the currently manufactured drippers making them easy to manufacture using existing techniques. The significant difference in the optimized design is that the dimensions of geometric features have been tuned to achieve a lower activation pressure. These emitters were manufactured in-lab and preliminary tests showed that the activation pressure was 0.2 bar and lower. The new 8.2 lph architecture was also tested by the project sponsor conforming to ISO guidelines. Results show that the optimized emitter has a 75% and greater reduction in activation pressure compared to other commerical designs.
The results helped in preliminary validation of the proposed FSI model and the hybrid GA-based optimization approach. We observed that our model is capable of predicting the performance curve of the described emitters within a ±5% error bound. Future work will develop an experimental study using a full factorial design of experiments.
7. CONCLUSIONS
This paper presents a 2D model and subsequent optimization of a PC emitter with the goal of lowering activation pressure emitters. The key insights of this study are that the architecture of an emitter can be used to predict flow rate versus pressure curves within a ±5% error bound. We also observed that orifice shape and size significantly affects activation pressure while the rest of the geometries and materials significantly influence PC behavior. A hybrid GA optimization coupled with ta fluid-structure interaction model was successfully used to lower activation pressure for PC emitters with varying different flow rates. The resulting model and the optimization approach was validated by manufacturing emitters with flow rates of 4, 6, 7 and 8.2 lph and testing them in-lab. Subsequent testing (under ISO guidelines) of the optimized 8.2 lph emitter in an industrial setting confirmed the in-lab results. These tests showed that the optimized 8.2 lph emitter has a 75% and greater reduction in activation pressure compared to the other commercial designs.
ACKNOWLEDGMENTS
The authors would like to acknowledge Dan Dorsch for his support throughout the project. We thank Devarajan Ramanujan for his help with this publication. This project would not be possible without the financial and technical support we received from Jain Irrigation System Ltd. Please note that the views and opinions expressed in this paper do not reflect those held by Jain Irrigation System Ltd.
REFERENCES
[1] Iqbal M, Sahi FUH, Hussain T, Aadal NK, Azeem MT, Tariq M. Evaluation Of Comparative Water Use Efficiency Of Furrow And Drip Irrigation Systems For Off-Season Vegetables Under Plastic Tunnel. International Journal of Agriculture and Crop Sciences. 2014;7(4):185-190.
[2] Namara RE, Upadhyay B, Nagar RK. Adoption and Impacts of Microirrigation Technologies Empirical Results from Selected Localities of Maharashtra and Gujarat States of India. International Water Management Institute; 2005.
[3] Sivanappan RK. Prospects of micro-irrigation in India. Irrigation and Drainage Systems. 1994;8:49-58.
[4] Nkya K, Mbowe A, Makoi JHJR. Low -Cost Irrigation Technology, in the Context of Sustainable Land Management and Adaptation to Climate Change in the Kilimanjaro Region. Journal of Environment and Earth Science. 2015;5(7):45-56.
[5] Irz X, Lin L, Thirtle C, Wiggins S. Agricultural Productivity Growth and Poverty Alleviation Theoretical expectations of the effects of agricultural growth on poverty. In: Development Policy Review. vol. 19. Blackwell Publishers; 2001. p. 449-466. [6] Cervantes-Godoy D, Dewbre J. Economic Importance of Agriculture for Poverty Reduction. 2009;(23):27.
[7] Taylor, K., Shamshery, P., Wang, R. and Winter, A. A Mathematical Model for Pressure Compensating Emitters. ASME 2015 IDETC.
[8] Young, Warren C., and Raymond J. Roark. Roark's Formulas for Stress and Strain. New York: McGraw-Hill, 2012. Print. [9] Timoshenko, S., and Woinowsky- Krieger, S., 1987. Theory Of Plates And Shells, 2nd ed. McGraw- Hill Book Company, Chapter 13.
[10] Ghugal YM, Sharma R. A refined shear deformation theory for flexure of thick beams. Latin American Journal of Solids and Structures. 2011;8:183- 195.
[11] Judy J, Maynes D, Webb BW. Characterization of frictional pressure drop for liquid flows through microchannels. International Journal of Heat and Mass Transfer. 2002.
[12] Akbari M, Sinton D, Bahrami M. Pressure Drop in
Rectangular Microchannels as Compared With Theory Based on Arbitrary Cross Section. Journal of Fluids Engineering. 2009. [13] Kays WM, London AL. Compact Heat Exchangers. New York: McGraw- Hill; 1984.
[14] Haupt, R. L., Haupt, S. E. Practical Genetic Algorithms, 2nd edition: Wiley; 2004.