Data Science Strategies for Real Estate Development by
Sun Jung Park
B.S., Hotel Administration, 2013 Cornell University
Submitted to the Program in Real Estate Development in Conjunction with the Center for Real Estate in Partial Fulfillment of the Requirements for the Degree of Master of Science in Real Estate Development
at the
Massachusetts Institute of Technology September, 2020
©2020 Sun Jung Park All rights reserved
The author hereby grants to MIT permission to reproduce and to distribute publicly paper and electronic copies of this thesis document in whole or in part in any medium now known or hereafter created.
Signature of Author_________________________________________________________ Center for Real Estate
August 13, 2020
Certified by_______________________________________________________________ Dr. Andrea M. Chegut
Research Scientist, Center for Real Estate Thesis Supervisor
Accepted by______________________________________________________________ Professor Dennis Frenchman
Class of 1922 Professor of Urban Design and Planning Department or Urban Studies and Planning
Data Science Strategies for Real Estate Development by
Sun Jung Park
Submitted to the Program in Real Estate Development in Conjunction with the Center for Real Estate on August 13, 2020 in Partial Fulfillment of the Requirements for the Degree of Master of Science in Real Estate
Development
ABSTRACT
Big data and the increasing usage of data science is changing the way the real estate industry is functioning. From pricing estimates and valuation to marketing and leasing, the power of predictive analytics is improving the business processes and presenting new ways of operating. The field of affordable housing development, however, has often lacked investment and seen delays in adopting new technology and data science. With the growing need for housing, every city needs combined efforts from both public and private sectors, as well as a stronger knowledge base of the demands and experiences of people needing these spaces. Data science can provide insights into the needs for affordable housing and enhance efficiencies in development to help get those homes built, leased, or even sold in a new way.
This research provides a tool-kit for modern-day real estate professionals in identifying appropriate data to make better-informed decisions in the real estate development process. From public city data to privately gathered data, there is a vast amount of information and numerous sources available in the industry. This research aims to compile a database of data sources, analyze the development process to understand the key metrics for stakeholders to enable decisions and map those sources to each phase or questions that need to be answered to make an optimal
development decision. This research reviews the developer's perspective of data science and provides a direction that can be used to orient themselves during the initial phase to incorporate a data-driven strategy into their affordable multi-family housing.
Thesis Supervisor: Dr. Andrea M. Chegut Title: Research Scientist, Center for Real Estate
Acknowledgments
This thesis would not have been possible without the patient support and thoughtful guidance of Dr. Andrea M. Chegut, my thesis advisor. From delivering inspiring lectures that sparked ideas of my thesis topic, connecting me with valuable contacts for research interviews, providing me an opportunity to work together at the Real Estate Innovation Lab with an amazing group of colleagues, and checking-in on a weekly basis, Dr. Chegut helped me focus on my research and supported me morally and intellectually during this challenging time of COVID-19.
I would like to thank every faculty member, staff, alumni, and my fellow classmates at the MIT Center for Real Estate and School of Architecture and Planning for taking extra steps in coming up with contingency plans to overcome interruptions caused by the pandemic, gathering additional support for students suffering financial need, and making our MSRED program an exceptional mid-career experience. Despite the disruptions and having to be spread out across the globe, the momentum in intellectual curiosity was not lost but only heightened with the shared determination to create solutions. I would like to thank my interviewees for providing valuable insights and sharing their experiences that helped shape my research. Special thanks to Michael Beckerman from CREtech and Daniel Landes from the King County Housing Authority for connecting me to additional experts that I could speak with to enrich my research.
Lastly, if it weren’t for my family and friends, I would not have the courage to pursue a master’s degree mid-career and persisted through courses and thesis research. I would like to thank my parents for supporting me and giving me countless opportunities in my life, leading to MIT. I would like to thank Tony, my husband, for always believing in me, loving me, and being an adventure and life partner. I would like to thank my sister for always being there for me, lending her ears at all times, and being a responsible role model that everyone in my family can rely on.
Table of Contents
Chapter 1: Introduction 5
Chapter 2: Background 7
Real Estate Data: What is it, how is it delivered and used, and where to find it? 7
Data for the Real Estate Development Process 9
Data for Affordable Housing Multifamily Development in the U.S. 11 Data Science, Econometrics, and Machine Learning for Affordable Housing Development 15
Chapter 3: Methodology 18
Databases for Data Providers and Data Management Solution Providers 18
Analysis of the Real Estate Development Process 19
Chapter 4: Results 22
Result 1: Data Companies for Real Estate Development 22
Headquarter Locations 22
Data Company Categories 22
Data Coverage and Data Volume 24
Crowdsourcing 24
Hardware Installation, Integration, or Deployment 25
Data Creation and/or Collection Enabler 26
Audience for Data Usage (External vs. Internal) 26
Real Estate Data Group 27
Real Estate Product Type 27
Real Estate Development Process 28
API 28
Result 2: Analysis of the Real Estate Development Process 30
Outcome Analysis 30
Feature Analysis 32
Result 3: Connecting Data Sources to the Real Estate Development Process 34 Result 4: Analysis of Affordable Housing Multifamily 35 Multifamily-Apartment Data and Data Solution Management Providers 35 Affordable Housing Multifamily Data and Data Solution Management Providers 37
Summary Highlights from Results 39
Chapter 5: Recommendations 41
Chapter 6: Closing Remarks 42
Chapter 1: Introduction
Social media platforms and search engines connect millions of users and collect billions of pieces of data. Facebook alone recorded 1.73 billion daily active users (DAU) during the first quarter of 2020, nearly 22% of the world populations.1 With the increase in usage of these platforms, the volume of data
collected and stored has also surged, and consequently, the concept of big data emerged. According to Oxford Languages, big data is defined as extremely large data sets that may be analyzed computationally to reveal patterns, trends, and associations. big data is not only massive in amount but also characterized by its variety, complexity, and the speed at which it needs to be analyzed or delivered.2 Given these
qualities, data science and its application around big data to enhance business decisions is a current challenge that many industries are trying to solve.
Despite the world’s recent interest in big data, the field of data science is not a new one and has been evolving since the dawn of mankind. The origin of one of its components, the data gathering process, can be traced back to 3200 BC Mesopotamia where transactional data was collected for commercial record-keeping purposes.3 Comparably, the data analysis process has been evolving with the increased
application of statistics and mathematics. In more recent years, the study of data science has made tremendous progress, and it is evident from the growing number of data companies that are collaborating with various businesses in optimizing operations procedures.
In the real estate industry, the adaptation of data science has been mainly focused on commercial real estate pricing and valuation. Researchers and practitioners used data science to calculate price indices that determine property market performance, estimate property value based on myriads of property’s
characteristics, forecast real estate performance based on economic trends, and more. However, the real estate industry is not made up of just financing and valuation. There are vast areas of opportunities in applying data science in the rest of the real estate functions and product types, both commercial and publicly funded.
Furthermore, the field of affordable housing development has often lacked attention and investment from the commercial sector. With the growing need for housing and increasing homelessness, especially during the COVID-19 pandemic, every city needs combined efforts from both public and private sectors to formulate better ways of providing affordable housing.
With the knowledge of the potential benefits of data science, this thesis explores two questions that can help inform the real estate industry:
a. What is a data science framework for real estate development?
b. How can the current landscape of data science support affordable housing multifamily development?
With these two questions in mind, this research suggests an initial framework for data science strategy for real estate development. It also provides a database of data and data management solutions companies and
1Statista, “Number of Daily Active Facebook Users Worldwide as of 1st Quarter 2020 (in Millions).” 2 Pence, “What Is Big Data and Why Is It Important?”
organizations currently available in the market. Lastly, it comments on the current practice of data science in the affordable housing multifamily development process.
As a result, this research presents insights on the characteristics of data and data management solution providers in the real estate industry, analyze outcomes and features of the development process, and suggest recommendations for real estate development stakeholders. These providers’ characteristics were analyzed by studying their similarities, differences, and overall distribution patterns relating to the data delivery method, data collection process, data audience, real estate function, real estate product type, real estate development phases, and API availability. Similarly, characteristics of outcomes and features were observed by studying distribution between numerical and categorical variables and data format. And, finally, a list of applicable data and data management solution providers for affordable housing multifamily development is presented for considerations.
The understanding gained from this research can help real estate stakeholders and specifically affordable housing multifamily developers consider data science applications from the perspective of the real estate development process. It can also help find appropriate data or data management solution providers for the respective steps, using the database of data sources. Moreover, the insights on the current market
dynamics of the real estate data companies can help various stakeholders recognize the potential saturation and gap in the market.
This thesis first introduces evolving definitions and market practices around real estate data, data for the real estate development process and affordable housing development, and data science strategy in Chapter 2. Chapter 3 describes the research methodology and steps taken to create databases and analysis of real estate development. Chapter 4 presents summary results from the analysis, followed by recommendations in Chapter 5 and closing remarks in Chapter 6.
Chapter 2: Background
Real Estate Data: What is it, how is it delivered and used, and where to find it?
Understanding different types of real estate data categorization is a good way to learn about the real estate data. The most recent categories of real estate data created by Winson-Geideman and Krause are core, static spatial, and peripheral data (Figure 1).4 Core data represents the traditional real estate data that
broadly includes financial, transactional, and physical data that are specific to each property. Static spatial data is extra-locational data outside of the property’s physical boundaries, such as neighborhood
information. Peripheral data is diverse, often human-focused, real-time data, and traditionally not considered real estate data and only recently incorporated into the analysis. This type of categorization shows the researcher’s attempt to encompass the wide and disparate data that is currently included and ever-growing in real estate analysis since the rise of the utilization of big data.
Figure 1: Examples of Real Estate Data Categorization by Winson-Geideman and Krause
With increasing interest in predictive analytics, the volume of newly incorporated static spatial data and peripheral data will grow, while the volume of core traditional real estate will remain the same. According to a report by Mckinsey and Company in 2018, nontraditional variables like the point of interest data contribute to 60 percent of the predictive power in real estate analytics and increase the accuracy of real estate asset value prediction.5 For example, a study done by Zamani and Schwartz found that including
Twitter language in a traditional real estate asset prediction model led to more accurate assessment.6
Despite the shift in the interest to wield the big data, the effort needed to improve traditional real estate data cannot be dismissed. According to a study done by Ryan Stroud in 2017, 2,568 original property characteristics from 31 commercial real estate databases could be consolidated into 903 unique
categories.7 This shows how vast and unstandardized datasets are within the real estate industry and how
data analytics with real estate data can pose challenges to data scientists.
Additionally, the speed of progress on the application of data science varies depending on whether the data is quantitative or qualitative. For example, a study by Gyourko and Keim revealing the causal relationship between the stock market and real estate return, a quantitative dataset, was published in 1992, and numerous studies on housing price fluctuations were conducted before 2000.8 On the other hand,
studies on the value of design in real estate asset pricing, a qualitative dataset, are only currently being
4 Winson-Geideman and Krause, “Transformations in Real Estate Research: The Big Data Revolution.” 5 Asaftei et al., “Getting Ahead of the Market: How Big Data Is Transforming Real Estate.”
6 Zamani and Schwartz, “Using Twitter Language to Predict the Real Estate Market.” 7 Ryan Michael Stroud, “Informatics for Real Estate: Urban Technology Databases.” 8 Gyourko and Keim, “What Does the Stock Market Tell Us About Real Estate Returns?”
worked on by researchers at MIT Center for Real Estate. As part of their study, they collected 22 distinct architectural design features of 826 buildings in New York City. This study was a first attempt in the industry to analyze such an extensive list of design features.9 Prior studies on design features only focused
on a limited number of variables, such as the impact of award-winning architects and architectural styles on the asset value.
The application of data science with real estate data varies from one user to another as the industry has a wide range of users. From brokers to developers, various stakeholders in real estate require different types of data and contribute to making real estate data wide and disparate. These users want varying levels of control of their data and investment commitment in applying data science and data management. The knowledge of the real estate data landscape also varies significantly from one user to another due to fast-paced business interactions among real estate data providers. As each data provider and data management solution provider has its own expertise in specific datasets or superiority in functionality within a platform, collaboration, or business mergers and acquisitions are frequent. For example, real estate data provider CompStak is partnering up this year with Cherre’s real estate data analytics platform to enhance predictive analytics in commercial real estate.10 CompStak is also partnering up with Trepp’s
financing and investment analytics platform for similar reasons.11 CoStar Group, a commercial real estate
data and analytics provider, recently acquired Ten-X Commercial, a real estate transaction, and auction platform provider.12 Siemens, a multinational industrial manufacturing conglomerate, acquired Building
Robotics (or mostly known for its ComfyApp) to join its portfolio of smart building solutions.13 As these
examples show, data platform providers incorporate data sets from other data providers. Various analytics platforms are combined, and a group of specialty data management solutions becomes a package of solutions. For this reason, users will have difficulties navigating through and finding the right data and data management solutions.
For organizations trying to improve their usage of data analytics, the growth in the development of web application programming interfaces (API) by real estate data providers and data solution providers indicates easier access to real estate data. The most frequently observed example of API implementation in the real estate industry is the geographic information system (GIS) widgets that help visualize data of interest overlaid on a map. It is widespread to see government websites (e.g., City of NYC) with a GIS map showing the up-to-date population distribution based on certain characteristics of residents. The use of GIS widgets became common because companies like ESRI allowed its clients to embed its platform on the client website through the usage of API.
With the advancement of data analytics, there are service providers that support data providers in doing their business or improve the delivery of data service. For example, Zapier aims to connect online content from one online platform to another if API has not been developed yet from the original sources.14
Datarade, another new company in the industry, identifies data providers for their clients.
9 Rong et al., “The Value of Design in Real Estate Asset Pricing.”
10 Cherre, “Cherre and CompStak Announce Partnership to Integrate Verified Lease Comps and Transaction
Analytics into Cherre’s Platform.”
11 Trepp, “Trepp and CompStak Announce Data Integration of CMBS and Lease Comp Data.”
12 Wheeler and Spray, “CoStar Group Closes Acquisition of Ten-X Commercial, the Leading Digital Auction
Platform for Commercial Real Estate.”
13 Krioukov, “Comfy Joins the Siemens Family.” 14 API Evangelist, “API 101,” 101.
Data for the Real Estate Development Process
In identifying relevant data for real estate development, understanding of the overall process and individual tasks is essential. As a matter of fact, the full cycle of real estate development encompasses a wide variety of real estate functions. Earlier work by James Graaskamp explores the overall real estate process as an interaction of three different group’s interests and their actions thereupon: space consumer group, space production group, and public infrastructure group (Figure 2).15 Although this type of work
segregation based on the participants in the real estate ecosystem helps understand the interaction between each other, this representation is limited in providing sequential characteristics of the process and
restricting further analysis of individual tasks.
Figure 2: Real Estate Process by James A. Graaskamp
The design structure matrix applied by Benjamin Bulloch and John Sullivan resolves this issue and allows them to capture granular detail and informational relationships among real estate tasks (Figure 3).16 Some
of the details captured in their study included task, category of the task, phase of the task, and intent behind each task. Additionally, their study found that many tasks are repeated from the previous stage to
15 Graaskamp, “Fundamentals of Real Estate Development.”
16 Benjamin Bulloch and John Sullivan, “Application of the Design Structure Matrix (DSM) to the Real Estate
next but with deeper understanding as development progresses. This repetition of tasks allowed Bulloch and Sullivan to categorize tasks into five functional groups: Market and Competitive, Physical and Design, Political and Legal, Financial, and Project Management. Because of the level of detail and structure applied in their study, their list of real estate development stages and tasks can serve as a starting point for answering what data is applicable in each step of the development process.
Figure 3: Real Estate Development Process Baseline Matrix by Benjamin Bulloch and John Sullivan One aspect to consider using the real estate development process laid out by Bulloch and Sullivan (Figure 4) is the level of usage of internal and external data in each phase of real estate development. The
understanding of internal and external data can significantly help developers decide where and when to deploy resources for data science, i.e., purchase external data for market analysis or focus on internal data using data management solutions. For example, a developer needs more external data than internal data during the initial planning stage because they need to analyze the market and analyze potential sites before deciding on one.
Figure 4: Real Estate Development Phases by Benjamin Bulloch and John Sullivan overlaid with external and internal data usage volume
Furthermore, data needs to be explored separately depending on regionality and real estate product type because the real estate development process significantly varies based on these two factors. For example, whereas condominium developments in the U.S. follow a similar development process as any other real estate product and are funded mostly through construction loans, the development of a condominium in South Korea is funded by pre-sale of condo units before construction starts. Although luxury
condominiums in the U.S. do require a certain percentage of presale of condos for construction loans to be approved17, the development process is intrinsically different from South Korean condominiums that
entirely rely on presale of condos. These types of nuances in the process need to be taken into account when developing a study on data science strategy for real estate development.
Data for Affordable Housing Multifamily Development in the U.S.
A shortage of affordable housing has been a continued societal issue in the United States, especially in the metropolitan cities in recent decades. The definition of an Affordable Housing in the U.S. has been measured in terms of percentage of household income so that they have sufficient funds outside of rent payment to cover other non-discretionary costs. This metric was set at 20% of household income in the 1940s and since increased to 30% of household income.18 Any household that pays above 30% of
household income for rent is thus considered housing cost-burdened. Based on this definition, the National Low Income Housing Coalition (NLIHC) reported in 2018 that an average minimum wage renter could not afford modest rental apartments throughout the country.19 On the national level, it is
estimated that 12 million renter and homeowner households pay more than 50% of their household income for housing.20
Another indicator of the need for affordable housing is the widening gap between the growth in the number of jobs and the new housing supply. In New York City, while the average wage and salary employment increased by 7.3% between 2015 and 2018, the new housing supply increased by 2.2%. On top of the lack of housing, the continued rise in rent rate increased the burden to the renter. Nationally, the gap between the median rent and median household income widened significantly between 1960 and 2014, adjusting for inflation. According to ApartmentList, while median rent increased by 63%, median
17 Wolf, “Council Post.”
18 HUD, “Defining Housing Affordability.”
19 National Low Income Housing Coalition, “NLIHC Releases Out of Reach 2018.” 20 HUD, “Affordable Housing Overview.”
income increased by 20% (Figure 5).21 Even though the need for affordable housing is clear, the housing
crisis persists across the nation and needs reform.
Figure 5: Change in median rent vs. median household income by ApartmentList
Affordable housing in the U.S is tough to develop without government subsidies due to multiple factors. Most importantly, obtaining a sizable loan for an affordable housing development project is difficult as lenders determine loan issuance based on the project’s performance or net operating income (NOI), which is ultimately tied to the amount of rent to be collected. As affordable housings charge affordable rent to tenants, the overall rent collectible will always remain smaller than market-rate houses, discouraging investment from the for-profit sectors. On top of the known issue of increasing construction cost,
affordable housing development has additional costs related to local government design requirements and frequent community opposition, which adds approximately 7% and 5% to total construction cost
respectively.22 To combat these issues, affordable housing developers utilize various government
subsidies to supplement the cost to build affordable housing with additional burdens.
The process for developing subsidized affordable housing is more rigorous and cumbersome because of the complexity in meeting requirements of federal housing funding programs, limited funding amounts, and constantly changing government priorities. These factors require affordable housing developers to be flexible and adaptable to available funding and their respective requirements. Currently, there are multiple affordable housing federal programs and legislation such as low-income public housing, Section 8
21 Woo, “How Have Rents Changed Since 1960?”
22 Terner Center for Housing Innovation, UC Berkeley, “Terner Center Research Series: The Cost of Building
housing choice vouchers, Section 8 project-based rental assistance, housing trust funds, HOME funds and CDBG funds, however low-income housing tax credit (LIHTC) has been the largest federal program by the amount of funding received and that effectively encouraged input from the private sector businesses in development.23
Because of its complexity, the development process of affordable housing projects funded by LIHTC is a useful model for understanding affordable housing development stakeholders, typical steps of affordable housing development, and how information flows from one stakeholder to another. As shown in Figure 6, LIHTC is a federally funded program, and the U.S Department of Housing and Urban Development (“HUD”) determines the amount of federal budget each state receives. However, state and local housing agencies play a central role in being responsible for deciding the distribution of tax credit to appropriate projects. Internal Revenue Service (“IRS”) executes the physical distribution of tax credit based on HUD’s decision. Owners or developers often form LLC for the project with equity investors who receive a tax credit in return for being a majority shareholder. All affordable housing projects have to meet the compliance rules dictated by the housing agencies, including rent restriction, tenancy restriction based on income level, and duration of affordability.
Figure 6: Partners in LIHTC Deal by Urban Land Institute24
Because affordable housing relies on the government subsidy and serves to reduce housing insecurities, the significant use of data science in affordable housing focused on analyzing the housing needs
23 Tax Policy Center, Urban Institute and Brookings Institution, “What Is the Low-Income Housing Tax Credit and
How Does It Work?”
assessment and supporting policymaking. By understanding the existing housing supply and housing needs based on household income, affordable housing developers, and authorities that distribute funding can identify the gap in the market and find potential development site location and project scope. This style of development market research relies heavily on government data such as data from the U.S. Census Bureau and the HUD. For example, American Community Survey (“ACS”) from the U.S. Census Bureau provides information on housing characteristics nationally and serves data that feeds into
Comprehensive Housing Affordability Strategy (“CHAS”) data from HUD.25 Some of the critical data
points included in CHAS are the number of low- and moderate-income households, the number of households with housing cost burdens (i.e., spending more than 30% of household income for housing), and the number of households with severe housing cost burdens (i.e., spending more than 50% of household income for housing).26 With the decennial census data that captures the most accurate
population counts, CHAS is one of the most used datasets for affordable housing developers and local authorities.
In addition to primary federal-level data sources, various state and local authorities and institutions provide local data that are more granular for specific regions and supplement overall needs assessment. According to an Urban Institute study conducted in 2017 by Leah Hendey and Mychal Cohen, these sources can be divided into six different categories: regional agencies, local data intermediaries,
universities and colleges, state data centers, federal reserve banks, and community-based organizations.27
These sources can provide data that are difficult to be captured by national surveys like ACS, such as data on a minority group with a small population.
Despite the abundant range of datasets available from federal and regional sources, some challenges and considerations need to be thought through in utilizing these datasets.28 First, geographic coverage differs
from one dataset to another, thus depending on a location of interest, some data may not be available. Second, the timing of data’s availability or release varies and can limit the usage of particular data
analysis. Third, the level of data accessibility differs depending on the data infrastructure and data privacy policies. Fourth, varying formats of data determines whether the dataset is readily usable for analysis. Lastly, the cost of data and resources required in transforming the obtained data to usable form needs to be determined strategically to avoid redundancy.
Besides needs assessment, the growing area of use of data science in affordable housing is in supporting the development process. Similar to data usage in developing market-rate housing, affordable housing developers and local authorities have been increasing their commercial data usage. For example, rental listings like Zillow are used to determine how the market-rate affordable housings are priced. Credit scores from credit card companies are used to assess prospective tenant’s creditworthiness. Point of interest data like retail sales and foot traffic count is used to check which locations are of prospective tenant’s interest.
One persistent drawback in attempting to use commercial data for affordable housing rental comparison is that the current commercial datasets may not be comprehensive or specific enough to cover data points in
25 HUD, “Consolidated Planning/CHAS Data.”
26 National Low Income Housing Coalition, “HUD Releases Updated CHAS Data.”
27 Hendey and Cohen, “Using Data to Assess Fair Housing and Improve Access to Opportunity: A Guidebook for
Community Organizations.”
need. For example, the rent rate captured by various marketplace platforms like Zillow, Apartments.com, CoStar, and Craigslist are asking rates, not contract rates, and have limited information about the quality of rental units and utility payments.29 As many subsidized affordable housing units pay utilities on behalf
of the renters, commercial rental data that doesn’t specify these components will not result in a like-for-like comparison. Furthermore, because there are multiple commercial marketplace platforms available for homeowners to list their rentals, each platform will result in different benchmarks.30 For these reasons,
even though affordable housing developers and regional agencies utilize commercial data sources like CoStar, they are not sufficient yet to fully support affordable housing development.
Data Science, Econometrics, and Machine Learning for Affordable Housing Development
As an interdisciplinary field, data science amalgamates scientific learnings from statistics, advanced math, algorithms, and modeling. Combined with business knowledge, it can find patterns and consequently meaningful information from large sets of data.31 In this process, data scientists utilize econometrics to
explain the data set’s causality by testing hypotheses. They use machine learning to predict the future by learning the patterns observed in the past.32 These two major methods in data science both utilize
regression as a standard tool to understand the relationship between variables. As a starting point, the regression technique begins with setting up dependent variables, i.e., outcomes and independent variables, i.e., features. There are multiple types of regression models, as there are various types of relationships that can exist between a dependent and an independent variable.
Prior to conducting data science, understanding the role of a data scientist and the scope of work is critical in formulating an appropriate data science strategy. The role of a data scientist is defined to cover a broad array of activities that require various expertise (Figure 7): (1) statistics and probabilities, (2) data
visualization, (3) computer science and high-performance computing, (4) data wrangling and databases, (5) data ethics and regulation, (6) domain expertise, (7) communication, and (8) machine learning.33 With
this skills-set, data scientists support decision-making processes based on past data and predict future outcomes.
29 “Comparing Small Area Fair Market Rents With Other Rental Measures Across Diverse Housing Markets.” 30 “Comparing Small Area Fair Market Rents With Other Rental Measures Across Diverse Housing Markets.” 31 Data Science Association, “About Data Science.”
32 Quora Contributor, “What Are The Differences Between Econometrics, Statistics, And Machine Learning?” 33 John D. Kelleher and Tierney. p20
Figure 7: A skills-set desideratum for a data scientist by John D. Kelleher and Brendan Tierney In implementing data science projects, a basic project lifecycle framework follows five steps of OSEMN (Obtain, Scrub, Explore, Model, and Interpret) (Figure 8). An oldest, known project lifecycle framework started from Cross-Industry Standard Process for Data Mining (CRISP-DM) and evolved through either further enhancement or applying agility, but ultimately boiled down to this five-step framework.
Following the OSEMN framework, data scientists need to gather relevant data, clean and format data for machine learning, analyze data patterns and trends, create machine learning models for predictive analytics and forecasting, and then implement results to business operations.
In applying data science for affordable housing development, there are various considerations depending on the different phases and functions of the development process. For example, during the initial idea inception phase, there are actually many challenges resulting from the changing needs of each
development project. Because of the heavy reliance on government funding and its varying priorities per funding programs, affordable housing developers are often required to adapt to new types of
development, which present new combinations of variables into the data science model. From the construction stage onward, the internal data is not adequately captured nor shared at the industry level because usage of data management solutions and technologies that enable data capturing is scarce due to the overall lack of funding.
Additionally, a wide variety of types of affordable housing developers can be considered as another layer of complexity. For example, a mission-driven developer will focus on a particular set of variables on a specific demographic, e.g., non-profit developers for African American communities, while a regional developer serving one specific location will focus on geographical factors like historical architectural styles or preservation of cultural characteristics of a neighborhood.
Chapter 3: Methodology
An overall goal of this research was to map out relevant data resources to individual real estate
development processes, especially for affordable housing multifamily development. To fully understand current practices and potential future opportunities, the author first researched a broad use of data in real estate development, regardless of real estate product type, and then narrowed down the research to affordable housing multifamily development. The study included two workstreams with the aim of ultimately merging them. One workstream involved creating a database of data companies, and the other was to analyze and breakdown real estate development processes to identify what data is needed in each step of the development.
Databases for Data Providers and Data Management Solution Providers
To understand the current landscape of data science and data usage in the real estate industry, the author has created a database for real estate data and data management solution companies and organizations. Data were collected between April and July of 2020 from various online and in-person sources, including MIT Real Estate Innovation Lab, Crunchbase, CRETech, industry professionals, and other multiple online articles. Given the changing nature of the data and technology industry, because many companies are still in the startup phase and business closure, mergers, and acquisitions are frequent, this research’s timing is critical for the readers to consider as they read this paper.
The data collection process was conducted in multiple stages. A list of relevant companies and
organizations was first compiled based on their relevance to data science in the real estate industry. Then, they were categorized based on relevant features.
There were 178 companies and organizations in the sample data, and each data point was categorized by 37 features listed below:
1. Datapoint number
2. Company / Organization name 3. Company Website 4. Industry 5. Headquarter City 6. Headquarter State 7. Headquarter Country 8. US vs. International 9. Description 10. Type of Company 11. Data Crowd-sourcing 12. Data Aggregator
13. Data Creation & Collection Enabler
14. Hardware Installation, Integration, or Deployment 15. Internal vs. External
16. Other Related Solution Provider 17. Data Group
19. Real Estate Product Type
20. Real Estate Product Type (Commercial-Office) 21. Real Estate Product Type (Commercial-Retail) 22. Real Estate Product Type (Commercial-Hotel)
23. Real Estate Product Type (Commercial-Multifamily) Apartment 24. Real Estate Product Type (Residential-Multifamily) Condo 25. Real Estate Product Type (Residential-SingleFamily) 26. Real Estate Product Type (Short-term Rental)
27. Real Estate Product Type (Commercial-Senior Housing / Healthcare) 28. Real Estate Product Type (Commercial-DataCenter)
29. Real Estate Product Type (Commercial-Industrial) 30. Real Estate Product Type (Infrastructure)
31. Real Estate Phase 32. Source
33. API
34. API Info / Link 35. API Info (cont.) 36. Attributes 37. Attribute Link
Based on each feature, the author studied the distribution of companies and organizations to find patterns that could explain the real estate data market landscape. Throughout this process, the author grouped these companies and organizations based on similarities and differences.
Analysis of the Real Estate Development Process
An initial framework of the real estate development process was built on the Design Structure Matrix (DSM) created by Bulloch and Sullivan, which was primarily divided into six development phases, five task categories, and 91 tasks. Each task was grouped under a certain task category and a development phase to differentiate the functionality and temporal characteristics of individual tasks. The six development phases that tried to encompass the full real estate development cycle consisted of Idea Inception, Feasibility, Preconstruction, Construction, Stabilization, and Asset Management and/or Sale. The five task categories included Financial Analysis, Market and Competitive Analysis, Physical and Design Analysis, Political and Legal Analysis, and Project Management. Additionally, to accommodate subsidized affordable housing development, seven additional tasks that were initially not covered in the DSM were added as part of this thesis, making the total number of tasks 98.
In this research, the beginning steps of data science were applied to the real estate development process by analyzing each task’s outcome and features. First, the outcome is determined by examining the
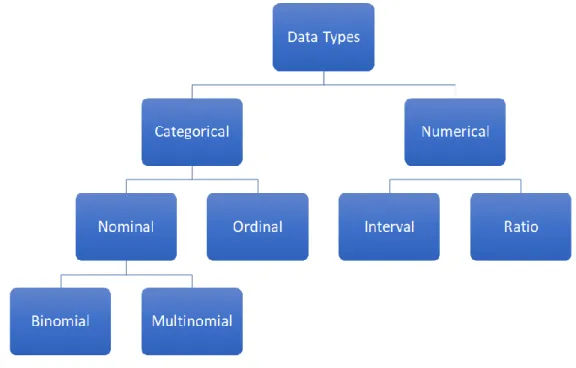
ultimate result that the developer requires from delivering each task. Then, outcome data were categorized by data type (see Figure 9 for a diagram of data type breakdown) based on the nature of the outcome data. This step of data type categorization is essential in data science as some statistical computation is only
applicable to specific data types.34 For example, calculating an average of two categorical data (e.g.,
color, sex, gender) does not provide any logical result. In contrast, an average of two numerical data (e.g., height, weight) provides a valid result. The types of outcomes used for categorizing real estate
development tasks included the smallest subsets of categorical and numerical data types such as binomial, multinomial, ordinal, interval, and ratio.
Figure 9: Data Type Pyramid
Together with categorizing the outcome variable, a format of outcome was identified for each numerical outcome, and individual categories of outcome were identified among ordinal, binomial, and numerical outcomes. For example, the format of an outcome for a potential project site location was identified as a location coordinate or a set of longitude and latitude. Similarly, the format of categories of a project’s degree of feasibility included these categories: strongly feasible, feasible, neutral, not feasible, strongly not feasible.
Finally, based on the author’s knowledge of the real estate development process, various feature(s) (i.e., independent variables) that may have the most significant effect or have a strong relationship to outcome have been identified and listed. The current list of features is not exhaustive and can be further improved in the future with additional research. After the initial identification of features, the author standardized terminologies to ease the analysis of features. As a result, a count of features was calculated for each task to understand how many features influence an outcome. Then the overall count of all individual features was calculated to understand each data point’s criticality.
34 UCLA Institute for Digital Research & Education Statistical Consulting, “What Is the Difference between
The resulting dataset of outcome and feature variables for each step of the real estate development process can be used for further studies using regression to understand which feature affects an outcome the most, highlighting critical variables for businesses.
Chapter 4: Results
Result 1: Data Companies for Real Estate Development
Headquarter Locations
Companies included in the dataset are spread among 22 states. More than half of the companies have their headquarters in California (31%) and New York (23%). Medium size clusters are also located in Texas (7%) and Massachusetts (6%). In California, the largest group is in San Francisco (23 out of 55 or 13% out of total), with the rest of the companies spread across 22 cities. In New York, most of the companies are located in New York City (35 out of 40 or 20% out of total). This trend is closely aligned with SmartAsset's index ranking of cities in the U.S. based on factors like data processing infrastructure, percentage of the workforce in computers and math, and the city’s open data score.35 With its reputation
as a technology capital and proximity to Silicon Valley, San Francisco is attracting many data scientists and establishing itself as a center for big data. Similarly, New York City’s high index can be attributed to its well-known data-driven city management style.
Data Company Categories
Companies and organizations have been divided into four categories: data provider, data platform provider, marketplace, and data management solution provider. Multiple selections were allowed to accommodate companies that provide users with several functionalities instead of one. This
categorization was conducted to understand the style of delivery of data (e.g., data file or report vs. data platform), the design of interaction with data (i.e., data is sold or given), and the externality of solution (i.e., data providers provide external data while data management solution provider allows users to manage their internal data better).
57% of the organizations in the data set (101 out of 176) provide data, falling into categories of data provider, data platform provider, and marketplace. The proportion between external data providers and solution providers of internal data (57% vs. 43%) signifies equal importance placed in utilizing both internal and external data in making business decisions. Especially in the real estate development process, a pendulum swings back and forth as the initial idea inception phase requires more external data for planning purposes. Thus, it involves market information while construction, stabilization, and asset management phases focus on how to optimize operations through understanding internal data.
Among the organizations that provide external data, data platform (63 out of 178) is the most popular style of data delivery compared to data in file or report form (30 out of 178) or marketplace (25 out of 178). This observation confirms the user's logical preference for processed data, which is often easily actionable and more informative supplemented by multiple data layering available today. Because many users of these external data do not perform data processing as their main job, e.g., a broker, agent, or developer, the more data is processed, the better for users as they can spend their time on day-to-day operations. With the recent addition of GIS and establishment of spatial data operations software provider like Environmental Systems Research Institute (ESRI), data platform providers could now combine layers of spatial data with various types of data like real estate quantitative data (e.g., historical sales price and rent rate) or demographic data (e.g., age and household income) to create a visual representation that is user-friendly and more informative.
Another critical data that gets incorporated into the real estate development process is the point of interest data (POI). POI data shows locations that people and companies find essential, like a restaurant and a grocery store. This data type is often determined by tracking foot traffic and store visits that show the number of customers or visitors to public or private locations, thus indicating a business’ performance or a level of importance to the community. Based on signal data from visitors’ mobile devices or sensor-tracked data, POI data is powered by a massive volume of real-time data and thus able to show change from one day to another and pattern that is specific to the time of the day. Several data platform providers like Safegraph, Unacast, Skyhook, and Idealspot, provide platforms that visually represent such POI data using heat maps and various graphs that can help in market analysis of the real estate development process.
In addition to the sophistication gained from the ability to consolidate data, data platform providers expanded their ability to guide their users by serving predictive analytics. Instead of just relaying aggregated data to the users, various data platform companies use machine learning techniques and artificial intelligence on historical data to provide forecasts and market trends for real estate professionals. HouseCanary, for example, can forecast real estate asset value to the next level of accuracy compared to the existing real estate data analytics companies and is collaborating with Google Cloud Dataset to serve numerous real estate investors and lenders.36 Revaluate forecasts likely movers and consequent leads for
future sale by analyzing various demographic and consumer data like purchase patterns that reveal potential sale or purchase of a house.
On the other side of the spectrum of predictive analytics is the data management solution providers that make predictions based on the internal data. While most data management solution providers help create, track and organize data, several companies also help users predict certain internal operational features. Smarking forecasts the dynamic pricing of parking spaces based on historical and real-time demand pattern analysis. Urbint uses artificial intelligence to prevent worker accidents and identify threats to infrastructure based on risk ratings built from various data points like historical risk scores, assessments from work history, and site conditions.37 Brytecore scrubs a pool of existing leads and can narrow down
to only those who are ready to transact by analyzing user behavior on the listing sites.38
Data Coverage and Data Volume
Data companies’ categorization based on data coverage and volume could not be conducted easily due to multiple reasons. Many data providers and data platform providers housed more than one datasets and used different performance metrics to measure their data coverage and volume. For example, CoStar Group covers three regions - the U.S., Canada, and the UK - and provides data on 12 thousand markets and submarkets, 1.1 million active listings for sale and lease, 5.1 million properties including office, industrial, retail and multifamily, 7.3 million tenant records, 9 million for-sale and lease comps, 2.1 million true owner record data changes per day.39 CoreLogic has multiple datasets, and each dataset has
different coverage - e.g., its investment tool covers Australia, US, UK, and NZ markets while its multiple listing platforms, Matrix, is a US-specific platform.40 Its data volume on property data covers 147 million
properties and 90 search criteria, while its consumer data includes over 700 million records. As observed in these two sample companies, variety in the type of available datasets, the volume of data, and coverage of data show the need for further study. Because the data analysis portion of this research relied mostly on the websites’ information, there was a limitation on more detailed analysis.
Crowdsourcing
Out of all of the sample datasets, 24% of the companies and organizations (43 out of 178) relied on crowdsourcing to aggregate data. Given the nature of their businesses, companies that provide Brokerage and Sales services, serving as a matchmaking platform for buyers and sellers by collecting information from both parties, make up most of this group (32 out of 43). Companies like Opendoor and Redfin, boosted by multiple listing services (“MLS”), are typical users of the crowdsourcing method as it is the most efficient way of collecting data from individual end-users to create a giant marketplace-like database.
The crowdsourcing method has also been implemented to collect other types of data in the real estate industry. First, companies that collect Market Intelligence data like CompStak and National Council of Real Estate Investment Fiduciaries (NCREIF) rely on inputs from their users, members, or subscribers.
37 Urbint, “Urbint Lens for Worker Safety.”
38 Brytecore, “Brytelytics - Predictive Lead Intelligence for Real Estate.” 39 CoStar, “CoStar Listing Data.”
Through CompStak Exchange, CompStak crowdsources its data from verified and active professionals at commercial brokerages and appraisal firms. Similarly, NCREIF collects its data from its members on a quarterly or monthly basis. In both cases, data on numerous individual leases or investment deals are aggregated, validated, and analyzed to produce market benchmark or market indices.
Another use of crowdsourcing is to facilitate networking, i.e., connecting service providers and service buyers, to increase productivity in the industry that often has multiple stakeholders. This usage is more observed in companies that provide data in Building Operations and Property Management and Construction and Architectural Engineering. Dobby, a property management platform, crowdsources profiles of each service provider and, in turn, allows homeowners to connect with local service providers vetted by their neighbors more easily. Building Connected, an Autodesk company, crowdsources profiles of each contractor and subcontractor and will enable owners or developers to connect with their service providers during the bid process.
Lastly, although not focused heavily on this dataset, companies providing booking services in Hospitality or Short-term Rental sector crowdsource room and room rate data. Often referred to as Online Travel Agencies (OTA), companies like Expedia crowdsource their data from individual property owners and list in their platform for customers to view and book a room.
On the opposite spectrum of crowdsourcing are companies that rely on the power of inquiries and in-person surveys. Analysts at Yardi Matrix call over 9.4 million apartment units in 77 markets three times per year, inquiring as prospects.41 At LiveXYZ, there is an on-the-ground mapping team that walks
around the cities and gathers details about each place and space including photographs.42 Compared to
crowdsourcing methods, this type of inquiry and physical surveys result in a more consistent dataset and can consequently obtain more accurate data controlled by in-house data collectors.
Hardware Installation, Integration, or Deployment
11% of the companies (20 out of 178) provide hardware to enable data collection. Fifteen of these companies provide data in Building Operations and Property Management or Construction and Architectural Engineering. The most frequent use case is the use of sensor and tracking technology to detect and capture built environment data such as temperature, water leakage, energy consumption, machine productivity, and space usage. These solutions are often provided as part of an integrated
building operations and property management platform that allows property managers to act upon insights as a preventive or reactive maintenance measure. One such example is Verdigris, a smart building
management platform provider that enables users to track their energy consumption with smart sensors and integrate with the building management system to analyze usage data for actionable insights. The second most frequent use case is the use of various image capturing devices to record status for construction progress tracking or marketing purposes. Doxel.AI deploys a robot surveyor with cameras, and Openspace uses smartphone cameras or cameras attached to the construction hard hats to capture construction site images and inspect construction progress. Through computer vision, these solutions can
41 Yardi RENTmaximizer, “Yardi RENTmaximizer Comparables.” 42 LiveXYZ, “LiveXYZ About Page.”
analyze and process images into actionable data that site managers can easily implement into their daily operations. Similarly, Aspec Scire utilizes drone-attached cameras to capture site images for various construction and development related tasks such as land survey, construction progress tracking, and project completion assessment. On the marketing front, companies like VirtualAPT capture apartment images with their proprietary robots and provide VR/360° image contents that can be posted on the client’s MLS platforms.
Data Creation and/or Collection Enabler
Out of the sample dataset, 39% (69 out of 178) enabled users to create and/or collect new data that they were previously unable to capture. Among these companies, the largest group provides data in Building Operations and Property Management (20 out of 69), followed by Brokerage and Sales (12 out of 69). Audience for Data Usage (External vs. Internal)
Out of the sample dataset, 48% (85 out of 178) provide data for internal use by customers, 42% (74 out of 178) for external use, and 10% (17 out of 178) for both. As shown in the sample set, most companies provide data for one segment of the data audience, either internal or external, due to limitations in the solution architecture and their strategy to focus on solving specific business processes. This finding is aligned with previously described distribution by data company category (e.g., data provider, data platform provider, marketplace, and data management solution provider).
One highlight from this distribution is that while most of the companies focus on either internal or external audiences for their product and data coverage, some companies provide multiple solutions that cater to both groups of audiences. Although known for its tenant engagement platform for existing tenants, HqO, an end-to-end operating system for commercial buildings, offers virtual tours for prospective tenants and engages customers from an earlier stage of the leasing and brokerage process. This type of vertical integration of services and consequent data consolidation across a real estate function will only be more prevalent in the future as customers’ preference to use one tool instead of many will eliminate inferior players in the market.
Real Estate Data Group
One hundred seventy-eight companies have been categorized into 15 data groups based on the type of data each company provides to the users. The most significant number of companies provide data on Brokerage and Sales (59), followed by Building Operations and Property Management (38), Market Intelligence (29), and Marketing and Business Development (14).
This observation is aligned with the current market sentiment that there is a website or an app for every step of the home-buying and home-ownership experience. Evidently, Brokerage and Sales data is now prevalent and easily accessible by the public and often at no cost. This data group includes data points like property’s physical characteristics, neighborhood, boundaries, title and ownership history, valuation, and loan options. While several big players are dominating the buyer-seller marketplace/portals such as Realtor.com, Redfin, and Zillow, and continuing to add on various features to become a one-stop-shop for home-buying experience, e.g., Realtor.com added a new feature to filter the search by the noise level43,
some companies are changing the way the public uses data. For example, Realscout and Remine both encourage the home search process to be conducted by agents and clients together from the beginning to collaborate through the home search process and seamlessly transition to transactions based on trust built through their experience together. On the other hand, there are players who have seen success by focusing their service into one specific area.44 As noted by Homebloq, a brokerage platform provider, a similar
pattern of startup lifecycle that happened around Craigslist is also occurring around Zillow. Now in the market, there are startup companies that focus on individual functions of what is part of Zillow’s wide portfolio of tools.
Real Estate Product Type
One hundred seventy-eight companies have been categorized into 11 real estate product types based on which product type each data set represents. As some data sets cover broad market insights or
construction/building management data that can be applied to various real estate types, multiple selections were allowed for each company. The total number of selections was 961. Based on this categorization, it’s concluded that the companies in the sample data set represent residential real estate the most, in the order of Multifamily-Apartment (121), Multifamily-Condo (114), and Single Family (105), followed by other commercial real estate products.
43 Falcon, “Realtor.Com Adds New Feature to Home Search That Shows Noise Levels.” 44 Homebloq, “Zillow Is the New Craigslist.”
Real Estate Development Process
The applicability of data and solutions provided by the companies and organizations from the sample dataset increases towards the latter stage of the real estate development process. This phenomenon is due to the increased usage of both internal and external data. The number of companies that can be used during the development starts at a lower point of 67 during the Inception phase, 69 during Feasibility, then jumps to 92 during Preconstruction and 93 during Construction, followed by the much higher count of 122 during Stabilization and 161 during Asset Management and/or Sale. This observation can be attributed to the fact that while tasks related to conducting market analysis or feasibility analysis and updating project underwriting continue throughout the real estate development process, tasks related to construction and operations form newly created internal data that needs to be additionally managed.
API
Based on the sample dataset, 54% of the companies and organizations provided API. For consistency purposes in this research, only those companies that indicated provision of API on their websites were identified, and those without any information were marked as unknown. Thus, there are possibilities that some of the companies that are marked as unknown may provide API. Similar to findings in the
background research, a high percentage of data companies providing API indicates the industry’s direction towards more fluid and connected use of data from various sources.
Result 2: Analysis of the Real Estate Development Process
Outcome Analysis
Concerning the phasing of development, there were, overall, more tasks in the order of Preconstruction (30%), Feasibility (21%), Idea Inception (18%), Construction (16%), Stabilization (9%), and Asset Management and/or Sale (5%). A higher concentration of development-related tasks prior to construction indicates more effort and time consumed in planning and preparation, which ensures fewer challenges during execution.
In terms of task categories, there were more tasks in the order of Physical and Design Analysis (31%), Financial Analysis (22%), Market and Competitive Analysis (17%), Project Management (15%), and Political and Legal Analysis (14%).
Out of all of the real estate development tasks, half of the tasks had categorical outcomes, 40% numerical outcomes, and 10% combination of categorical and numerical outcomes. Amongst numerical outcomes, the majority were ratio outcomes (45) compared to interval outcomes (4). Amongst categorical outcomes, the majority were nominal outcomes (42) compared to ordinal outcomes (17). Within nominal outcomes, 60% were binomial, and 40% were multinomial outcomes.
Several observations on the distribution of count of tasks broken down by task category and outcome type indicate which task category requires what type of outcome data. Although there are overall more tasks with categorical outcomes, tasks related to Financial Analysis require more numerical outcomes. This is because most of the financial analysis tasks heavily rely on assessing project performance by calculating financial performance measurements like project’s internal rate of return, property sales price, acquisition cost, loan amount, and effective rent. Secondly, all of the interval outcomes are concentrated in the tasks falling under the Project Management task category as these tasks require an understanding of time, e.g., project duration and project schedule. Also, tasks under Physical and Design Analysis require both categorical and numerical outcomes evenly. Most of these categorical outcomes are binomial outcomes due to numerous design documents, agreements, and approvals requiring yes-or-no decisions.
Similarly, a distribution of the count of tasks broken down by the development phase and outcome type highlights characteristics of outcome data type in each development phase. Idea Inception and Feasibility phases included more ordinal and ratio data than other data types as many of the tasks require developers to evaluate the degree of project feasibility from various angles like macroeconomy, capital market, and local politics and the degree of difficulty in managing risks, zoning process, and stakeholders. For example, in assessing risk, Project Management Institute (PMI) recommends a scoring method to
determine a project’s risk level, which is a form of ordinal data.45 In PMP’s risk assessment process, a
project is given a certain score, e.g., low (1), medium (2), high (3) based on the risk scenario’s probability of occurrence and impact.
Each task’s outcome was also analyzed based on the outcome format. A little over half of the numerical outcomes (19 out of 35) or one-fifth of all outcomes (19 out of 98) were in dollar amounts and included cost, the value of design, loan, rent, and NOI investment, land value, and sales price. The majority of ordinal outcomes were in the form of a level of feasibility or level of ability to obtain.
Feature Analysis
There was a total of 1,046 features across 98 tasks. Each task outcome had, on average, 11 features, a median of 9 features, and a range of a number of features between a minimum of two and a maximum of 44. Based on a breakdown of the number of features, it is observed that tasks related to Physical and
Design Analysis had significantly more features than other types of tasks. Lastly, tasks with numerical-ratio outcomes had more features than other types of task outcomes.
Out of 1,046 counts of features, 458 duplicates were removed, remaining with 588 unique features. Out of 588 unique features, Project Location was the most frequently appearing feature, followed by Economic Trend and Resource Availability. The majority of unique features (96%) appeared four times or less, and 65% of unique features appeared only once. The distribution of features signifies that there are wide and disparate features that influence the real estate development process, and understanding the influence of each of these features on the desired task outcome helps developers in deciding resource allocation.
Result 3: Connecting Data Sources to the Real Estate Development Process
The work to connect the database of data and data management solution sources with the real estate development process had limitations as this research did not involve analyzing actual datasets from each source. Although the real estate development process was broken down to show data points for each task as shown in Result 2, the database of sources in Result 1 was not able to capture their data points as only a handful of sources published a list of their data attributes on their websites. With further research and full collaboration with these companies and organizations, the next step in the study can aim to match the exact data points from the database to those of the real estate development process.
Other than matching the exact data points, the author also attempted to match two datasets by their data categorization, however, found this process also challenging due to differences in language used to describe each task and data categories. While the real estate development process was broadly broken down into five categories, such as financial analysis and physical and design analysis, the language used by data companies describe each task or data characteristics such as properties, boundaries, valuation, transaction, leasing, leads, consumer, and more. This observation highlights further studies needed on the commonly-used standardized terminologies amongst the data companies.
Currently, real estate developers gather data piece by piece throughout the development process and oftentimes rely on third-party partnerships to provide benchmarks such as market trend data from consultants, cost estimates from contractors, and valuation from appraisers. While larger and established developers have historical data from previously completed projects, smaller and newer developers do not have these resources. In addition, there is not much detailed data on real estate development project performance that is publicly available unless the project is publicly funded. Some developers use methods like scraping comparable project data from published articles; however, this method is time-consuming and requires investments in building up an in-house data strategy team.
This practice may soon change in the future with emerging companies consolidating data sets needed by developers and creating a user-friendly and action-oriented platform. One such example of this attempt is Deepblocks that aims to consolidate various site, zoning, and development cost data on an interactive 3D platform to allow developers to model and evaluate potential projects, including return potentials. Similarly, CityBldr enables developers to find the best site for the next acquisition opportunity. With the support of these real estate data companies, future development processes can become more efficient and faster in fulfilling development needs.
Result 4: Analysis of Affordable Housing Multifamily
Multifamily-Apartment Data and Data Solution Management Providers
The sample dataset was first filtered by Multifamily-Apartment to identify applicable data providers and data solution companies for affordable housing multifamily development. There were 121 resulting companies and organizations. Compared to the overall distribution captured in Result 1, similar patterns were observed across multiple variables.