Abstract— The separating characteristics of high
performance liquid chromatography (HPLC) columns, measured in terms of the height equivalent of a theoretical plate (HETP) and skewness of the eluted peak, are investigated using computational fluid dynamics (CFD). Gradually expanding and contracting sections are introduced at the inlet and outlet, respectively, in columns with and without frits and their performance was compared with that of the conventional columns without expanding and contracting regions.
Index Terms—Column efficiency, Computational fluid
dynamics, FLUENT, Frit quality, Liquid Chromatography.
I. INTRODUCTION
hromatography is an increasingly important separation process used in the fine chemical, pharmaceutical and biomedical industries. Although small-scale chromatography for analytical purposes has been established, the separating efficiency declines after scale-up [1,2]. In order to improve the separating characteristics of large-scale columns, one needs to have a good understanding of the controlling parameters affecting the separation which can then lead to the improvement of design and operation.
Computational fluid dynamics (CFD) allows us to study the hydrodynamics and other column characteristics thereby enhancing our understanding of this topic. It involves obtaining the numerical solution of the equations for the conservation of mass, momentum and energy of the flow through a geometry of interest. Additional equations reflecting the nature of the problem, like the adsorption isotherm equation, may also be needed. CFD is able to predict the fluid flow and the associated species concentration, heat transfer characteristics, chemical reaction rates and other pertinent quantities expected in HPLC operation.
Wu [3,4,5,6] and Lisso [7,8] have carried out studies on large-scale HPLC columns using a commercial CFD software,
Manuscript received November 9, 2002.
S.N. Tan was a student of the Masters of Science Course offered by High Performance Computation for Engineered Systems program of the Singapore-MIT Alliance.
B.C. Khoo is with the department of Mechanical and Production Engineering, National University of Singapore. He is also a fellow of the High Performance Computation for Engineered Systems of the Singapore-MIT Alliance.
FLUENT. They demonstrated that most of the simulation results concur with experiments in terms of the trends of dependence of the separating efficiency on the various variables under investigation. Although some simplifying assumptions made in the simulations may have prevented direct quantitative comparison to experiments, the trends discerned can certainly allow one to gain a better understanding of the controlling mechanisms of column efficiency.
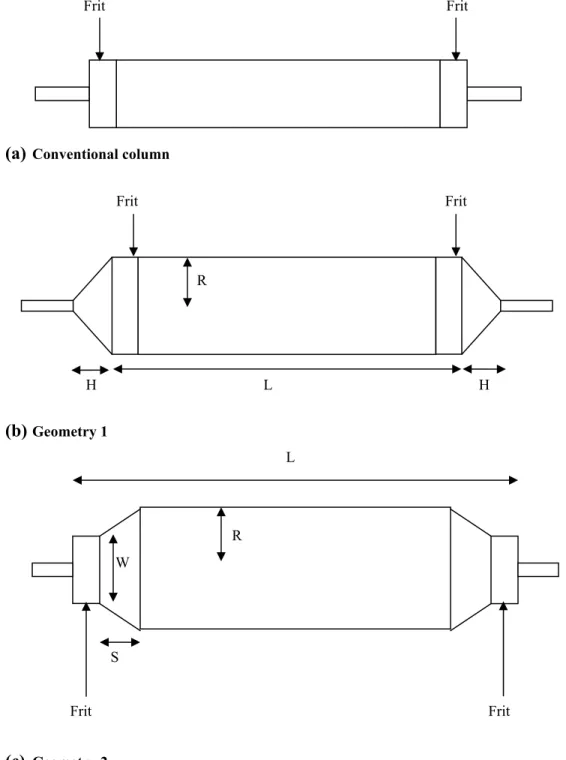
Wu [3,6] investigated the effect of column heterogeneity and frit quality (FQ) for the conventional column configuration shown in Fig. 1a. Here a section of frit is placed at inlet and outlet of the column. The main disadvantage of this configuration is that due to the sudden expansion at the inlet, the fluid velocity at the centre of the column is much higher than that near the wall. As a result the solutes at the centre will form the leading edge whereas solutes near the wall lag behind, giving a wide eluted peak and poor separating efficiency. To overcome this shortcoming, frits are placed at the inlet and outlet to distribute the fluid velocity more evenly. Wu found that an ideal homogeneous column had a lower HETP compared to a real column with radial variation in porosity. However, the performance of a fritless homogenous column was worse than that of a heterogeneous column with frit. This highlighted the critical importance of the frit in promoting good separation.
The ability of the frit to distribute fluid velocity, measured in terms of FQ, is limited and the development length before a uniform velocity is obtained decreases with increasing FQ. However simulations carried out with realistic values of FQ showed that the development length is small but still significant enough to decrease column efficiency. By modifying the inlet and outlet geometry of the column, the velocity profile in the column will change, thereby affecting the separating characteristics of the column. Wu did not consider the implication of such geometrical effects and this provides one of the motivations of the present work to investigate the effects of replacing the sudden expansion at the inlet and contraction at the outlet with a corresponding more gradual expansion and contraction. With gradual expansion and contraction the fluid velocity will be more evenly distributed in the radial direction resulting in a smoother flow transition between sections of different cross-sectional areas. This is in fact the role of the frit, and one is interested in finding out how column efficiency is affected with a combination of gradual expanding and contracting sections.
S. N. Tan, B. C. Khoo
Effect of Column Inlet and Outlet Geometry on
Large-scale HPLC
In this respect we aim to study a new geometrical configuration shown in Fig. 1b. It would be of interest to investigate if there are any advantages of the proposed geometry over the existing configuration in Fig. 1a.
The criteria used for measuring column efficiency are the height equivalent to plate ratio (HETP) and the skewness of the eluted peak. Wu and Lisso relied only on HETP as a measurement of performance. The extent of peak tailing is measured by the skewness parameter and so should be considered before we can justify whether better performance had been obtained as a result of the new geometrical configuration we have assumed.
II. THEORY
This section describes the governing equations and assumptions used in the simulation and the measurement of the separating performance of columns.
A. Governing Equations
The porous medium and frit are modeled in the same way as Wu and Lisso. The Reynolds number, with respect to particle diameter, is in the magnitude of 10-2, which falls in
the validated range of Darcy’s Law [9]. This justifies the use of the Navier-Stokes equations modified by Darcy’s Law.
α
µ
−
=
∇p
v (1)where p is the pressure, α is the permeability in each component direction, µ is the viscosity and v is the fluid velocity.
The Ergun equation [6] for flows of low Re is given as
(
)
3 2 21
150
ε
ε
µ
−
=
∇
pd
p
v (2)where dp is the characteristic diameter of the packing and ε is the porosity of the packing.
Comparing (1) and (2) we obtain
(
)
2 3 21
150
ε
ε
α
−
×
=
d
p (3)To model the frit, we begin with the Navier-Stokes equations as extended with Darcy’s Law
u
x
p
xα
µ
−
=
∂
∂
(4)v
r
p
rα
µ
−
=
∂
∂
(5) where r and x refers to the radial and axial direction, respectively, and u and v are the axial and radial velocity, respectively. The definition of FQ is given asv u
r
P
x
P
FQ
=∂
∂
∂
∂
=
(6) Dividing (4) by (5) we obtain x rFQ
α
α
=
(7) The dimensionless number FQ can be used to characterize the hydrodynamic distribution behaviour of a frit and can be determined experimentally. Lisso [7,8] found that the FQ for a sintered frit and a metal frit is about 50 and 100, respectively.B. Assumptions
The following simplifications and assumptions are made in the study:
1) The effect of flow variation among particles is excluded. It is presently too complex to consider the thousands of interparticle channels and intraparticle pores in the packed bed.
2) Diffusion between different species is neglected. 3) No adsorption between the solute and the stationary
phase takes place.
4) There is no porosity and permeability variation in the packed bed, i.e. the packed bed is homogeneous and ideal.
5) All processes are taken to be isothermal.
6) The various physical properties are independent of pressure. This also implies that the flow is incompressible.
7) The solute, solvent and mixtures of the two in any proportions have the same physical properties. Therefore the velocity field is independent of the composition of the fluid.
C. Measurement of Separating Efficiency
The concept of the number of theoretical units (NTU) [1] has been developed to describe and quantify the differences in the separating efficiency based on the eluted peak shape. Efficiency is a statistical calculation of the standard deviation of the peak in unit time and is calculated from moment analysis. The retention time, tR, is calculated using the first moment of the concentration with time, and given as
∑
∑
∑
∑
∫
∫
∞ = ∞ = ∞ = ∞ = ∞ ∞×
=
∆
×
∆
×
×
≈
=
0 0 0 0 0 0 i i i i i i i i i i Rc
t
c
t
c
t
t
c
cdt
ctdt
t
(8)The second moment is
(
)
(
)
∑
∑
∫
∫
∞ = ∞ = ∞ ∞−
×
≈
−
×
=
0 2 0 0 0 2 2 i i R i i i Rc
t
t
c
cdt
dt
t
t
c
σ
(9)2
=
σ
Rt
NTU
(10) On the other hand, the height equivalent of a theoretical plate, HETP, is defined asNTU
L
HETP
=
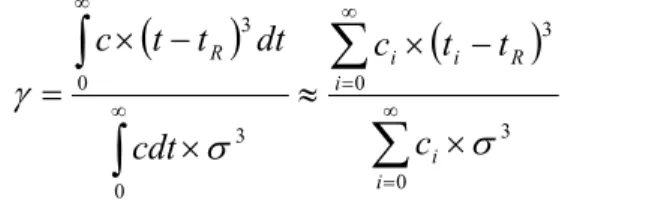
(11) where L is the length of the column. HETP is the preferred description of column efficiency as columns of any geometry can be compared as their efficiency per unit length. For good separation we desire columns with large number of plates so small HETP values are preferred.Another measurement of performance, skewness (γ), determines the asymmetry of the peak using moment analysis, and is given as
(
)
(
)
∑
∑
∫
∫
∞ = ∞ = ∞ ∞×
−
×
≈
×
−
×
=
0 3 3 0 0 3 0 3 i i R i i i Rc
t
t
c
cdt
dt
t
t
c
σ
σ
γ
(12)A Gaussian distribution leads to γ = 0. When γ > 0 the peak exhibits tailing. Conversely when γ < 0, fronting is observed. All the simulation results in this study yielded γ > 0.
Usually, a peak with a lower value of HETP will also have a smaller value of γ but this is not always true. A large value of γ will indicate severe tailing of the peak and retention of traces of solute in the column. This is undesirable as minute amounts of solute remains in the column while the majority has been eluted, making it difficult to separate mixtures free of a contaminating species. As this phenomenon is not reflected in the value of HETP, we may have to consider the value of γ as an additional criterion to gauge the performance vis-à-vis that of the conventional column.
For comparison purposes, we define two further parameters, χ and ξ, given by
al convention
HETP
HETP
=
χ
(13) al conventionγ
γ
ξ
=
(14)where
HETP
conventional andγ
conventional refer to the HETP and γ obtained with the conventional column configuration in Fig. 1a using a frit with the same FQ value as that of the column under study. When χ and ξ > 1, the column with the conventional geometry in Fig. 1a outperforms that with the geometry under study, and vice versa.III. SIMULATION SOFTWARE
The software used in the simulation is FLUENT version 5. Both Wu and Lisso had used FLUENT for their computational
works. FLUENT uses a control-volume based technique [11] to convert the governing equations to algebraic equations that can be solved numerically. The desired geometry of the column is generated using FLUENT’s pre-processing software, Gambit.
Ignoring round-off errors in the calculation, the grid size of the mesh, ∆x, and the time step of the time-dependent calculation should be as small as possible as it increases the accuracy of the solution obtained. However, this is at the expense of computational time. It was found that the solution obtained with a time step smaller than 0.1 seconds did not exhibit any appreciable change compared to the decrease in grid size. Therefore we have taken the time step to be 0.1 seconds, the same as that used by Wu [3,4,5,6]. Table I shows a typical sample of the results obtained when ∆x is varied. When ∆x is large, the percentage change in HETP and χ as ∆x decreases is also large. As ∆x becomes smaller, the corresponding percentage change in HETP and χ with decreasing ∆x gets smaller. We have chosen ∆x to assume the value of 0.5 mm for most of out computations. Under such conditions, the numerical solution is reasonably grid-invariance and should also be a good approximation to the true solution.
A square input of species A, acting as a tracer, is introduced into a stream of species B. Since the fluid properties are independent on the fluid composition, the flow profile in the column should remain unchanged throughout the entire simulation. In our approach, we will solve for the velocity field in the column when the column contains only species B. After a converged solution is obtained, we will activate the “species” model, and introduce species A into the column.
The convergence criteria used for the continuity equation, axial velocity, radial velocity and species calculation are 10-3,
10-3, 10-3 and 10-6 respectively. (It is infortunate that Wu and
Lisso did not state their convergence criteria).
IV. CONVENTIONAL COLUMN
Simulations are carried out for the conventional column configuration in Fig. 1a for comparison with the results obtained for columns with the proposed symmetry. FQ values of 100, 20, 2 and 1 are used.
Table II lists the physical parameters used for columns of geometry 1. The starting point for using these values follows from Wu and they are used in the subsequent sections unless otherwise stated. The inlet velocity is chosen such that the average velocity in the column is 0.001 m/s, this value being typical of existing systems.
We make use of (3) to calculate the permeability of the column, αc. We let
α
x of the frit to be one-tenth of αc and bydefinition
α
r=
FQ
×
α
x. When FQ = 1, i.e. for a fritless column, we takeα
x=
α
r=
α
c.Table III shows the HETP and γ obtained for the conventional column arrangement depicted in Fig. 1a and the distance measured from the sudden expansion at which a uniform velocity profile is obtained. It is found that both HETP and γ generally decrease with FQ indicating that the separating efficiency increases with FQ. This result is consistent with that obtained by Wu [3,6] and Lisso [7].
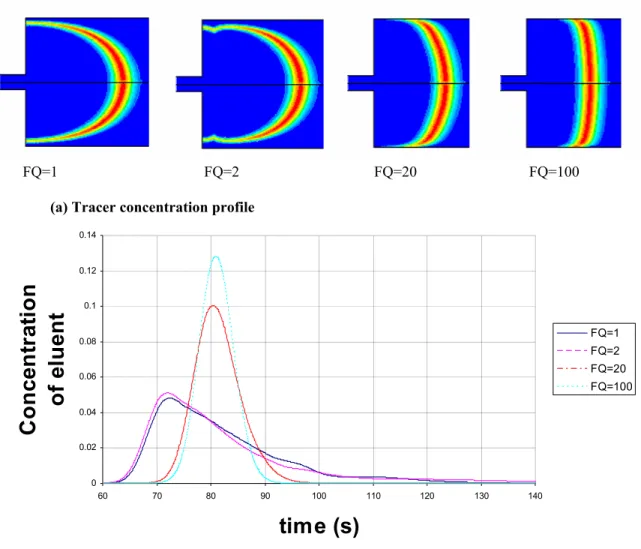
Immediately after the sudden expansion at the inlet, the fluid velocity is higher at the column center compared to that near the wall. As a result the solute near the centre will travel a longer distance down the column compared to those near the wall, giving rise to the curved profile in Fig. 2a. Generally frits of lower FQ require a longer distance before a uniform velocity profile can be obtained, resulting in a profile that is curved to a greater extent. The ultimate effect of having a curved profile is tailing of the eluted peak as the solute lagging behind takes a considerably longer time to be eluted.
From Table III we observe that as the FQ value increases, uniform velocity distribution is attained at a shorter distance from the frit, resulting in a less curved concentration profile in Fig. 2a. The resulting chromatogram is also less skewed and exhibits a lower extent of tailing with higher FQ value. However, even when FQ assumes a high value of 100, the profile is still curved at the region near the column wall. This results in tailing as indicated by the positive value of γ obtained although tailing is not noticeable from the chromatogram itself.
As real frits have limited ability to distribute the fluid velocity uniformly, there is an upper limit to the improvement we can obtain from increasing the FQ of the frit used. By keeping the current configuration in Fig. 1a, we do not expect to have any improvement in performance unless the velocity profile can somehow be altered separately. Wu [4,5] and Lisso [7,8] have demonstrated with simulations and experiments that feed temperature control can be applied to alter the velocity profile so that a more linear tracer profile can be obtained at the column outlet. On top of this, Lisso [4] also showed that a suitably-shaped elliptic inlet frit “straightens” the concentration profile and decreases HETP by modifying the velocity distribution. In view that changing the shape of the frit can have a significant impact on column efficiency, this provides the motivation of modifying the inlet and outlet column geometry to determine how column efficiency will be affected.
V. PROPOSED GEOMETRY
Bearing in mind that the main purpose of placing frits at the column inlet and outlet of the existing column geometry in Fig. 1a is to enable the fluid velocity to be as uniform as possible over the shortest distance, it is reckoned that a
variation of the geometrical arrangement at the inlet and outlet may lead to better separation efficiency. Compared to the conventional configuration in Fig. 1a, we have introduced a gradual expansion and contraction before and after the inlet and outlet frit, respectively as shown in Fig. 1b. With the additional conical-shaped section providing a smoother transition for flowing between sections of different diameter it may result in a more uniform distribution of the axial velocity, hence giving better separation characteristics.
As the region of contraction and expansion is not in contact with the column packing, we have a choice of packing it with a material of different permeability as the column packing or leaving it unpacked. Also the effect of having no packing at all will be investigated. The height of the expansion and contraction, H, will be varied to the same extent at both the inlet and the outlet sections while keeping L unchanged.
We require the length of the column to calculate HETP from (11). As the column is elongated with the addition of the contraction and expansion region, we will use the equivalent length, Leq, which is defined as the ratio of the volume of the
column, including the expansion and contraction regions, to the cross-sectional area of the main part of the column.
When a frit is used, i.e. when FQ > 1, the frit acts as a barrier separating the packing in the column with the expanding and contracting regions. This enables us to have a choice of the packing material for the latter. We will vary its permeability to be ten times lower, the same and ten times higher as that of the permeability of the column, αc, and
denoting these as case A, B and C, respectively. The simulation parameters used are the same as those in Table II and the porosity of the contracting and expanding region is the same as that as the frit and column. Table IV lists the value of permeability for the various regions in the column.
A. Case A (Permeability ten times lower than αc)
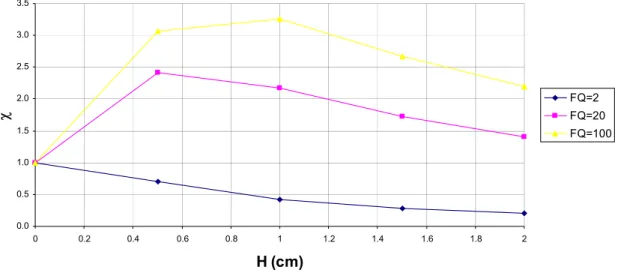
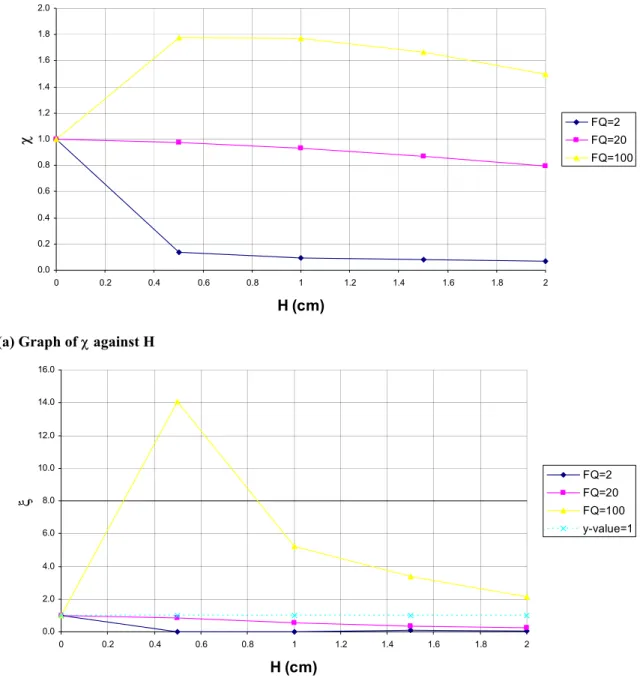
In our study, H is varied in steps of 0.5 cm from 0 to 2.0 cm. Fig. 3 shows the graph of χ and ξ. The results for FQ of 100 and 20 in Fig. 3 are rather similar in terms of trend. When
H is increased from 0 to 0.5 cm we find that the performance
of the columns has deteriorated, as evident from the drastic increase in χ and ξ. The extent of deterioration is greater for FQ = 100 compared to FQ = 20. The value of χ and ξ reaches a maximum before decreasing with H, but both still assume values greater than unity. Therefore the original column configuration performed better.
The corresponding tracer concentration profile is shown in Fig. 4. The concentration profile in the column, excluding the region near the wall, is more curved for frits with lower FQ values and is similar with the results obtained for the original column configuration in section 4. However, severe lagging of the solute near the wall is experienced with higher FQ value of 20 and 100. When H is sufficiently small we even encounter regions where the tracer concentration remains high while the bulk of the tracer has moved down the column. Even after more than twice of the column dead time, when most of
the tracer has eluted out of the column, the mole fraction of the eluted pulse is still in the order of 10-5. This is undesirable
as it will be difficult to purge the column free of a contaminating species and to obtain samples free of materials found in the previous run. Essentially one is hardly able to purify the mixture free of traces of undesirable substances.
To study the extent of solute trapping in the column, the maximum concentration of the solute remaining in the column is plotted against the ratio of time elapsed to the dead time of the column, to, in Fig. 5. It is necessary to divide by the dead
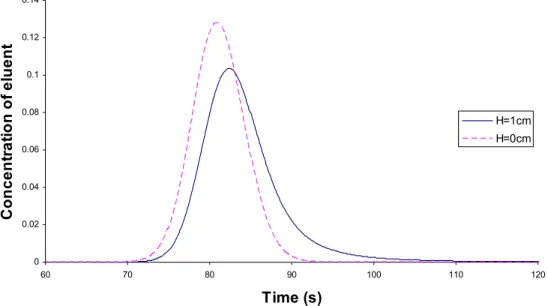
time to account for the difference in volumes of columns with different H. Ignoring the cases when H = 0, Fig. 5 shows that the trapping is worst with high FQ values and low H values. A different trend is observed when H = 0, where the residual concentration falls more quickly with higher FQ values. In Fig. 5c, the column with H = 0 had the sharpest fall of residual concentration. Fig. 6 compares the chromatogram obtained for
H = 0 and 1.0 cm for FQ value of 100. Not only is the peak
height lower and the peak more spread out, tailing is clearly visible for the latter and this is confirmed by the large values of ξ obtained.
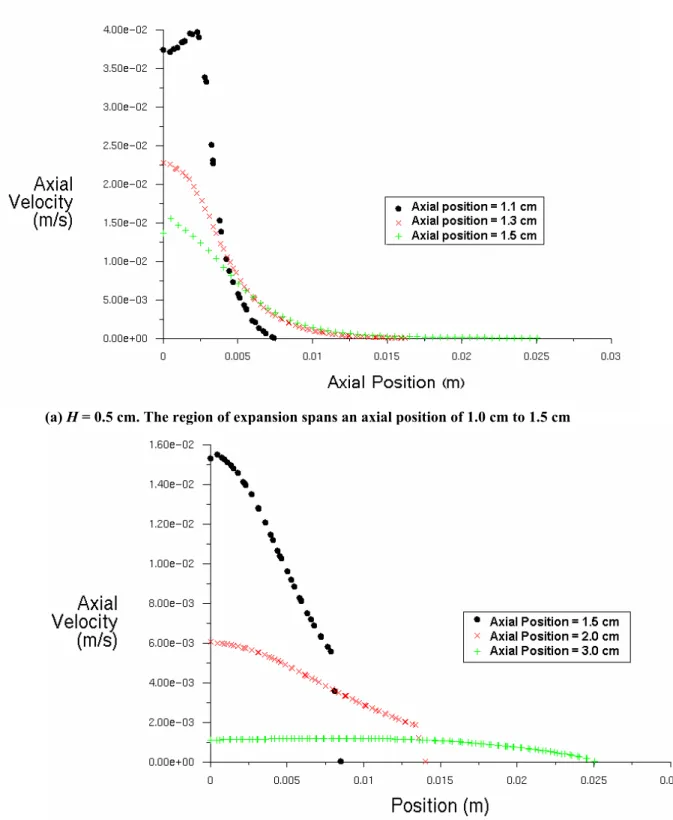
The occurrence of the above-mentioned regions can be explained by studying the axial velocity profile given in Fig. 7, shown for the extreme values of H in our study. When H is 0.5 cm, Fig. 7a shows that the axial velocity distribution is highly non-uniform such that most of the axial flow of fluid is restricted to the central part of the column. This is attributed to the frit having such high FQ values so that the axial flow is severely retarded compared to the radial flow. The axial velocity of the fluid in the region of solute entrapment is low as the resistance to flow through the frit in the axial direction is much greater compared to the resistance experienced when the fluid is flowing into the same frit section in the radial direction. Due to the low fluid velocity in this region, solute entering tends to remain there for a considerable period of time. Fig. 7b for H = 2.0 cm shows that the velocity profile is more uniform compared to H = 0.5 cm. The zone of low fluid velocity does not exist, therefore the performance is better for higher H.
In contrast, when the frit assumes a lower FQ value of 2, Fig. 3 shows that χ and ξ are less than unity for the entire range of H, and performance increases as H increases. Although the curvature of the concentration profile, shown in Fig. 3, is higher than that obtained for FQ 100 and 20, we do not observe severe solute lagging near the column wall or any region of solute entrapment. The absence of this region causes the maximum concentration of the solute remaining in the column to diminish quickly with time as shown in Fig 5c. However, as far as the absolute value of HETP is concerned, the lowest HETP obtained by a frit of FQ 2 is about 4 times higher than that of employing the original configuration with a frit of higher FQ at 100.
B. Case B (Permeability same as αc)
By keeping the permeability of the region of contraction and expansion the same as that of the column, we observe in
Fig. 8 that χ and ξ decreases with H for the entire range, and are less than unity, for frits of FQ 2 = and 20. The extent of performance improvement is greater for the FQ value of 2 as χ and ξ are smaller. Also, the tracer concentration profile is less curved when H increases (see Fig. 9) and no zone of solute entrapment can be seen. Although the addition of the expanding and contracting region using a frit of FQ 2 and 20 resulted in better performance compared to the original configuration, the HETP obtained is still higher than that when a frit of FQ 100 is employed using the original configuration.
For FQ = 100, χ and ξ increases when H is increased from 0 to 0.5 cm and decreases subsequently with H. Regions of low velocity where the tracer concentration takes a long time to decrease are not encountered. The tracer concentration profile in Fig. 9 is almost straight, which is typical of frits of high FQ, except for the region near the wall where severe lagging is observed. As a result of the severe deviation of the solute near the column wall from those near the centre, peak tailing occurs, ultimately resulting in poorer performance.
C. Case C (Permeability ten times higher than αc)
Similar results are obtained for FQ = 20 and 2 in terms of the variation of χ and ξ with H, as shown in Fig. 10. Column efficiency improves, as evident from the decrease in χ and ξ when H is increased from 0 to 0.5 cm and then χ and ξ stays about constant with H. The extent of performance improvement was greater for FQ 2 compared to FQ 20. When FQ assumes the value of 100, the value of χ is approximately unity while ξ is lower than 0.4 for all the simulations carried out. There appears to be no apparent advantage since χ is slightly greater than unity for H greater than 1.0 cm. However, the low value of ξ indicates that the peaks obtained are more symmetrical than that obtained by the original column configuration and the extent of tailing is much lower.
The residual concentration of the tracer in all columns decreases at a faster rate compared to the other columns in Case A and B. Therefore another advantage of this configuration is that the time taken to flush the column is shorter than the other configurations investigated so far.
Another interesting observation is that the values of HETP for the different FQ values investigated have values close to one another, except for H = 0 (see Fig. 11). This is remarkable as it means that we can achieve comparable performance as that of the original column configuration with frit of FQ 100 with a frit of only FQ 2 in the new geometrical arrangement.
D. No packing in contracting and expanding region
The general result obtained for FQ ranging from 2 to 100 and H ranging from greater than 0 to 2.0 cm showed the presence of a circulating zone in the expanding and contracting regions. Fig. 12 shows a typical diagram of velocity vectors in this region. As H increases, the size of the circulating zone increases. Fig. 13 shows the graph of χ and ξ
obtained for FQ = 100, 20 and 2 and the corresponding tracer concentration profile is shown in Fig. 14.
When FQ = 2, χ is smaller than unity for all H values while ξ is smaller than unity for H ≤ 1.0 cm. The concentration species plot for H = 1.5 cm and 2.0 cm in Fig. 14 shows that the solute tend to remain in the circulation zone, somewhat similar to the zones described in section 5.2.1. Although χ is smaller than unity when H is 1.0 cm or higher, we cannot accrue it having better performance over that of the original configuration as ξ is greater than unity and due to the presence of the solute-trapping region. When H is 0.1cm, the concentration profile is almost straight for the entire column cross-section. In Fig. 15 where the absolute HETP values are plotted against H, it is clear that the HETP at FQ 2 is comparable to that obtained with frit of FQ 100 in the original column configuration.In fact, the performance obtained in slightly better as the reduction in HETP is about 15%.
For FQ = 100 and 20, χ and ξ are less than unity when H ≤ 0.2 cm and H ≤ 0.4 cm, respectively. Therefore, the larger the FQ, the smaller is the H value required to ensure better performance is obtained. The concentration profile is almost straight for the minimum χ and ξ obtained while the other configurations with higher H values had a curved profile.
E. Fritless Columns
So far, the results presented are only for columns with frits. This section is solely devoted to fritless columns. When the column is fritless, i.e. when FQ = 1, it is taken that the contracting and expanding region will be packed with the same material as that in the column. This arrangement is chosen as packing the column with more than one material will inevitably lead to increased packing imperfections and column heterogeneity. The works of Lode [12] showed that the porosity, and hence permeability, of a packed column is roughly parabolic in shape with higher porosity at the column centre. Based on the cylindrical parabolic distribution of radial velocity, Yun [13] and Miyabe [14] have theoretically studied the effects column heterogeneity and concluded that it leads to performance degradation. Wu [3,6] has confirmed these results by carrying out the equivalent simulations. Therefore we have good reasons to believe that when no frit is used the column should only be packed with one material.
Fig. 16 shows the results of χ and ξ obtained for various H values ranging from 0 to 2.0 cm. The values of χ and ξ are less than unity for the entire range of H and decrease with increasing H. The improvement in separating efficiency with
H is further supported by the decrease in the maximum
concentration of the solute remaining in the column with time as H increases. However, the performance cannot be matched with that obtained with a frit of FQ 100 used in the original configuration.
F. Summary of Results
For the various configurations where the expanding and contracting region was filled, it is found that the extent of performance improvement was higher for frits of low FQ. The
observation that the improvement is more significant in Case C, followed by case B and then case A showed that the extent of improvement is greater when the permeability of the expanding and contracting region was higher. Whereas columns of low FQ enjoyed a reduction of HETP with H for all cases, frits of higher FQ values may exhibit poorer performance when the permeability is low enough. The worst of such occurrence was due to the low velocity zone at the inlet where the solutes present take a long time to be eluted.
In case C, where the permeability of the expanding and contracting region is ten times higher than that of the column, the HETP obtained for all FQ values when H is greater than 0.5 cm is almost the same as that obtained with the original configuration and FQ of 100. This means that by modifying the geometry appropriately, a frit of FQ 2 can deliver the same performance as a frit of FQ 100 in the original column geometry.
In addition to lowering the HETP of the columns, having higher permeability in the regions of expansion and contraction also results in lower pressure drop across the columns. This can be evaluated from (1) and simulation results confirm it.
However, there is one caution over this optimism. A higher permeability means that the packing material has a larger pore size or that the porosity is higher. Given that the expanding and contracting region is relatively small compared to the column and the shape is not as regular, there may be difficulty posed in minimizing heterogeneity in the packing obtained. We have assumed that the bed is completely homogeneous in simplifying our model but we should be aware that if the column cannot be packed satisfactorily, then the better performance as indicated by simulations may not be fully realized.
From (3) used for computing the permeability of the packed region, leaving the region of expansion and contraction unpacked as in section V(D) is somewhat equivalent to packing it with a material of infinite permeability. The results indicate that when H is small enough, HETP is fairly independent of FQ and the performance obtained is slightly better than a conventional column using a frit of FQ 100. This observation is interesting as one can make use of a low-FQ frit to obtain better performance than that of the original configuration using a high-FQ frit. Also, the pressure drop obtained is lower than that of case A, B and C. As the H values required for better performance is only in the range of 0.1 to 0.5 cm, it may pose certain challenges for the manufacture of a column with such precise dimensions.
For fritless columns, the absence of the frit coupled with the motivation to eliminate problems of packing leading to column heterogeneity point to packing the expanding and contracting region with the same material as the main column. It is found that the column’s separating efficiency increases with H but it could not match the results obtained by columns
with high FQ frits. Therefore in practice such an arrangement does not present any distinct advantage.
VI. CONCLUSIONS
The separating efficiency of columns is compared to that of the original configuration (Fig. 1a) by evaluating two parameters χ and ξ. When both quantities are smaller than unity, the column under study outperforms that of the original configuration and vice versa.
It is found that having an expanding and contracting region of higher permeability gives rise to better performance compared to having a lower permeability. Another advantage of having higher permeability is the lower pressure drop sustained. In Case C, where the permeability of the region of expansion and contraction is ten times lower than that of the column, the minimum HETP obtained by frits of different FQ are very close to that obtained from a conventional column using a frit of FQ 100. Therefore we are able to achieve the same separating efficiency as a conventional column with a frit of high FQ by using a frit of low FQ as long as a suitable inlet and outlet geometrical configuration is employed.
By leaving the expanding and contracting regions of Geometry 1 unpacked gave better performance than Case C, as the pressure drop and HETP obtained were lower. There is a 15% decrease in HETP compared to a conventional column (Fig. 1a) using a frit of FQ 100. This means that we can have better separating characteristics by using a frit of FQ 2.
REFERENCES
[1] P. A. Belter, E. L. Cussler and W. S. Hu, Bioseparations Downstream Processing for Biotechnology, John Wiley & Sons, 1988.
[2] R. L. Cunico, K. M. Gooding and T. Wehr, Basic High Performance Liquid Chromatography and Capillary Electrophoresis, Bay Bioanalytical Laboratory, 1988.
[3] Y. X. Wu, “Computational Fluid Dynamics Study of High Performance Liquid Chromatography,” Ph.D. dissertation, Dept. Chem. & Env. Eng., National Univ. of Singapore, Kent Ridge, Singapore, 2002.
[4] Y. X. Wu, X. Wang and C. B. Ching, “Computational Fluid Dynamics Simulation of the Adsorption Separation of Three Components in High Performance Liquid Chrormatography,” Chromatographia, vol. 55, no. 7/8, pp. 439-445, Apr. 2002.
[5] C. B. Ching, Y. X. Wu, M. Lisso, G. Wozny, T. Laiblin and W. Arlt, “Study of feed temperature control of chromatography using computational fluid dynamics simulation,” J. of Chromatogr. A, vol. 945, pp. 117-131
[6] Y. X. Wu and C. B. Ching, “Theoretical study of the effect of frit quality on heterogeneous HPLC using Computational Fluid Dynamics” [7] M. Lisso, “Optimization of the Hydrodynamic Distribution in
Semipreparative HPLC Column,” Ph.D dissertation, Technological Univ. of Berlin, Berlin, Germany, 2001.
[8] M. Lisso, W. Arlt, Y. A. Beste, “Optimization of the HETP of Preparative HPLC column,” Chemie Ingenieur Technik, vol. 72, pp. 494-502, 2000.
[9] T. Farkas, G. Zhong and G. Guiochon, “Validity of Darcy’s Law at Low Flow-rates in Liquid Chromatography,” J. Chromatogr. A, vol. 849, pp. 35-43, 1999.
[10] S. Ergun, “Fluid Flow through Packed Columns,” Chem. Eng. Prog., vol. 48, no. 2, pp. 89-94, 1952.
[11] FLUENT Inc. User’s Guide Volume II, FLUENT 5, July 1998.
[12] F. G. Lode, A. Rosenfeld, Q. S. Yuan, T. W. Root, E. N. Lightfoot, “Review: Refining the Scale-up of Chromatographic Separations,” vol. 796, pp. 3-14, 1998.
[13] T. Yun and G. Guiochon, “Modelling of Radial Heterogeneity in Chromatographic Columns II. Separation of a Two-component Mixture on a Column with Cylindrical Geometry,” J. Chromatogr. A, vol. 719, pp. 97-103, 1996.
[14] K. Miyabe and G. Guiochon, “Peak Tailing and Column Heterogeneity in Linear Chromatography,” J. Chromatogr. A, vol. 830, pp. 263-274, 1999.
Table I Sample results obtained for section 5.1.2 with FQ = 100 HETP × 10-4 (m) ∆x /mm H = 0 cm % change in HETP H = 1 cm % change in HETP χ % change in ∆x % change in χ 5 7.59 - 6.34 - 0.84 - - 2 3.25 57 4.68 26 1.44 60 -42 1 2.85 12 4.67 0 1.64 50 -12 0.5 2.86 0 5.06 -8 1.77 50 -7
Table III HETP and γ when H=0 (column configuration in Fig. 1a)
FQ HETP/×104 m γ Axial position to obtain uniform velocity distribution / cm
100 2.86 0.10 0.5
20 5.06 0.43 4
2 57.2 1.87 5
1 42.3 1.39 5
Table IV Summary of the permeability values used in the study
Region Column Frit Contracting
/Expanding Region Case αc × 1012 (m2) αx × 1012 (m2) αr × 1012 (m2) αc × 1012 (m2)
A: Permeability ten times lower than αc 2.96 0.296 FQ × αx 0.296
B: Permeability same as αc 2.96 0.296 FQ × αx 2.96
C: Permeability ten times higher than αc 2.96 0.296 FQ × αx 29.6 Table II Physical parameters used in Geometry 1
Physical Parameter Value Physical Parameter Value
Inlet velocity 0.0694 m/s Diameter of column 5.0 cm
Density, ρ 786 kg/m3 Length of column, L 19.0 cm
Viscosity, µ 7.4×10⁻⁴kg/ms Length of inlet/outlet frit 0.5 cm
Diameter of particles, dp 50 µm Length of inlet/outlet 1.0 cm Bed/Frit porosity, ε 0.4 Diameter of inlet/outlet 0.3 cm
(a)
Conventional column(b)
Geometry 1(c)
Geometry 2Fig. 1. Geometry of the various column configurations under study: (a) the conventional column with sudden expansion and contraction at the inlet and outlet studied in section 4, (b) Geometry 1 with gradual expansion and contraction studied in section 5 and (c) Geometry 2 with gradual expansion and contraction studied in section 6
R W S Frit Frit L Frit Frit R H L H R Frit Frit
FQ=1 FQ=2 FQ=20 FQ=100
(a) Tracer concentration profile
0 0.02 0.04 0.06 0.08 0.1 0.12 0.14 60 70 80 90 100 110 120 130 140
time (s)
C
o
n
cen
tr
ati
o
n
of
e
lue
nt
FQ=1 FQ=2 FQ=20 FQ=100(b) Chromatogram obtained with different FQ
Fig. 2. (a) Concentration profiles of the tracer at 10 seconds after solute has been introduced into the column and (b) the chromatogram obtained using frits of different FQ for the conventional column in Fig. 1a. The more curved concentration profiles for frits of lower FQ results in tailing of the eluent. Tailing is not visible for frits of higher FQ and the peak width decreases with increasing FQ.
0.0 0.5 1.0 1.5 2.0 2.5 3.0 3.5 0 0.2 0.4 0.6 0.8 1 1.2 1.4 1.6 1.8 2 H (cm) χ FQ=2FQ=20 FQ=100
(a) Graph of χ against H
0 5 10 15 20 25 30 35 40 45 0 0.2 0.4 0.6 0.8 1 1.2 1.4 1.6 1.8 2 H (cm) ξ FQ=2 FQ=20 FQ=100 y-value=1 (b) Graph of ξ against H
Fig. 3. Graph of (a) χ and (b) ξ against H for Geometry 1, case A. Better performance is obtained for FQ = 2
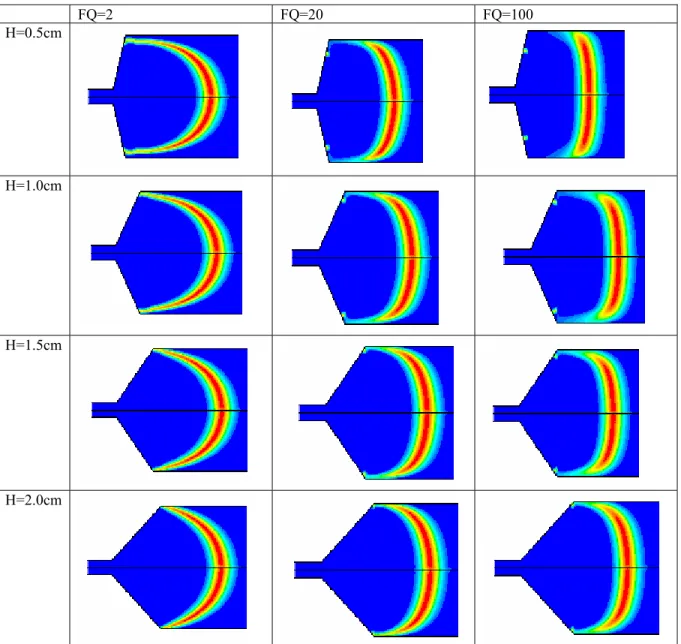
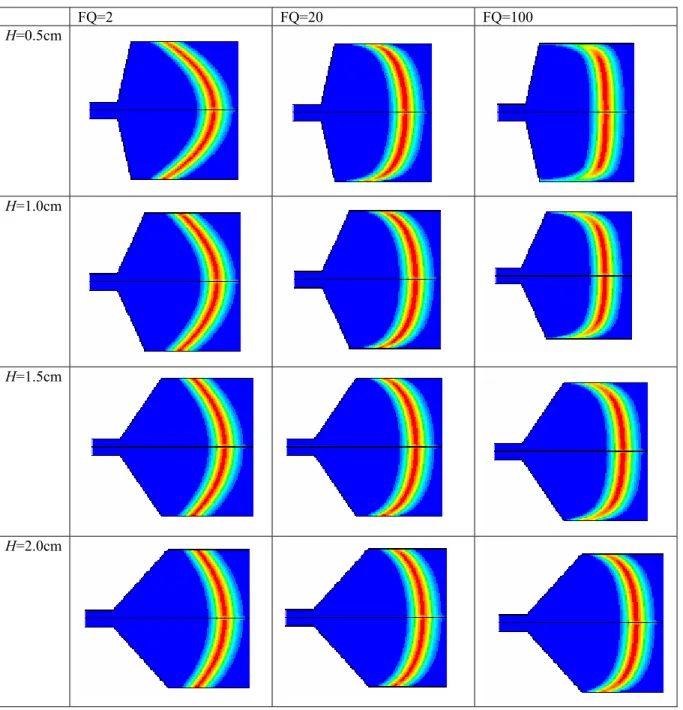
FQ=2 FQ=20 FQ=100 H=0.5cm
H=1.0cm
H=1.5cm
H=2.0cm
Fig. 4. Concentration profile of tracer at 10 seconds for Case A. Some solutes are “stranded” in the expanding region when FQ is high and H is small.
-18 -16 -14 -12 -10 -8 -6 -4 -2 0 0.8 1 1.2 1.4 1.6 1.8 2 t/to log( m a xi m u m conc ent rat io n) H=0cm H=0.5cm H=1.0cm H=1.5cm H=2.0cm (a) FQ =2 -14 -12 -10 -8 -6 -4 -2 0 0.8 1 1.2 1.4 1.6 1.8 2 t/to log( m a xi m u m conc ent rat io n) H=0cm H=0.5cm H=1.0cm H=1.5cm H=2.0cm (b) FQ = 20
-25 -20 -15 -10 -5 0 0.8 1 1.2 1.4 1.6 1.8 2 t/to lo g (m a xi m u m c o nc en tr at io n ) H=0cm H=0.5cm H=1.0cm H=1.5cm H=2.0cm (c) FQ = 100
Fig. 5. Graph of log (maximum residual concentration) against t/to for (a) FQ =2, (b) FQ = 20 and (c) FQ =
100. 0 0.02 0.04 0.06 0.08 0.1 0.12 0.14 60 70 80 90 100 110 120 Time (s) C o nc en tr at io n of el u e n t H=1cm H=0cm
Fig. 6. Chromatogram of H=0 and 1 cm for FQ value of 100. Tailing and a wider peak width occurs for H = 1.0 cm.
(a) H = 0.5 cm. The region of expansion spans an axial position of 1.0 cm to 1.5 cm
(b) H = 2.0 cm. The region of expansion spans an axial position of 1.0 cm to 3.0 cm
Fig. 7. Axial velocity distribution at various axial positions at the expanding region for (a) H = 0.5 cm and (b)
0.0 0.2 0.4 0.6 0.8 1.0 1.2 1.4 1.6 1.8 2.0 0 0.2 0.4 0.6 0.8 1 1.2 1.4 1.6 1.8 2 H (cm) χ FQ=2FQ=20 FQ=100
(a) Graph of χ against H
0.0 2.0 4.0 6.0 8.0 10.0 12.0 14.0 16.0 0 0.2 0.4 0.6 0.8 1 1.2 1.4 1.6 1.8 2 H (cm) ξ FQ=2 FQ=20 FQ=100 y-value=1 (b) Graph of ξ against H
Fig. 8. Graph of (a) χ and (b) ξ against H for Geometry 1, case B. Better performance is obtained for FQ = 2
FQ=2 FQ=20 FQ=100
H=0.5cm
H=1.0cm
H=1.5cm
H=2.0cm
Fig. 9. Concentration profile of tracer at 10 seconds for Case B. Frits of higher FQ have almost a straight profile but severe lagging of solutes is observed near the wall. This eventually leads to tailing and poor performance.
0.0 0.2 0.4 0.6 0.8 1.0 1.2 0 0.2 0.4 0.6 0.8 1 1.2 1.4 1.6 1.8 2 H (cm) χ FQ=2FQ=20 FQ=100
(a) Graph of χ against H
0.0 0.2 0.4 0.6 0.8 1.0 1.2 0 0.2 0.4 0.6 0.8 1 1.2 1.4 1.6 1.8 2 H (cm) ξ FQ=2FQ=20 FQ=100 (b) Graph of ξ against H
Fig. 10. Graph of (a) χ and (b) ξ against H for Geometry 1, case C. Significant improvement in performance
is realized for FQ = 2 and 20. For FQ = 100, HETP changes little with H but skewness is lowered when H is increased.
0.E+00 1.E-03 2.E-03 3.E-03 4.E-03 5.E-03 6.E-03 7.E-03 0 0.2 0.4 0.6 0.8 1 1.2 1.4 1.6 1.8 2 H (cm) HET P FQ=2 FQ=20 FQ=100
Fig. 11. Graph of HETP against H for different FQ and H for case C. The HETP for columns with frits of different FQ have very close values when H is large.
Fig. 12. Velocity vectors in the region of gradual expansion when the expanding and contracting region is left unpacked. The figure on the left shows the position of the circulation relative to the column while the figure on the right shows the velocity vectors in magnification. The circulation zone causes poor performance when
0 1 2 3 4 5 6 7 8 9 10 0 0.2 0.4 0.6 0.8 1 1.2 1.4 1.6 1.8 2 H (cm) χ FQ=2FQ=20 FQ=100
(a) Graph of χ against H
0 5 10 15 20 25 30 35 0 0.2 0.4 0.6 0.8 1 1.2 1.4 1.6 1.8 2 H (cm) ξ FQ=2 FQ=20 FQ=100 y-value = 1 (b) Graph of ξ against H
Fig. 13. Graph of (a) χ and (b) ξ against H for Geometry 1 with no packing in the expansion and contraction
regions. When H is less than 0.2 cm, better performance is obtained for all FQ values investigated. For FQ = 2, better performance is achieved for the entire range of H.
FQ=2 FQ=20 FQ=100 H=0.1cm
H=0.5cm
H=2.0cm
Fig. 14. Concentration profiles of the tracer at 10 seconds in columns of different H and FQ when the expanding and contracting regions are unpacked. The profile is almost straight when H is 0.1 cm and this leads to lower values of HETP compared to the conventional column geometry. However when H is large the circulating zone in Fig. 12 is large and solutes are “trapped” at the inlet region, eventually leading to tailing and higher HETP.
0.E+00 1.E-03 2.E-03 3.E-03 4.E-03 5.E-03 6.E-03 7.E-03 0 0.2 0.4 0.6 0.8 1 1.2 1.4 1.6 1.8 2 H (cm) HET P FQ=2 FQ=20 FQ=100
Fig. 15. Graph of HETP against H for Geometry 1 with no packing in the region of gradual expansion and contraction. HETP is almost independent of FQ when H assumes a value larger than zero.
0 0.2 0.4 0.6 0.8 1 0 0.5 1 1.5 2 H (cm) χ
0 0.2 0.4 0.6 0.8 1 0 0.5 1 1.5 2 H (cm) ξ
(b) Graph of ξ for fritless columns
Fig. 16. Graph of (a) χ and (b) ξ for fritless columns. The continuous decrease of χ and ξ showed that
Geometry 1 results in better performance for columns without frits and the increase is more pronounced when H is higher. 0 1 2 3 4 5 6 7 2.5 2.6 2.7 2.8 2.9 3 3.1 R (cm) χ W=2 cm W=3 cm W=4 cm