HAL Id: hal-00301707
https://hal.archives-ouvertes.fr/hal-00301707
Submitted on 2 Apr 2008
HAL is a multi-disciplinary open access
archive for the deposit and dissemination of
sci-entific research documents, whether they are
pub-lished or not. The documents may come from
teaching and research institutions in France or
abroad, or from public or private research centers.
L’archive ouverte pluridisciplinaire HAL, est
destinée au dépôt et à la diffusion de documents
scientifiques de niveau recherche, publiés ou non,
émanant des établissements d’enseignement et de
recherche français ou étrangers, des laboratoires
publics ou privés.
scenarios
P. Giacomelli, A. Rossetti, M. Brambilla
To cite this version:
P. Giacomelli, A. Rossetti, M. Brambilla. Adapting water allocation management to drought
scenar-ios. Natural Hazards and Earth System Science, Copernicus Publications on behalf of the European
Geosciences Union, 2008, 8 (2), pp.293-302. �hal-00301707�
Nat. Hazards Earth Syst. Sci., 8, 293–302, 2008 www.nat-hazards-earth-syst-sci.net/8/293/2008/ © Author(s) 2008. This work is licensed under a Creative Commons License.
Natural Hazards
and Earth
System Sciences
Adapting water allocation management to drought scenarios
P. Giacomelli, A. Rossetti, and M. Brambilla
Universit`a degli Studi di Milano – Agricultural, Agri-food and Environmental Economics and Policy Department, Italy
Received: 4 October 2007 – Revised: 31 January 2008 – Accepted: 6 March 2008 – Published: 2 April 2008
Abstract. Climate change dynamics have significant
conse-quences on water resources on a watershed scale. With wa-ter becoming scarcer and susceptible to variation, the plan-ning and reallocation decisions in watershed management need to be reviewed. This research focuses on an in-depth understanding of the current allocation balance of water re-sources among competitors, placed along the course of the Adda River. In particular, during the summer period, the de-mand for water dramatically increases. This is due to the in-crease in irrigation activities in the lower part of the basin and to the highest peaks of tourist inflow, in the Como Lake and Valtellina areas. Moreover, during these months, the hydro-electric reservoirs in the upper part of the Adda River basin (the Valtellina) retain most of the volume of water coming from the snow and glacier melt. The existing allocation prob-lem among these different competing users is exacerbated by the decreasing water supplies. The summer of 2003 testified the rise in a number of allocation problems and situations of water scarcity that brought about environmental and eco-nomical consequences. The RICLIC project is committed to the understanding of water dynamics on a regional scale, to quantify the volumes involved and offer local communities an instrument to improve a sustainable water management system, within uncertain climate change scenarios.
1 Introduction
1.1 The rise of water deficit on a regional scale
The amount of water in the world is finite. The number of people in the world is growing fast and water uses are grow-ing even faster (Petit, 2001). This paper aims to discuss the problem of water scarcity in the Lombardy Region, one of
Correspondence to: A. Rossetti
(rossetti.andrea@unimib.it)
the richest and most productive in Italy. During the last few years, the major river watersheds in Lombardy faced several situations of water deficit. During these periods, the supply of water was not able to satisfy the demand and consequently a loss of welfare for the watershed water users occurred. The diverted volumes for agriculture were reduced, thermoelec-tric and hydroelecthermoelec-tric run-of-river power stations were forced to reduce electricity production, because the flowing water was not enough to guarantee a regular input for either cooling or moving the turbines. Furthermore, municipal water was rationed and in some cases, especially in the sub-alpine area, the aqueduct system was not able to supply all the houses. Sub-alpine lakes were affected by several problems due to the reduced hydrometric levels: first of all, the water uptake from the lake for municipal uses was dramatically limited and the water quality reduced. The industrial waste- waters and the municipal sewer pipes became visible, since their po-sition was in some cases, situated above the lake surface. This situation led to both sanitary and health problems, as well as a decrease in tourist attractiveness, therefore affect-ing tourist income, so important in these areas. Moreover, the reduced hydrometric levels caused difficulties in both public and private navigation as well as serious shore instability and subsidence.
1.2 Regional Impact of Climate Change in Lombardy Wa-ter Resources: modelling and applications (RICLIC)
The increasing frequency of the aforementioned critical nat-ural events has been a boost to carry out a more in-depth analysis of natural water cycles and their connections with human activities in Lombardy. This study is the preliminary outcome of the RICLIC project (Regional Impact of Climate Change in Lombardy Water Resources: Modelling and ap-plications), funded by the Regional Agency for Environmen-tal protection, the University of Milano – Bicocca and the main no-profit foundations for the environment (Fondazione
Lombardia per l’Ambiente). The main target of this three-year project (started in January 2006) is to offer a method-ology to analyse and assess the consequences of climate change on the Adda River basin, the biggest in Lombardy and one of the most important in northern Italy.
In the project, socioeconomic effects caused by climate change in the region are investigated. Experts from differ-ent scidiffer-entific areas are committed, in order to attain a com-prehensive picture of the complex relationships inside the system. The starting point is a dataset of meteorological data, pluviometric data, maximum and minimum tempera-tures, analyzed over the last century. The impact of climate change on surface and underground water resources and the effects on agriculture will be studied. Together, all the ex-perts will analyse the physical consequences on the territory as a whole, combining their results to offer realistic physical scenarios. Starting from those scenarios, our research group is committed to the evaluation of the effects of water scarcity on the socioeconomic system and the quantification of the economic damage. The final aim of the project is to offer, by the end of 2008, a methodological scheme that will be em-ployed to produce different water management options, in scenarios of climate change (EEA, 2007a).
This paper aims to present the approach that is being used to understand the socioeconomic elements within the river basin, that are mostly affected by the phenomena of water scarcity. Environmental and socioeconomic features are vestigated, in order to understand how economic drivers in-fluence water availability. Moreover, water demand and wa-ter supply are compared, to understand if the current regional water supply system is able to support the productive require-ments of the area. In particular, a focus on the most critical periods during the year is performed at the present stage of the research. The physical scenarios are not available yet and therefore they will not be presented in this study.
2 The concept of drought
The discussion on the problem of water scarcity calls for a careful definition of the different meanings given to the term “drought”. Following the central aim of this work, only the “disciplinary perspective of drought” will be discussed here, because the focus is on the distribution of water among dif-ferent users. The United States National Drought Mitigation Centre (NDMC, 2006) offers different terms to distinguish the alternative disciplinary perspectives of drought: “me-teorological drought”, “agricultural drought”, “hydrological drought”, “hydrological drought and land uses” and “socioe-conomic drought”.
From the meteorological point of view, drought is defined by the rainfall conditions in a specific region of the world: the degree of dryness and the duration of the dry period, as com-pared to the average weather conditions in the area. “Agri-cultural drought” is focused on crops; the most important
fac-tor to take into consideration is the correspondence between plant water demand and weather conditions. It is possible to define agricultural drought when conditions of precipitation shortage, reduced groundwater levels and high evapotranspi-ration levels occur at the same time, during the most suscep-tible stages of crop development. “Hydrological drought” is closely connected to a precipitation shortfall and water sup-ply, but is out of phase with it. On a river basin scale, the “hydrological drought” shows how the deficiency of precipi-tation appears through the hydrologic system. The concept of “hydrological drought due to land use” expresses a condition of water deficit produced by a change in this use. Deforesta-tion, land degradation and the construction of dams all affect the hydrological characteristics; these changes in land use widen the impact of meteorological drought well beyond the borders of the precipitation-deficient area. Land use change is one of the ways human actions alter the frequency of wa-ter shortage, even when no change in the frequency of me-teorological drought has been observed. “Socioeconomic” drought occurs when the demand for an economic product exceeds the supply as a result of a weather-related shortfall in water supply. This definition links the supply and demand of some economic goods to elements of meteorological, hy-drological and agricultural drought. As for land use, the so-cioeconomic drought lags the occurrence of meteorological drought, because it depends on the time and space of produc-tive processes.
3 Methodology
3.1 Cause-effect approach
The method used to characterize the dynamics of the wa-ter management system in Lombardy over space and time is the one implemented by this research team to assess the eco-nomic effects of natural hazards (Sterlacchini et al., 2007). The aim is to make a connection between the causes of a cer-tain phenomenon and the consequences that it could bring to the socioeconomic system. Economists have adapted the “dose-response” approach (Purchase, 2000) and applied it to the economic assessment of environmental risks (Pearce, 1998; Starmer, 1998; Polelli, 2006). In this approach the natural hazard (the drought) is the cause, described by its physical characteristics and the consequences on the study area are the effects. Considering drought scenarios, the main physical effects of drought events are the physical conse-quences of water scarcity: reduced flows discharge and re-duced hydrometric levels in the lake. The “Mediterranean Water Framework Directive/EU Water Initiative Joint Pro-cess” (MED Joint Process WFD/EUWI, 2006) defines the drought impact as “the specific effect of drought on the econ-omy, on the social life and on the environment, which are symptoms of vulnerability”. Water shortage produces several socioeconomic costs to the water consumers (EEA, 2007b).
P. Giacomelli et al.: Adapting water allocation management to drought scenarios 295
In economic terms, such effects could directly or indirectly affect the socioeconomic system (Giacomelli, 2005). Direct damage quantifies, in economic terms, the physical conse-quences of drought. Indirect damage quantifies the economic consequences caused by the interruption of the economic ac-tivities (Bull, 1994).
3.2 Application to water deficit scenarios
The application of the cause-effect approach to drought sce-narios may result more difficult than to landslides or floods. In fact, water scarcity cannot be delimited to a specific area and the elements involved are not easily identified. In fact, when a situation of water scarcity occurs, its effects on a river basin are widespread. Moreover, the socioeconomic damages do not depend solely on the natural phenomena but are also strongly influenced by the general water resource management and by its governance during the critical peri-ods. In particular, the Adda River basin is a strongly reg-ulated system therefore, during the cause-effect analysis its water resource management strategies need to be taken into account. In situations of water deficit, an in-depth analysis of the trade-off between supply and demand of water needs to be carried out, to identify its weaknesses, and its effects on the socioeconomic system, by the end of the research project. Different potential scenarios, combining each water deficit factor (meteorological, hydrological, land-use), will be drawn up and a quantification of the socioeconomic ef-fects will be carried out for all of them.
4 Study area
4.1 Physical characterization
The Adda River basin covers a wide area, of about 7.979 km2, that extends across the Lombardy Region from north to south, following the total length of Adda River, 313 km. It can be roughly subdivided into three main sectors: the Alpine area (Valtellina), Como Lake and the Po Plain. In the Valtellina the Adda flows through a large glacial valley, from north-east to south-west in the first part and from east to west in the second, for an overall length of 119 km and an area of 2598 km2(Lombardy Region, 2006). Four important alpine Adda River sub-basins were not considered, since they are located on Swiss territory. On the other hand, the Lei and the Spoel basins were included in the study area, even though they do not physically belong to the Adda River basin but whose waters are artificially diverted into it for hydroelec-tric purposes. Some of the highest mountains in Europe sur-round this valley: among these, the Bernina, the Cevedale and the Adamello massif, characterized by the presence of glaciers. The overall surface of this alpine sector amounts to 3212 km2, and consists of two main sub-basin sectors. After having passed through the valley, the Adda River becomes a tributary of the pre-alpine glacial Como Lake, surrounded
by mountains. Because of its geophysical characteristics, the main inhabited areas are situated along the coastline. In Lecco, the Adda flows out from the lake, across the Po Plain, and ends in Castelnuovo Bocca d’Adda, where it joins the Po River, a few kilometres upstream from Cremona.
4.2 Hydrological system
The alpine catchment of the Adda River ranges over altitudes from 4050 m. to 198 m a.s.l. Its annual runoff cycle is greatly influenced by snow storage and melt dynamics and is regu-lated by means of 21 hydroelectric reservoirs that retain at their maximum capacity, an overall volume of 419.10 mil-lions of cubic meters (Mm3). One of the largest reservoirs, S.Giacomo di Fraele (64 Mm3), collects water (90 Mm3/yr) flowing from a diversion of the Spoel River, which is phys-ically part of the Inn River basin. Moreover, this part of the watershed is characterized by the presence of several dams that provide a more sensitive regulation, especially for flood prevention.
At the bottom of the Valtellina (198 m a.s.l.), the Adda flows into Como Lake, with an annual average discharge of 88.0 m3/s. The lake has an extension of 145 km2, a maximum depth of 410 m and an average depth of 155 m. The lake regulation is provided by the presence of a dam at its very end in Lecco-Olginate by which, hydrometric levels and water discharges are controlled.
The lowest sector of the watershed is conventionally de-limited between the Lecco-Olginate dam (198 m a.s.l., av-erage yearly discharge of 158.2 m3/s) and where the Adda joins the Po River (36 m a.s.l., average yearly discharge of 287.6 m3/s). Along its course through the Po Plain, the Adda is diverted for agricultural and industrial purposes by means of several catchments and sub-catchments, which in some cases bring water to productive areas in different watersheds. The amount of water diverted varies throughout the year to satisfy the oscillation in the demand of water, generated by the intensive human activities. In this sector, Adda River gets water from two main influent, Brembo and Serio River, flow-ing from the Orobic Alps, whose average discharge amounts to 20.8 m3/s and 18.20 m3/s, respectively (Lombardy Region, 2006).
4.3 Socioeconomic system
The first step of the analysis was to identify the exact area di-rectly affected by the Adda River water dynamics. All along its course, there is quite a complex overlapping of author-ities: the municipality is the main administrative unit, the management of water for civil purposes is carried out by the provincial authority and the Lombardy Region is in charge of administrating the whole system. The municipality is the administrative unit selected, as it best suits the purpose of the analysis. Given the complexity of the water system, it was chosen to consider the municipalities whose economy
Table 1. Demographic characterization of the three sub-areas. (Source: ISTAT, 2001).
No. of No. of Population Surface Density provinces municipalities (km2) (inhab/km2) Valtellina 1 78 174 116 3212 54 Como Lake 2 57 267 344 700 382 Po Plain 5 125 658 998 1119 589
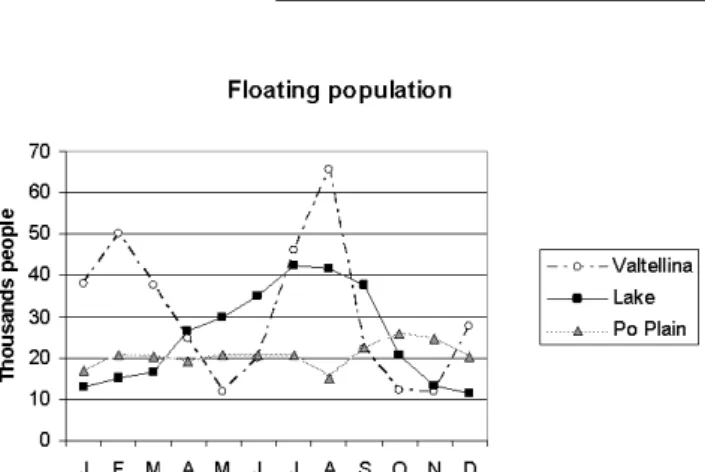
Fig. 1. Monthly oscillation of floating population for the three
sub-areas (Source: Lombardy Region, 2006).
strictly depends on the Adda River water supply system. In this way, the data presented in the following chapters refer to the selected 260 municipalities, whose water resources could be directly attributed to the Adda. To understand how water resources are exploited in the Adda River basin, the present chapter characterizes the main socioeconomic features in the River basin, by looking in depth at the three different areas presented before. As previously explained, the three areas are significantly different, not only from a physical point of view, but also on the basis of their socioeconomic character-istics; for these reasons, they will be separately analysed.
Starting from the North, the areas will be described follow-ing the flow of the Adda down to where it joins the Po. The Valtellina is situated entirely within the Sondrio Province; the analysis will examine data from 78 municipalities, for a population of over 174 000 inhabitants. Because of the phys-ical characteristics of the valley, railway and road connec-tions are not streamlined. This feature has given rise to a huge flow of commuters from the Valtellina that work in the nearest most industrialized provinces (Como, Lecco and Mi-lano Provinces) travelling to and from every day. Indeed, Fig. 1 shows that in holiday seasons the floating population in the Valtellina increases considerably and consists of both tourists and residents that work in the different cities.
Valtellina’s economy is mainly based on viticulture, cat-tle breeding and tourism. Tourism represents more than one third of the overall added value produced in the Valtellina, (3836 million Euros in 2004; source: UNIONCAMERE,
Table 2. Utilized Agricultural Area (UAA). (Source: ISTAT, 2001).
surface (ha) UAA (ha) % Valtellina 321 200 92 363 29 Como Lake 70 000 6208 9 Po Plain 111 900 90 317 81
2005). As a matter of fact, the service sector generates 69.1% of the overall province income; this is a significant result, considering that the service sector in Valtellina is tourism oriented. On the other hand, agriculture holds a very impor-tant role, with the production of some high quality products, like CDO (Controlled Designation of Origin) wines and PDO (Protected Designation of Origin) cheeses and meat.
The population of the Como Lake sector is over seven times bigger than in the Valtellina. Historically, communities settled along the lakeside to get food and water and a faster connection with the other side of the lake, for communication and commercial exchanges. The economy in this area shows some differences between the three branches of the lake: the northern branch, from Bellagio to Colico, the eastern branch, in the Lecco Province and the western branch, in the Como Province. The economy of the northern branch is more influ-enced by tourism and over the last years has been attracting more and more tourists, 60% coming from abroad. In the southern branches, industries represent the leading force of local economy, and local activities are strongly influenced by the lake. In fact, while in the eastern branch (the Lecco Province), local economy is based on metallurgical indus-try, in the western branch (the Como Province municipalities overlooking the lake), the most important economic activity is the silk textile industry, that forms 21% of Province indus-try.
The plain sector is part of the most important productive area in Italy. The whole area along the Adda attracts a huge number of people, thanks to the numerous job opportunities in different sectors, generating intensive daily flows of com-muters. The land is intensely exploited: 81% of the total area of the considered municipalities (see Table 2) is classi-fied as “Utilized Agricultural Area” (UAA). The main pro-duction of the agriculture sector in Lombardy is cattle breed-ing, as approximately 65% of the added value is generated by this sector; on the contrary, in the national Italian economy
P. Giacomelli et al.: Adapting water allocation management to drought scenarios 297
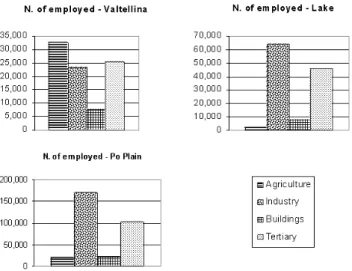
Fig. 2. Number of people employed in the different productive
sectors, for each area. (Source: own elaboration based on ISTAT, 2001).
the breeding sector accounts for only 30% of the total added value.
5 Human activities and hydrological cycles
5.1 Water supply
Lombardy water supply system has always been very rich in water and therefore, over the centuries with the rapid in-crease in human water-dependent activities it has been mod-ified to improve its efficiency. The first works were carried out during the Middle Ages to drain the wetlands and make them suitable for agriculture. Afterwards, artificial channels, dams and water pumps were built to increase water availabil-ity and to prevent flooding. The socioeconomic system has grown strictly dependent on the water supply system, since the water availability has historically represented an impor-tant factor for the expansion of human activities.
From the very beginning of the last century until the 1960s, the construction of hydroelectric reservoirs has increased the water stock capacity of the watershed, retaining water in sit-uations of surplus. Moreover, in 1946 the building of the Lecco-Olginate dam, at the end of Como Lake, provided an effective instrument for the regulation of the output dis-charges from the lake to the lowest sectors of the Adda Basin. The regulatory agency (the Adda River Authority-Consorzio dell’Adda) plays a central role in the water allocation cess and, by means of opening and closing the dam, pro-vides the best solution to satisfy irrigation, industrial activi-ties and run-on-river hydroelectric power stations (Consorzio dell’Adda, 2003). The average summer instantaneous stream flow, before the construction of Lecco-Olginate dam, mea-sured around 190 m3/s and, according to this constraining discharge value, the amounts of water rights intended for
hu-Fig. 3. Average ten day aggregate discharges from Lecco-Olginate
dam. Period: 1959–2000 vs. 1996–2005. (Source: own elaboration based on the Consorzio dell’Adda data, 2006).
man activities were calculated. The dam made it possible to increase the average summer discharge to values estimated at around 220 m3/s that, until now, has represented the upper boundary for water dependent human activities, in the lower part of the Adda River basin. Como Lake’s absolute capacity is estimated at around 22 500 Mm3. The hydrometric level of regulation ranges from −40 cm to 120 cm (Lecco-Olginate hydrometer) and corresponds to a maximum available regu-lation capacity of 254.3 Mm3. This volume is not very sig-nificant, since it represents 9% of the average annual input flow from the Valtellina into the lake (Fuentes hydrometric station). As stated before, the multi-target regulation of out-put discharges by the Adda River Authority needs to take into account both the peaks in water requirements and me-teorological events. Figure 3 shows details of the oscillation of the instantaneous stream flows (ten-day aggregate) from Lecco-Olginate dam, throughout the year, for the years 1959 to 2000 and the more recent 1996 to 2005.
The 1959–2000 curve shows the average historical trends of the lake regulation: a rapid increase in discharges from the beginning of April to the maximum levels of regulation dis-charges (220 m3/s), in June and July; after that period, during August, the discharges from the Lecco-Olginate dam start to decrease until the autumn peaks when, in response to high precipitations, the Adda River Authority increases the out-flows, to prevent floods in the coastal cities, Como in partic-ular. The comparison between the long period and the more recent short period curve shows significant differences. The irrigation period outflows are limited to the period from the middle of June to the middle of August, and the highest aver-age discharge levels are measured at around 192 m3/s, during the last ten days of June. Another interesting difference re-gards the autumn period: the 1996–2005 curve is character-ized by very low discharge levels during September and Oc-tober (80–90 m3/s) and a peak in the last ten days of Novem-ber. This may be due to local climatic variations in the Alpine and sub-Alpine regions that delayed the autumnal precipita-tion peak (a thirty days delay), therefore, snow accumulaprecipita-tion processes were delayed too.
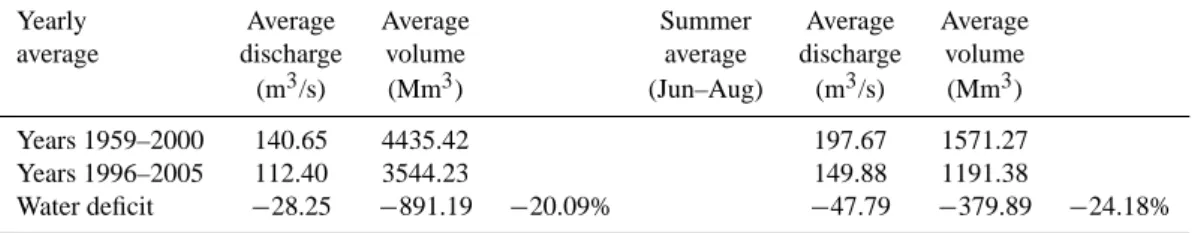
Table 3. Difference (Years 1959–2000 vs. years 1996–2005) in the average annual and summer discharges and volumes at the Lecco-Olginate
dam. (Source: own elaboration based on the “Consorzio dell’Adda”, 2006).
Yearly Average Average Summer Average Average average discharge volume average discharge volume (m3/s) (Mm3) (Jun–Aug) (m3/s) (Mm3) Years 1959–2000 140.65 4435.42 197.67 1571.27 Years 1996–2005 112.40 3544.23 149.88 1191.38
Water deficit −28.25 −891.19 −20.09% −47.79 −379.89 −24.18%
Table 4. Difference (Years 1959–2000 vs. years 1996–2005) in the average annual and summer discharges and volumes at the Fuentes
hydrometric station. (Source: own elaboration based on the “Consorzio dell’Adda”, 2006).
Yearly Average Average Summer Average Average average discharge volume average discharge volume (m3/s) (Mm3) (Jun–Aug) (m3/s) (Mm3) Years 1959–2000 88.14 2779.62 122.92 977.03 Years 1996–2005 88.66 2796.05 123.17 979.03
Water deficit +0.52 +16.43 +0.59% +0.25 +2.00 +0.20%
Table 5. Difference (Years 1959–2000 vs. years 1996–2005) in the
number and percentage of days with the hydrometric level of Como Lake below zero cm height. (Source: own elaboration based on the “Consorzio dell’Adda”, 2006).
Year Summer (Jun–Aug) days % days % Years 1959–2000 3572 23.30 191 4.42 Years 1996–2005 1621 44.39 171 18.59
Table 3 shows that these lower discharge values corre-spond to an average decrease of 891.19 million cubic me-tres per year (−20.09%) while a comparison focused on the summer months (June to August) shows an average deficit of 379.89 million cubic metres (−24.18%). In fact, water availability for human activities in the last decade were sig-nificantly reduced.
The trend shown in Fig. 3 is also confirmed by the analysis of the Como Lake input flows, measured in Fuentes hydro-metric station, at the bottom of the Valtellina (Fig. 4), where it is possible to identify the one-month delay of the autumnal positive peak. Nevertheless, the curves referring to the pe-riods 1959–2000 and 1996–2005 do not present significant differences during the summer period (June–August).
Table 4 shows that the discharges in the Fuentes hydro-metric station in the decade 1996–2005 are characterized by a slight increase; hence, the general water deficit measured at the Lecco-Olginate dam is not due to a reduced flow from the Valtellina. We suppose that a large part of the summer discharges from Fuentes comes from the snow and glacier
Fig. 4. Average ten-day aggregate discharges from the Fuentes
hy-drometric station. Period 1959–2000 vs. 1996–2005. (Source: own elaboration based on the Consorzio dell’Adda data, 2006).
melt. The overall input to Como Lake, is also influenced by its minor alpine and sub-alpine mainly torrential tributaries, whose summer dynamics are dependant on the distribution of the precipitations. A considerable reduction of precipitations in summer could be the origin of such variation between the inflow and the outflow measured in the Fuentes and Lecco-Olginate stations, respectively.
The analysis of the hydrometric levels of Como Lake for the periods 1959–2000 and 1996–2005 (Table 5) highlights a situation of water scarcity during the last decade. The in-crease of days with the hydrometric level below zero level is significant, especially during the summer period (June– August), with an increase from 4.42% to 18.45%.
As stated before, low hydrometric levels rise sanitary problems, serious shore instability and environmental con-sequences, and a general reduction in tourist attractiveness in the lake area.
P. Giacomelli et al.: Adapting water allocation management to drought scenarios 299
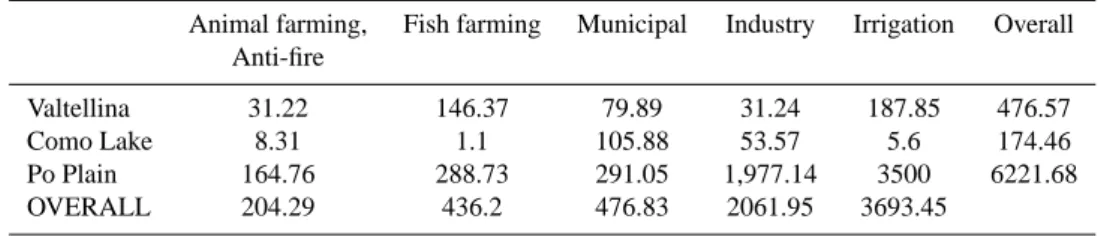
Table 6. Water rights divided by sub-areas and human activities in Mm3/yr. (Source: own elaboration based on the Lombardy Region, 2006).
Animal farming, Fish farming Municipal Industry Irrigation Overall Anti-fire Valtellina 31.22 146.37 79.89 31.24 187.85 476.57 Como Lake 8.31 1.1 105.88 53.57 5.6 174.46 Po Plain 164.76 288.73 291.05 1,977.14 3500 6221.68 OVERALL 204.29 436.2 476.83 2061.95 3693.45 5.2 Water demand
5.2.1 Static analysis of water demand: water rights vol-umes
The socioeconomic activities situated within the Adda River watershed generate a great overall water demand on the sup-ply system. The data in Table 6 show the volumes of water rights assigned by the Regional Water Authority on a munic-ipal scale for the different human activities, aggregated for the considered sub-areas (Lombardy Region, 2006). Water rights, presented in millions of cubic metres per year, can be considered as the heart of the water allocation system because they aggregate surface diversions, underground and spring water. They do not quantify actual volumes, since they are estimated and not directly measured. The Regional Water Authority is in charge of evaluating every request for water rights in order to be able to avoid a waste of resources and grant an equitable annual average amount of water, in pro-portion to the actual users’ needs. For instance, water rights for irrigation purposes are estimated combining the irrigated area extension, the crop types and the irrigation techniques employed. On the other hand, the amount of industrial water rights is estimated by the technical analysis of every produc-tive process that involves the use of water. The significance of water rights is to establish a maximum limit of water con-sumption allowed for each users; in fact, it cannot exceed the respective water rights limit and it can be far lower. The overall water rights volumes do not correspond to the actual amount of flowing water, since they may be employed sev-eral times by multiple users along the course of the river. Be-sides, since water rights describe an overall annual amount of the resource, they are not suitable for the analysis of the variation over time of the water demand. The water rights assigned for hydroelectric power production are not consid-ered in this study, since hydroelectricity production is a non-consumptive water use and at the same time does not alter the water quality.
Despite the aforementioned limitations, it was decided to consider and analyse the water rights data, since they are the only available ones detailed for each user on a munic-ipal scale. Nevertheless, even though in some cases they can overestimate the actual water demand levels, water rights volumes are able to provide a preliminary picture of the main
water-demanding human sectors of the areas considered and they guarantee a reasonable assessment for the analysis on a regional scale.
The greatest water demanding activities are industry and agriculture on the Po Plain: the overall amount of water rights represents 90% of the entire watershed. Municipal and fish farming uses are considerably significant too, especially in the Como Lake and Po Plain sub-areas. The overall an-nual water right for industry (2100 Mm3/yr) are calculated considering both the industrial activities and the thermoelec-tric power production. The volumes of water rights for these activities amount to 264.95 Mm3/yr and to 1797 Mm3/yr, re-spectively. The thermoelectric power plants, that use water for cooling purposes, are located on the Po Plain and they divert the water from an artificial channel of Adda River, e.g. Muzza (Lombardy Region, 2006).
5.2.2 Dynamic evaluation of water demand: identification of critical periods
The socioeconomic activities situated within the Adda River watershed generate a demand of water that is characterized by several fluctuations during the year, depending on the needs. While the water demand coming from manufacturing industries and thermoelectric power stations can be consid-ered constant, municipal and agricultural needs show signifi-cant variations throughout the year. Moreover, alpine hydro-electric dams retain and release water from the reservoirs, ac-cording to the market requirements, which means day/night and/or seasonal variations. The annual average volumetric data (water rights volumes) seem inadequate to describe such situations localized in time, since they may potentially arise during short periods of the year. Hence, the analysis of more detailed data, where available, is needed; they should be pro-vided with temporal information (on a monthly basis), in or-der to be able to focus on those critical months of the year, when the scarcity of water creates competition among the users.
The most critical period of the year for the water supply system is the summer. During this season, a dramatic in-crease in water demand leads to a shortage in the resource’s availability and the supply system has to face a situation of stress. The allocation balance among all the competing wa-ter users within the basin may therefore be constrained and
Table 7. Irrigated UAA and irrigation techniques of the Adda River
basin. Source: own elaboration based on ISTAT, 2001).
UAA Irrigation techniques UAA Irrigated Surface
UAA irrigation Flood Spray Drip ha 90 317 69 057 62 946 1247 4677 187 % 75.27% 90.81% 1.80% 6.75% 0.27%
in some cases this situation may lead to welfare losses and economic damage. We hereby describe the activities charac-terized by a significant variation in water demand throughout the year and draw a preliminary scheme of the oscillation in water demand.
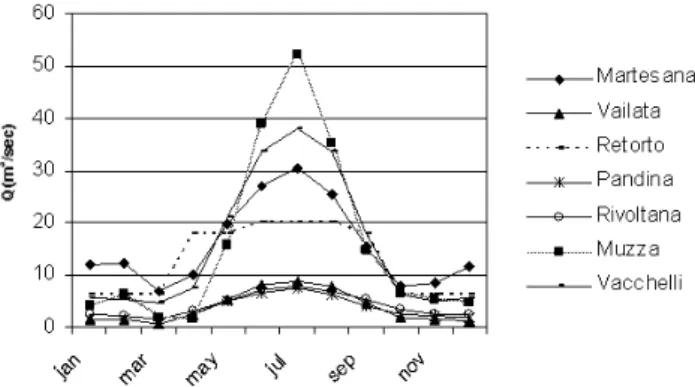
Agriculture is the most water-demanding productive sec-tor of the Po Plain, particularly in the summer. During the irrigation period (from June to August) it demands large amounts of water from the watershed supply system (Lom-bardy Region, 2003). Indeed, the 8 main river diversions, that bring water from the Adda River to the middle and lower Po Plain irrigation districts, significantly increase their overall average discharges. Figure 5 shows the trend of the overall measured amount of diverted water and its increase from 39.29 m3/s (winter season, from September to May) to 141.17 m3/s (+359.31%). The overall measured volume di-verted for irrigation purposes during the period from June to August amounts to 1122.16 Mm3, while the overall annual measured volume amounts to 2042.30 Mm3. The latter value is very different from the annual water rights value for irriga-tion on the Po Plain, which is estimated at around 3500 Mm3 (see Table 5). The measured values seem more reliable in providing a more accurate description of the irrigation ac-tivities demand, also because of their monthly measurement scale.
This is due to the extensive presence of surface irriga-tion that represents the main irrigairriga-tion technique employed within the Adda watershed (see Table 7). In surface irriga-tion, large amounts of water are brought to the fields and flow along the ground among the crops; it is a very cheap but very inefficient technique, as about 50% of the irrigation water is wasted and percolates to the groundwater table (Ribaudo, 2004).
During the same period, Como Lake and the Valtellina ar-eas receive a great number of tourists in their territory. These areas have high tourist accommodation facilities, either in hotels or other infrastructures, such as campsites and holi-day homes. The arrival and presence of tourists is very sig-nificant especially during July and August and during Jan-uary and FebrJan-uary. During the summer months, the overall floating population, received in Como Lake and the Valtel-lina tourist municipalities, is estimated at around 16% and 38% of the resident population, respectively. In both the Val-tellina and Como Lake areas, the majority of tourists stay
Fig. 5. Average monthly discharge of the Adda river diversions for
irrigation purposes. (Source: own elaboration based on the Lom-bardy Region data, 2006).
Fig. 6. Water demand of floating population, Como Lake. (Source:
own elaboration based on Lombardy Region data, 2006).
in holiday homes (79.04% and 81.96%, respectively) while the rest are hosted in hotel facilities. The peaks of these ar-rivals and presences are responsible for a significant increase in the municipal water demands for the urban water delivery aqueducts. Figures 6 and 7 show the peaks of the monthly average water demand due solely to the floating population’s water needs (in this case, the floating population is assumed to coincide with tourist flows). The amount of cubic metres have been calculated assuming an average daily water con-sumption of 200 litres for the holiday home tourist and of 530 litres for those accommodated in hotel structures (Lom-bardy Region, 2006). In fact, this latter higher value of daily consumption is obtained because it considers the water uses coming from the facilities provided by the hotels, such as swimming and thermal pools, gyms, restaurants and so on. The figures highlight the differences between tourism in the two areas. The distribution of tourist water consumption in the Valtellina shows two peaks corresponding to the summer and winter seasons while in the lake area it slightly increases in spring and reaches its maximum in July.
As stated above, hydroelectric power producers alter the river basin’s natural water cycles that during summer would expect a greater water input coming from the ice and snow melt. In this period, these activities retain large amounts
P. Giacomelli et al.: Adapting water allocation management to drought scenarios 301
of water in their reservoirs. The maximum capacity of the hydroelectric reservoirs in the Valtellina amounts to 419.10 Mm3. The hydroelectric companies modulate the ac-cumulation/release strategies considering both the natural cy-cles and energy demand peaks, with the aim of maximizing their overall income. Hence, they employ the water, accu-mulated during the snow melting periods, to guarantee an efficient hydroelectric production during autumn, when the electricity demand is higher. The effect of these activities is to turn a natural flow into an artificial stock and to hold it for future uses. Basically, it means that hydroelectric power pro-ducers increase their overall water demand during summer, when the resource is scarcer, and conflict with other users. The overall amount of water employed for the hydroelectric power production in the year 2006 amounted to 2489 million cubic metres (Sondrio Province, 2006). A temporal analy-sis of the accumulation/release cycles of hydroelectric reser-voirs is needed but it is difficult to be performed because of the confidential nature of this data.
5.3 Water supply and demand: a critical analysis
The analysis of static and dynamic features in supply and demand led to a schematization of the complex interrelation-ship between an environmental component and the socioeco-nomic system. The historical water abundance in this region gave rise to many human activities, whose production sys-tem has always been based on the water resource availabil-ity. The analysis of the available data, showed the presence of reduced water availability during the decade 1996–2005. In particular, the analysis of the hydrometric levels and Como Lake’s output discharges highlighted during the summer pe-riod, an exacerbation of water scarcity, while water demand is higher due to the presence of tourists and irrigation. Agri-culture is, probably, the most critical water-demanding hu-man activity in the study area. It needs large volumes of wa-ter, concentrated in a very short period. Moreover, because of its old delivery system of channels and diversions and the widespread use of the surface irrigation technique, its use can not be considered very efficient.
At this stage of the project, it is not possible to draw gen-eral hypothesis of management in scenarios of water scarcity. The agriculture has been identified as the most critical sec-tor in water demand dynamics; besides, its delivery and ir-rigation structures are old and its laws seem inadequate to regulate the current situation. 90.81% of the irrigated agri-culture areas employ the surface irrigation technique, which uses large amounts of water. The volumes of water used for a single irrigation event amount to 900 m3/ha (Ribaudo, 2004), the same quantity employed by the flood irrigation, the very water-demanding technique used for rice cultivation. A pre-liminary hypothesis aimed at reducing the agriculture water demand, should take into account the switch to more efficient irrigation techniques of part of the irrigated areas. Spray ir-rigation which employs 250 m3/ha (Ribaudo, 2004), enables
Fig. 7. Water demand of floating population, Valtellina. (Source:
own elaboration based on Lombardy Region data, 2006).
a saving of 650 m3/ha per single irrigation event. In the cur-rent situation, spray irrigation is only employed on 6.75% of the overall irrigated surface. In the hypothesis of switching a part of the area (e.g. 20%), which is at present irrigated by surface irrigation, the overall volume of water saved would amount to 8 182 980 m3per single irrigation event. Further investigation should allow a more accurate management hy-pothesis for agriculture techniques to be drawn and consider their impacts on the energy demand. Moreover, the analysis of different sectors could lead to other solutions and improve-ments.
6 Discussion and future development
All users within the hydrologic unit become increasingly in-terdependent as water becomes scarcer. That is, each use can affect the quantity or quality of water available to others and because ground and surface water supplies are likely to be naturally connected, use of water from one source affects the availability of water from the other (Frederick, 1997). There-fore, the allocation strategy of the river basin authority is ac-curately discussed and planned in response to the contingent situations. Nevertheless, in some cases, when the severity of the water deficit situations becomes critical, the regula-tion methods are not effective and the entire socioeconomic system is put under stress (Wood et al., 1997).
This paper presents the main features of water supply and demand in the Adda River basin, in order to produce a pre-liminary picture of the volumes involved over space and time. The presented results are the preliminary outcomes of a three-year project, whose final aim is to widen the knowl-edge of regional water dynamics and allocation systems. Cli-mate change must be considered in the analysis, as it rep-resents a new element that contributes to the overall uncer-tainty characterizing the system. The project will provide a multi-disciplinary instrument to highlight the weaknesses in the water allocation balance and to support the regulation processes. Interest in problems related to water management is increasing in public opinion; in fact, in 2007 Lombardy
Public Authority set the “Patto per l’acqua”, a round table where all the stakeholders, from both the scientific and polit-ical sides, are invited to discuss, share their knowledge and find solutions to enhance water regulation, not only in emer-gency periods, but also for ordinary decisions.
Acknowledgements. This research is carried out within the
frame-work of the RICLIC project, funded by Universit`a degli Studi di Milano Bicocca, Fondazione Lombardia per l’Ambiente (The Lombardy Environment Foundation) and the Regional Agency for Environmental Protection. This paper has been discussed by the authors: P. Giacomelli wrote the paragraphs 1, 2, 6, M. Brambilla wrote the paragraphs 3 and 4 and A. Rossetti wrote the paragraph 5. The authors are grateful to S. Fuchs, A. Pasuto and the two other anonymous reviewers for the helpful comments and suggestions on the manuscript.
Edited by: S. Fuchs, M. Br¨undl, R. Bernknopf, and T. Glade Reviewed by: P. Alessandro and two other anonymous referees
References
Bull, R.: Disaster Economics, Disaster Management Training Pro-gramme, United Nations Development ProPro-gramme, 1994. Consorzio dell’Adda: Gli effetti della regolazione sulle portate
dell’Adda e sulle piene del Lago di Como, 12, Milano, 2003. Consorzio dell’Adda: Hydrological daily data, http://www.laghi.
net/Adda/index.asp?Disp=idrometro, last accessed 18 July 2007, 2006.
EEA:.. European Environmental Agency. Climate change and water adaptation issues, EEA Technical report 2/2007, 2007a. EEA: European Environmental Agency. Climate change: the cost
of inaction and the cost of adaptation, EEA Technical report 13/2007, 2007b.
Frederick, K. D.: Adapting to climate impacts on the supply and demand for water, Clim. Change, 37, 141–156, 1997.
Giacomelli, P.: Economic evaluation of risk. The case of a mountain area, Aracne ed., Roma, 2005.
ISTAT: Italian census database, http://www.istat.it/censimenti/ popolazione/, last accessed 15 September 2007, 2001.
Lombardy Region: Direzione Generale Reti e Servizi di Pubblica Utilit`a, Programma di tutela e uso delle acque, Sometti, Mantova, 2006.
Lombardy Region: Direzione Generale Agricoltura. Atlante della bonifica e dell’irrigazione, Sometti, Mantova, 2003.
MED Joint Process WFD/EUWI: Water scarcity management in the context of WFD, Chapter I, p. 16, 2006.
NDMC: National Drought Mitigation Centre. Understanding and defining drought, http://drought.unl.edu/whatis/concept.htm, last accessed 16 July 2007, 2006.
Pearce, D.: Valuing risks in Calow P. eds handbook of environmen-tal risk assessment and management, Blackwell Science, Oxford, UK, p. 345–378, 1998.
Petit, M.: Pressures on water resources: challenges for the agri-culture, International conference “Water and irrigation develop-ment”, Cremona (Italy), 2001.
Polelli, M.: Nuovo trattato di estimo, edited by: Rimini, M., 2006. Purchase, I. F. H.: Risk assessment. Principles and consequences,
Pure Appl. Chem., 2(6), 1051–1056, 2000.
Ribaudo, F.: Prontuario di agricoltura per il geometra, il perito agrario e l’agrotecnico, Edagricole Bologna, 2004.
Sondrio Province: Volumi d’acqua turbinati dagli utenti idroelet-trici, Settore lavori pubblici, pianificazione territoriale ed ener-gia, Servizio acque ed enerener-gia, 2006.
Starmer, C. V.: The Economics of Risk, in: The handbook of en-vironmental risk assessment and management, edited by: Calow, P., Blackwell Science, Oxford, UK, p. 319–344, 1998.
Sterlacchini, S., Frigerio, S., Giacomelli, P., and Brambilla, M.: Landslide risk analysis: a multi-disciplinary methodological ap-proach, Nat. Hazards Earth Syst. Sci., 7, 657–675, 2007, http://www.nat-hazards-earth-syst-sci.net/7/657/2007/.
UNIONCAMERE: Regional Statistical Yearbook of Lombardy, http://www.ring.lombardia.it/asrnewe/index.html, last accessed 25 September 2007, 2005.
Wood, A. W., Lettenmaier, D. P., and Palmer, R. N.: Assessing climate change implications for water resources planning, Clim. Change, 37, 203–228, 1997.