Research Article
Nutrient transfer from soil to surface waters:
Differences between nitrate and phosphate
René Gächter1,*, Sandra M. Steingruber2, Miriam Reinhardt1and Bernhard Wehrli1
1 Swiss Federal Institute for Environmental Science and Technology (EAWAG), Limnological Research Center,
CH-6047 Kastanienbaum, Switzerland
2 Dipartimento del territorio, Divisione dell’ambiente, Sezione della protezione dell’aria, dell’acqua e del suolo,
Ufficio della protezione e della depurazione delle acque, via C. Salvioni 2a, CH-6500 Bellinzona, Switzerland Received: 29 March 2003; revised manuscript accepted: 18 September 2003
Abstract. Nitrate (NO3–) and soluble reactive
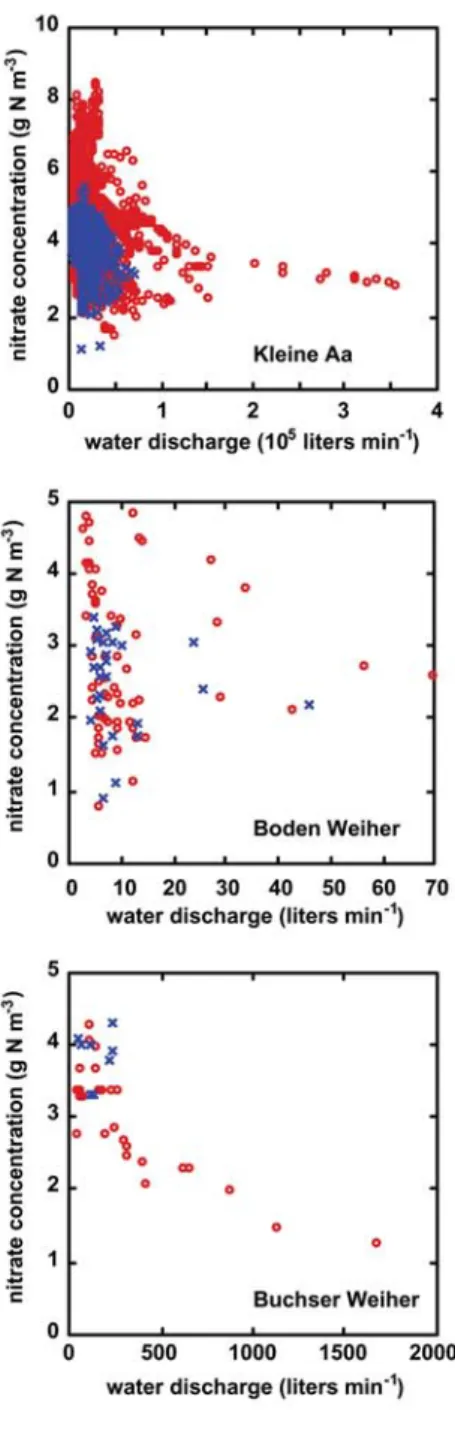
phospho-rus (SRP), the two major dissolved N and P species avail-able to aquatic biota, respond differently to varying water discharge rates (Q) in agricultural drainage pipes and rivers (Fig. 1): SRP concentrations are positively related to Q, whereas NO3–concentrations decrease with
increas-ing discharge rates. In addition, NO3-N concentrations
exceed (in mass units) SRP concentrations up to 700-fold even though the liquid manure applied to agricultural fields has a N : P ratio equal to only about 5. Preferential flow of rainwater across the soil column and different affinities of the two nutrients for the soil matrix explain these differences in behaviour and mobility:
DOI 10.1007/s00027-003-0661-x © EAWAG, Dübendorf, 2004
i. Concentrations of substances that have a high sorp-tion affinity for the soil matrix (such as SRP) tend to increase in drainage pipes and streams as water dis-charge increases.
ii. Concentrations of species that are not retarded by sorption processes (such as NO3–) and, hence, do not
accumulate in the topsoil, tend to be negatively re-lated to discharge rate.
Differences in the availability and pool size of NO3–and SRP
in the topsoil explain the different hysteresis patterns if NO3–
and SRP concentrations are plotted versus the correspond-ing discharge rate durcorrespond-ing precipitation events (Fig. 2).
Key words. Phosphorus; nitrogen; drainage; agriculture; eutrophication.
Introduction
Nitrogen (N) and phosphorus (P) are the two major nutri-ents controlling productivity of freshwater ecosystems (Elser et al., 1990). Due to advanced wastewater treat-ment and the banning of polyphosphates in detergents, soluble reactive phosphorus (SRP) concentrations have decreased substantially in most surface waters in central Europe during the past decades (Gächter and Wehrli, 1998; Zimmermann, 1999). Today, fertilized soils are the most important source of the remaining P load (Foy and
Withers,1995; Stadelmann et al., 2002) and, in many cases, prevent complete restoration of eutrophic lakes.
Contrary to P, NO3–concentrations are still increasing
or remain at elevated concentrations in Swiss surface wa-ters (Zobrist et al., 1990). Intensified application of N fer-tilizer, increasing atmospheric N deposition (originating from combustion processes), and lower denitrification in less productive lakes (due to decreased P load) (Höhener and Gächter, 1993; Mengis et al., 1997; Steingruber, 2001) and rivers less polluted with organic wastes may have contributed to this development.
In many groundwater wells, NO3–concentrations
tem-porarily exceed the drinking water limit of 40 mg NO3–L–1
(EEA, 1998; Zobrist et al., 1990) and elevated N loading contributes to eutrophication of marine coastal areas
*Corresponding author phone: +41 41 340 13 41; e-mail: [email protected]
(Nixon et al., 1996; Tyrrell, 1999). Furthermore, NO2–
(> 0.02 mg NO2–-N liter– 1) and NH3(> 0.02 mg NH3-N
liter–1) are toxic to fish (Müller, 1990) and out-gassing
N2O, an intermediate product of nitrification and
denitri-fication, contributes to the global warming and the de-composition of the ozone layer. For these reasons the Eu-ropean Countries participating in the Rhine Action Plan agreed to decrease the N discharge into the Rhine River by 50 % (BUWAL, 1993). In agrarian regions of Switzer-land with mainly arable Switzer-land and grassSwitzer-land, approxi-mately 50 to 60 % of the aquatic N (2000 to 4000 kg km–1
yr–1) originates from agricultural soils, 20 % from
waste-water treatment plants, 20 % from natural sources and 5 % from combustion processes.
Since soils are important sources for aquatic N and P, and both nutrients are of concern for freshwater as well as marine ecosystems, this study examines three agricul-tural drainage systems as examples of the soil/water boundary and compares results with those obtained from intensive river monitoring (Gächter et al., 1996). It fur-ther relates concentrations of NO3–and SRP to water
dis-charge rates (Q) and explains differences in behavior and mobility of the two nutrient species by their different sorption affinity to the soil matrix.
Study sites and methods
Sites
The three investigated drainage systems discharge into the Buchser Weiher, the Boden Weiher and into the river Kleine Aa in Sempach (Table 1) and are located in the Central Swiss Plateau. They drain mainly grassland and some cropland (cereals, rape, corn) and the average an-nual precipitation at all sites equals about 1200 mm year– 1.
The river Kleine Aa drains a sub-catchment (6.9 km2)
at the northeastern end of Lake Sempach, situated at an elevation between 505 and 670 m, with 87 % (5.4 km2) of
the watershed used as farmland. Most of the area is cul-tivated as grassland, where intensive dairy farming and
pig production prevail (average livestock density is 3.1 dairy-cow equivalents ha–1). The grassland is mowed up
to seven times during the growing season and liquid ma-nure is applied frequently after each cut (Gächter et al., 1998).
Sampling and chemical analysis
At the Buchser Weiher site, the water discharge of the drainage pipe was monitored with a calibrated triangular weir (“V” angle 90°, height 21 cm) combined with a limnigraph (instrument recording the water level behind the weir). Forty-one spot samples were collected at about bi-weekly intervals and at a higher sampling frequency during two rainy periods in May 1999.
At the Boden Weiher and Sempach sites, drainage wa-ter discharge was measured electronically with a mag-netic inductive flow meter (PROline promag 50/ 53 W). Spot samples were collected every second day at the Bo-den Weiher site and at a frequency of 0.3 to 1 h–1at the
Sempach site.
Water discharge of the river Kleine Aa was monitored at a calibrated station equipped with a limnigraph. At this site NO3–and SRP concentrations were determined
on-line (every 35 min) with a Flow Injection Analyzer (FIA) as described by Gächter et al., (1996).
Standard methods were applied for SRP (molybdate method: DEV, 1996) and NO3– (salicylic acid method:
DEV, 1996) analyses. At the site Buchser Weiher, NO3–
was measured as NO2–with a Procon Auto Analyser after
reduction of NO3–to NO2–on a cadmium column (DEV,
1996) from May to June 1999.
Results and discussion
At all sites, N and P had been applied to the grassland soil as liquid manure at an annual rate of about 233 kg N ha–1
yr– 1and 47 kg P ha–1yr– 1(Gächter et al., 1996).
Precipi-tation and microbiological N fixation probably add about 30 kg N ha–1yr– 1 and 1 kg P ha yr– 1 (Krummenacher
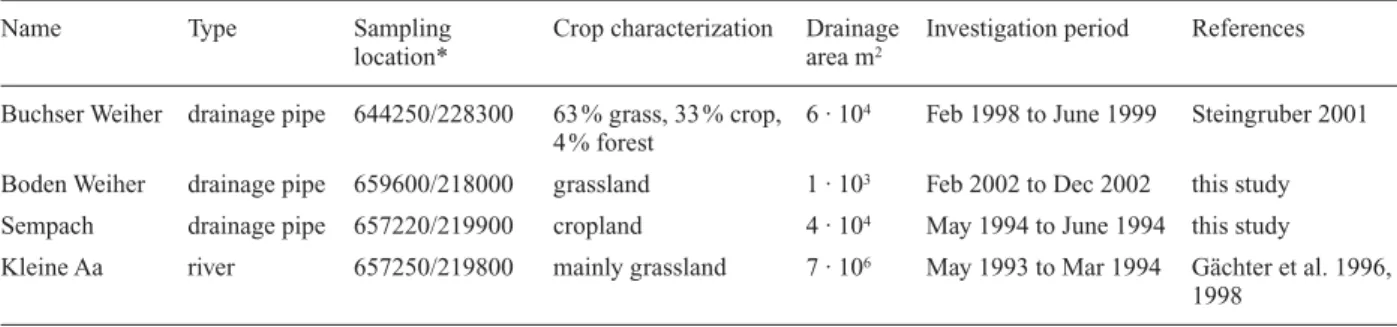
Table 1. Location and brief description of investigated systems.
Name Type Sampling Crop characterization Drainage Investigation period References
location* area m2
Buchser Weiher drainage pipe 644250/228300 63 % grass, 33 % crop, 6 · 104 Feb 1998 to June 1999 Steingruber 2001 4 % forest
Boden Weiher drainage pipe 659600/218000 grassland 1 · 103 Feb 2002 to Dec 2002 this study Sempach drainage pipe 657220/219900 cropland 4 · 104 May 1994 to June 1994 this study
Kleine Aa river 657250/219800 mainly grassland 7 · 106 May 1993 to Mar 1994 Gächter et al. 1996, 1998
1976) and 65 kg N ha–1yr– 1 (Gächter et al., 1996),
re-spectively, resulting in total deposition rates of 328 kg N ha–1yr– 1 and 48 kg P ha–1yr– 1. Most of this supply is
taken up by the crop and harvested (200 kg N ha–1yr– 1
and 30 kg P ha–1yr– 1). The surplus either accumulates in
the soil, is lost to groundwater and surface waters or es-capes to the atmosphere as NH3 , N2O and/or N2 .
NO3–and SRP concentrations responded consistently
different at each site when drainage water discharge rates varied (Fig. 1). SRP concentrations were positively re-lated to water discharge, whereas NO3–concentrations
de-creased with increasing discharge rates. Nevertheless, av-erage NO3–concentrations (in mass units) exceeded
aver-age SRP concentrations (in mass units) 27-fold and 680-fold at the Boden Weiher and the Buchser Weiher sites, respectively (At the site Sempach, NO3– was not
measured). Since in the supplied liquid manure the N : P ratio equals only about 5 (Gächter et al., 1996), the strongly elevated ratio in the drainage water indicates that the combined soil/crop system retains P much more effi-ciently than N. Reported annual loss rates to the surface water account for up to 20% and 3% of the deposited N and P fertilizer, respectively (Gächter et al., 1996).
In addition to the dependence on water discharge, Fig-ure 1 indicates lower NO3–and SRP concentrations during
winter than during summer at equal water discharge rates in the river Kleine Aa. The sampled drainage pipes Boden Weiher and Buchser Weiher revealed much lower sonal variability. This observation suggests that the sea-sonal differences observed in the river Kleine Aa were not only due to the absence of manure application to the soil in winter but also to a higher ground-water: drainage-wa-ter ratio during the typically drier windrainage-wa-ter months. An in-crease of this ratio causes the SRP concentration of the river water to decrease because of the usually lower SRP concentration in the groundwater rather than in the drainage water. Furthermore, during winter, the missing NH4
+
application to the soil in combination with reduced nitrification rates explain the somewhat lower NO3
–
con-centrations in the groundwater dominated river.
Due to the prohibition of spreading liquid manure from November 1 to the end of February, farms with a small storage capacity are forced to empty partly their tanks just prior to or at the end of this period. Due to low temperature and irradiation, however the ability of plants to take up these nutrients is very limited. Thus, it seems logical that in two drainage pipes as well as in the river Kleine Aa the highest SRP concentrations (apparent high value outliners in Fig. 1) were observed just after the be-ginning and the very end of the mentioned period.
In the initial phase of rain events, SRP concentrations in the Kleine Aa remained consistently low until the dis-charge had passed its maximum. Then they quickly in-creased to maximum values and slowly dein-creased again approximately in proportion to the decreasing water
dis-charge rate (Fig. 2). In addition to the mentioned season-ally variable ground-water: drainage-water ratio, this short-term hysteresis also contributes considerably to the observed scatter of data if SRP or NO3–concentrations are
plotted versus water discharge rates (Fig. 1).
As shown by Gächter et al. (1998), in relatively im-permeable soils that developed from glacial till (Würm glaciation) and Molasse, about equal fractions (35%) of the annual precipitation trickle slowly through the bio-geochemically active soil matrix or bypass it quickly along macropores. During dry weather periods, drainage pipes and the river collect only groundwater. During rain, part of the discharge (the interflow) is generated in the topsoil and conducted quickly to the drainage pipes or river with little further chemical alteration. If the qualities of the groundwater and the interflow generated in the top-soil differ, the resulting river water quality depends on the concentration and quantity of both sources and, hence, on total discharge.
The high affinity of SRP for the soil matrix is well es-tablished (e. g., Scheffer et al., 1992). Most of the SRP ap-plied to the soil accumulates in the topsoil and little reaches the groundwater as the water slowly trickles through the soil matrix. Since this abiotic SRP sorption is reversible, desorption sustains elevated SRP concentra-tions in the topsoil pore water as long as the rate of des-orption equals or exceeds the flushing or dilution rate of the soil porewater by rainwater. As Gächter et al. (1998) and Stamm et al. (1998) have demonstrated, vertical macropores bypassing the soil matrix can drain this SRP enriched interflow from the topsoil layer to the aquifer or drainage pipes within minutes to hours. Hence, during rainy weather, drainage water represents a variable mix-ture of “old” groundwater and interflow. Since desorption velocity of SRP from the soil matrix to the aqueous phase is limited, the SRP concentration of the interflow depends on the residence time of the water in the topsoil. It re-mains relatively low on the rising limb of the hydrograph when the flushing rate of the soil pores is large and, hence, the residence time of the rainwater in the topsoil is short. However, as soon as precipitation and, accordingly, continuous dilution of topsoil pore-water stops, the SRP concentration of the interflow increases. As a conse-quence, SRP concentration in the river water suddenly in-creases when the drainage water discharge begins to de-crease and it gradually dede-creases about in proportion to the total flow rate as the drainage and interflow discharge decreases and groundwater flow becomes gradually more important (Fig. 2). Spot sampling at a low frequency would not reveal this hysteresis behaviour but result in an unexplained large random scattering if SRP concentra-tions were plotted versus the corresponding discharge rate (Fig. 1).
In contrast to SRP, NO3–is not retained in the solid soil
Figure 1. NO3–and SRP concentrations as a function of discharge rates in three drainage pipe effluents and in the river Kleine Aa. (In the effluent of the drainage pipe “Sempach” NO3–was not measured). Red circles represent data obtained from March 1 to October 31. Blue crosses represent data obtained from November 1 to February 28.
bulk volume and, in general, are not water saturated. Thus, the topsoil cannot sustain elevated NO3–
concentra-tion when its pores are flushed with rainwater low in NO3–. Typical rainwater concentrations (0.3 mg NO3–-N
L–1) are about ten times lower than typical groundwater
concentrations (3 to 5 mg NO3–-N L–1). Therefore, as long
as macropores drain topsoil-generated interflow, NO3–
concentrations will be more or less inversely related to the total discharge of drainage pipes or rivers. However, as shown in Figure 2, NO3–concentrations recover after
the interflow ceases and groundwater flow starts to dom-inate the total discharge again. Therefore, the relationship between NO3–concentration and discharge is also a
hys-teresis, but with a different pattern than the SRP hystere-sis.
It is probable that NO3–concentrations as well as the
mobility of SRP are highly variable in the topsoil, de-pending on the timing of the last manure application, the intensity of biogeochemical reactions (e. g., nitrification), and the recent nutrient uptake by crop plants. This vari-ability also affects the quality of the water supplied to the aquifer, which is further modified by the pathways the water selects across the soil column. These pathways can include matrix flow accompanied by SRP sorption to the soil matrix in deeper layers and microbial production (ni-trification) or consumption (deni(ni-trification) of NO3–, or
fast flow along preferential flow paths that are biogeo-chemically nearly inert. This explains why NO3–and SRP
concentrations are highly variable in the topsoil water as well as in the groundwater and, consequently, in any mix-ture of the two components (Fig. 1).
In summary, macropores draining pore water from the topsoil to drainage pipes or rivers affect their water qual-ity, depending on the physical-chemical properties of the
considered substance. Substances that are retarded by sorption (e. g., SRP) tend to be positively related to the discharge rate as long as the soil matrix is not yet com-pletely saturated from the topsoil down to the aquifer. However, limited desorption velocity from the soil matrix causes hysteresis, with lower SRP concentrations occur-ring on the rising limb of the hydrograph. The resulting large scattering partly masks the postulated positive [P]/Q relationship. In contrast, substances that are not re-tarded by sorption processes (e. g., NO3–) and, hence, do
not accumulate in the topsoil tend to be negatively related to the discharge rate.
Acknowledgment
Dan McGinnis, Joseph S. Meyer, Beat Müller, Karen Umbach and Jürg Zobrist read and amended the manu-script. The constructive comments of an anonymous ref-eree to an earlier version of the manuscript are acknowl-edged.
References
Bundesamt für Umwelt, Wald und Landschaft (BUWAL) Bern. 1993. Der Stickstoffhaushalt in der Schweiz. Konsequenzen für Gewässerschutz und Umweltentwicklung, Schriftenreihe Umwelt 209: 1–74.
Deutsche Einheitsverfahren zur Wasseruntersuchung (DEV) 1996. Band 2, Weikheim
Elser, J. J., E. R. Marzolof and C. R. Goldman, 1990. Phosphorus and nitrogen limitation of phytoplankton in the freshwaters of North America: A review and critique of experimental enrich-ments. Can. J. Fish. Aquat. Sci. 47: 1468–1477.
European Environment Agency (EEA), 1998. Groundwater Quality and Quantity. Copenhagen, Denmark. p. 35–39.
Figure 2. Examples of SRP/Q and NO3–/Q hysteresis during a rainy period (May 1 1993 20 : 33 to May 2 1993 17 : 00) in the river Kleine Aa.
Foy, R. H. and P. J. A. Withers, 1995. The contribution of agricul-tural phosphorus to eutrophication. Proc. Fert. Soc. 365: 32. Gächter, R. and B. Wehrli, 1998. Ten years of artificial mixing and
oxygenation: No effect on the internal P loading of two lakes. Environ. Sci. Technol. 32: 3659–3665.
Gächter, R., A. Mares, C. Stamm, U. Kunze and J. Blum, 1996. Dünger düngt Sempachersee. Agrarforschung 3: 329–332. Gächter, R., J. M. Ngatiah and C. Stamm, 1998. Transport of
phos-phate from soil to surface waters by preferential flow. Environ. Sci. Technol. 32: 1865–1869.
Höhener, P. and R. Gächter, 1994. Nitrogen cycling across the sed-iment-water interface in a eutrophic, artificially oxygenated lake. Aquat. Sci. 56: 115–132.
Krummenacher, T., 1976. Die Nährstoffbilanz des Alpnachersees. Ph. D. Thesis No. 5689, Eidgenössische Technische Hoch-schule (ETH), Zurich.
Mengis M., R. Gächter, B. Wehrli and S. Bernasconi, 1997. Nitro-gen elimination in two eutrophic lakes. Limnol. Oceanogr. 42:1530–1543.
Müller, R., 1990. Stickstoff-Toxizität für Fische und herzuleitende Grenzwerte. EAWAG-News 30: 33–36.
Nixon, S. W., J. W. Ammerman, L. P. Atkinson, V. M. Berounsky, G. Billen, W. C. Boicourt, W. R. Boynton, T. M. Church, D. M. Di Toro, R. Elmgren, J. H. Garber, A. E. Giblin, R. A. Jahnke, N.
J. P. Owens, M. E. Q. Pilson and S. P. Seitzinger, 1996. The fate of nitrogen and phosphorus at the land sea margin of the North Atlantic Ocean. Biogeochemistry 35: 141–180.
Scheffer, F., P. Schachtschabel, H.-P. Blume, G. Brümmer, K.-H. Hartge, U. Schwertmann, W. R. Fischer, M. Renger and O. Strebel, 1992. Lehrbuch der Bodenkunde. Enke, Stuttgart. 491 pp.
Stadelmann, P., R. Lovas and E. Butscher, 2002. 20 Jahre Sanierung und Überwachung des Baldeggersees. Mittg. Natw. Ges. Luzern 37: 115–164.
Stamm, C., H. Flühler, R. Gächter and J. Leuenberger, 1998. Pref-erential Transport of Phosphorus in Drained Grassland Soils. J. Environ. Qual. 27: 515–522.
Steingruber, S. M., 2001. Nutrient transformations in a wetland pond. Ph. D. Thesis. No. 13939. Eidgenössische Technische Hochschule (ETH), Zurich.
Tyrrell, T., 1999. The relative influences of nitrogen and phospho-rus on oceanic primary production. Nature 400: 525–531. Zimmermann, U., 1999. Die planktische Primärproduktion der
trophischen Erholungsphase des Zürich- und des Walensees. Schweiz. Verein des Gas- und Wasserfaches 1: 29–33. Zobrist, J., H. Bührer and J. S. Davis, 1990. Zeitliche Entwicklung
des Stickstoffs in den Schweizerischen Gewässern. Mitteilun-gen der EAWAG 30: 14–18.