MUSCULOSKELETAL
Synovitis maps for the assessment of inflammatory diseases
of the hand
Christoph Karlo&Marco Zanetti&Paul Stolzmann&
Isabelle Steurer-Dober&Florian Brunner&
Jürg Hodler&Christian W. A. Pfirrmann
Received: 20 October 2010 / Revised: 22 December 2010 / Accepted: 11 January 2011 / Published online: 14 February 2011 # European Society of Radiology 2011
Abstract
Objectives To compare accuracy and review times of FLASH-MRI-derived synovitis maps (SM) with conven-tional MR images (cMRI) in the assessment of articular synovitis and tenosynovitis of the hand.
Methods 80 hands in 40 patients (mean age, 48 years; range, 15–72 years) were assessed for synovitis on cMRI and SM by two readers independently. Reporting times and diagnostic confidence (scale: 1=least, 5=most confident) were measured. Results from an assessment of a panel of senior musculoskeletal radiologists served as the standard of reference.
Results Sensitivity and specificity for the detection of articular synovitis were 0.91/1.00 (R1) and 1.00/0.67 (R2) on cMRI and 0.87/0.75 (R1) and 0.91/0.45 (R2) on SM and for the detection of tenosynovitis 0.95/0.63 (R1) and 0.67/ 0.79 (R2) on cMRI and 0.67/0.89 (R1) and 0.38/1.00 (R2) on
SM. Mean review times (cMRI/SM, sec) were 142/37 (R1) and 167/25 (R2). Mean diagnostic confidence (cMRI/SM) was 3.7/3.4 (R1) and 3.2/3.5 (R2) for articular synovitis and 4.0/4.0 (R1), 3.3/3.7 (R2) for tenosynovitis.
Conclusion Synovitis maps provide a comparable diagnostic accuracy to conventional MR images in the assessment of articular synovitis and tenosynovitis of the hand. Because of short review times, synovitis maps provide a fast overview of locations with synovial enhancement.
Keywords Synovitis maps . FLASH . MRI . Tenosynovitis . Tram line
Introduction
For the initial imaging assessment of inflammatory diseases of the hand, conventional radiography is still considered the
first choice [1]. Radiography is readily available, easily
reproducible, and allows easy and fast serial comparison for assessment of disease progression. Although ultrasound has been reported to be a valuable imaging tool in the
assessment of articular synovitis and tenosynovitis [2],
magnetic resonance (MR) imaging has gained more importance. Besides the detailed evaluation of articular synovitis and tenosynovitis, MR also allows for earlier
detection of erosions [3,4].
Although the interpretation of conventional radiographs
and MR examinations is the radiologists’ daily business,
sub-specialised clinicians, particularly in dedicated hospitals such as orthopaedic centres, have been increasingly exposed to digital radiological image data since the invention and subsequent implementation of picture archive and communi-cation systems (PACS) in the early 1990s. However, contrary M. Zanetti
:
P. Stolzmann:
I. Steurer-Dober:
J. Hodler:
C. W. A. Pfirrmann
Department of Radiology, University Hospital Balgrist, Zurich, Switzerland
C. Karlo
:
I. Steurer-DoberDepartment of Radiology, Kantonsspital Luzern, Luzern, Switzerland
F. Brunner
Department of Rheumatology, University Hospital Balgrist, Zurich, Switzerland
C. Karlo (*)
Department of Radiology, University Hospital Zurich, Rämistrasse 100,
8091 Zurich, Switzerland e-mail: [email protected] DOI 10.1007/s00330-011-2078-6
to conventional radiographs, the interpretation of MR exami-nations with hundreds of images may be time-consuming for clinicians. Especially for the interpretation of follow up examinations an efficient method to present the data would be valuable. Advanced post-processing techniques such as volume measurement of synovitis or dynamic enhancement curves have been implemented to facilitate the assessment of
disease progress or monitoring treatment response [5–7]. In
the field of cardiovascular imaging [8] or abdominal imaging
[9], advanced visualisation techniques such as
three-dimensional volume-rendering technique (VRT) or maximum intensity projections (MIPs) are used to manage the large number of images. In a similar way we calculate synovitis maps to display the sites with increased enhancement due to synovitis of the hand and wrist on a single image. Synovitis maps are maximum intensity projections derived from a FLASH (fast low angle shot) MR sequence of the hand after intravenous (i.v.) gadolinium administration.
The purpose of this study was to compare accuracy and review times of synovitis maps derived from a 3D-fast low angle shot (FLASH) MR sequence with conventional MR images in the assessment of articular synovitis and tenosynovitis of the hand.
Materials and methods
Between June 2007 and November 2008, 40 consecutive patients (mean age, 48 years; range, 15–72 years; 14 male, 26 female) were retrospectively included in this study. All patients had been referred to our institution by the rheumatology department in our hospital for contrast-enhanced MR examinations of their hands to assess for suspected inflammatory disorders of joints and tendon sheaths.
The review board waived the need for further approval for a retrospective study. All patients or their legal guardians gave
their written consent for their data to be used for scientific purposes.
All examinations were performed on a 1.5 Tesla MR scanner (Avanto and Espree, Siemens Medical, Forchheim, Germany). For all examinations, the patients were posi-tioned supine and hands first on the imaging table. In the centre of an 8-channel extremity coil, the palms of both hands were taped together (“praying hands”) with only a thin layer of felt separating them from each other. The right hand was marked with two little silicone balls at the tip of the third finger and over the third metacarpophalangeal joint to prevent right and left mix-up during image analysis. Ten millilitres of gadobutrol (Gd-BT-DO3A, Gadovist, Bayer Schering Pharma AG, Berlin, Germany) were administered via an antecubital vein at a flow rate of 1 ml/sec followed by a 40 ml bolus of sterile saline solution
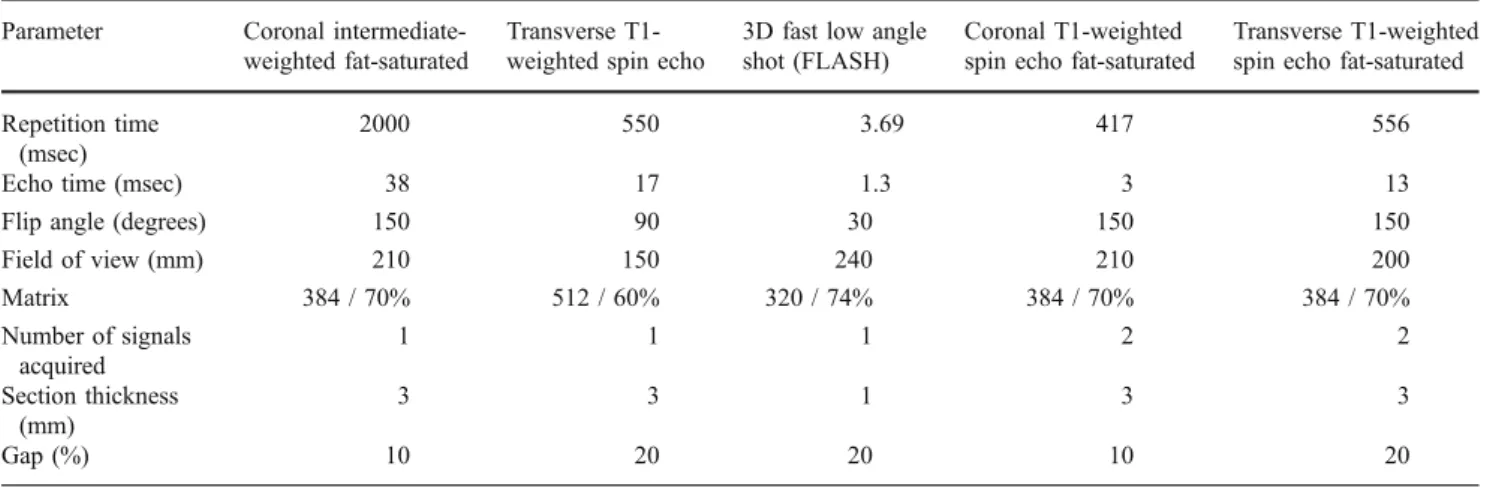
applied at a flow rate of 2 ml/sec. Table 1 illustrates the
detailed imaging parameters of our standard, institutional MR protocol including the FLASH sequence used to calculate the synovitis maps. The standard MR protocol included a coronal, intermediate-weighted, fat-saturated sequence consisting of one measurement for each hand and a transverse, T1-weighted spin echo sequence consist-ing of two measurements (for the proximal and distal halves of both hands). The first FLASH sequence for both hands consisted of five measurements: The first measurement was performed before the application of contrast agent for subsequent image subtraction during image reconstruction. After this first measurement, 10 ml of gadobutrol were administered, and after a delay of 25 s the next four measurements were performed without delays between sequence acquisitions. Subsequently, a coronal, T1-weighted, fat-saturated spin echo sequence after contrast medium application consisting of one measurement for each hand was acquired followed by a second FLASH sequence consisting of three consecutive measurements without delays between them for both hands together. A
Table 1 MR imaging parameters by sequence Parameter Coronal
intermediate-weighted fat-saturated
Transverse T1-weighted spin echo
3D fast low angle shot (FLASH)
Coronal T1-weighted spin echo fat-saturated
Transverse T1-weighted spin echo fat-saturated Repetition time
(msec)
2000 550 3.69 417 556
Echo time (msec) 38 17 1.3 3 13
Flip angle (degrees) 150 90 30 150 150
Field of view (mm) 210 150 240 210 200 Matrix 384 / 70% 512 / 60% 320 / 74% 384 / 70% 384 / 70% Number of signals acquired 1 1 1 2 2 Section thickness (mm) 3 3 1 3 3 Gap (%) 10 20 20 10 20
transverse, T1-weighted, fat-saturated spin echo sequence after contrast medium application consisting of one mea-surement for both hands together was the final sequence of the examination.
For the calculation of synovitis maps the 3D-FLASH sequences were subtracted from the base-line images. Five synovitis maps (MIPs) were reconstructed corresponding to the five initial measurements representing the early contrast-enhanced phases, separately for each hand. For the late phase, three synovitis maps were reconstructed corresponding to the three measurements in the late contrast-enhanced phase, separately for each hand. Imaging examples are shown in
Figs.1 and2. The imaging time for the whole examination
was 15–20 min; the imaging time for the FLASH sequences was 2–3 min for the early phase and 1–2 min for the late phase. After image reconstruction and post-processing, all image data were archived into the hospital’s PACS. All image reconstruction was performed by the same radiological-technical staff who performed all the MR examinations in this study. The total time needed for synovitis map reconstruction was between 3 and 5 min. No additional staff were needed for this study.
Image analysis
For image analysis, we transferred all image data to an open source Dicom viewing and post-processing software (OsiriX) on a separate work station (MacPro, Apple, Cupertino, CA, USA), where a radiologist not involved in image analysis anonymised all examinations. The cross-sectional MR images and the synovitis maps were stored in separate folders. Two readers performed all image analysis
and were blinded to each other’s results and to the results of a
panel of senior staff musculoskeletal radiologists (AA, 16 years’ experience; BB, 11 years’ experience), whose consensus image analysis using all imaging and clinical information served as the standard of reference. Reader 1 was a fellowship-trained musculoskeletal radiologist (R1, 5 years’ cross-sectional image interpretation experience), reader 2 a staff member of the rheumatology department (R2, not involved in radiological routine reporting, no formal training in cross-sectional image interpretation but with practical experience in outpatient clinics and therapy planning in close collaboration with the radiology department).
In a first image analysis session, both readers had access to the synovitis maps only; in the second image analysis session only the cross-sectional MR images were available. No other clinical or image information was available during all sessions. Both readers independently assessed all following locations for synovitis: the distal radioulnar joint, the radiocarpal joint, the midcarpal joint, the
carpometa-carpal joints, the metacarpophalangeal joints I–V, the
interphalangeal joint I, the proximal interphalangeal joints II–V and the distal interphalangeal joints II–V, the tendon sheath of the extensor carpi ulnaris tendon, the carpal tendon sheath region and the phalangeal tendon sheaths I–V. A quick shot diagnosis had to be stated by both readers upon the synovitis maps within a few seconds before starting with the first analysis session to either rule out or diagnose the presence of articular synovitis or tenosynovitis.
A radiologist not involved in image analysis measured all reporting times in both image analysis sessions for both readers. The diagnostic confidence was graded separately by both readers for the assessment of articular synovitis and tenosynovitis in all image analysis sessions on a visual analogue scale from 1 to 5, with 1 the least and 5 the most confident. A radiologist not involved in image analysis graded the results of both readers and compared them with the results of the panel.
Statistical analysis
All statistical analyses were performed using commercially available software (SPSS, release 17.0, Chicago, IL, USA). To account for the clustered nature of the data (i.e. the fact that there were neither 1440 independent joints nor 560 independent tendon sheaths but instead clusters of joints and tendon sheaths in 40 patients), a generalised estimating equation was applied for data evaluation. The sample size was determined on joint-based analyses of accuracy. Assuming 36 joints per patient, a z-test with a 0.05 two-sided significance level will have >75% (76.7%) power to detect the difference between proportions of 50% and 55% (Most Pessimistic Variance Assumption) when the total number of joints is 1440. The inter- (i.e. between R1 and R2 cross-sectional MR, R1 and R2 synovitis maps, R1 and R2 quick shot diagnoses) and intra-observer (i.e. R1 cross-sectional MR and R1 synovitis maps, R2 cross-cross-sectional MR and R2 synovitis maps) agreement for both the detection of articular synovitis and tenosynovitis as well as diagnostic confidence on a per-patient basis were assessed by using k statistics and interpreted as follows: A k-value greater than 0.81 corresponded to an excellent agreement, a k-value of 0.61–0.80 corresponded to a very good interobserver agreement, a k-value of 0.41–0.60 corresponded to a good interobserver agreement, and a k-value of 0.21–0.40 corresponded to a moderate interob-server agreement. The differences in review times between the two readers and the two methods (i.e. cross-sectional MR vs. synovitis maps) were assessed separately according to the method of Bland and Altman and determined as the mean differences (bias) that are presented with 95% CI (confidence interval). Diagnostic confidence scores were compared using the Wilcoxon signed ranks test.
Fig. 1 A 48-year-old woman with rheumatoid arthritis. a Contrast-enhanced coronal and transverse, T1-weighted images after fat saturation illustrating signs of hyperaemia at the capsule of the metacarpophalan-geal joints II and IV of the left hand (arrows). b Synovitis map derived from a FLASH-MRI sequence demonstrating the same locations of hyperaemia (arrowheads) on one summation image
Fig. 2 A 52-year-old man with rheumatoid arthritis. a Contrast-enhanced coronal and transverse T1-weighted images after fat saturation depicting signs of hyperaemia at the flexor tendon sheaths II–V on the right (arrowheads) and at the capsule of the metacarpophalangeal joints II–IV (arrows). b Synovitis map providing an overview of all joints affected by articular synovitis (arrows) and additionally illustrating the enhancement pattern of tenosynovitis as the typical “tram line” sign (arrowheads)
Correlation between review times of both readers and diagnostic confidence was assessed using
Spear-man’s correlation analysis. As continuous variables
were normally distributed, as demonstrated by the Kolmogorov-Smirnoff test, review times of both readers using both techniques (i.e. cross-sectional MR vs. synovitis maps) were compared using paired t-tests on a per-patient basis.
Diagnostic accuracy, sensitivity, specificity, positive predictive value and negative predictive value were assessed from Chi-squared tests of contingency, and the 95% confidence intervals were calculated. Statistics for diagnostic accuracy were calculated on joint- and tendon sheath-based and patient-based analyses; the latter de-fined as the presence of at least one diseased joint / tendon sheath or absence of any inflammatory joint / tendon sheath changes in each patient. Results from a consensus assessment of a panel of senior staff muscu-loskeletal radiologists served as the standard of reference. A p value <0.05 was considered to indicate statistical significance for all tests.
Results
The effect of clustering of joints (p=0.77) and tendon sheaths (p=0.93) within each patient for inflammatory joint and tendon sheath disorders was not significant, justifying the assumption that the joints and tendon sheaths can be analysed independently.
Inter-observer agreement
Concerning cross-sectional MRI, interobserver agreement was good (k=0.52) for the detection of articular synovitis and moderate (k=0.37) for the detection of tenosynovitis. There was a good inter-observer agreement regarding the detection of articular synovitis (k=0.47) and tenosynovitis (k=0.55) using synovitis maps. Confidence scores of both readers regarding the detection or exclusion of articular synovitis differed significantly when considering cross-sectional MR (p<0.01) with mean confidence scores of 3.54 (median 4, range 2–4) for R1 and 3.50 (median 4, range 1–5) for reader 2 but were similar using synovitis maps (p=0.80). Confidence scores of both readers regarding the detection or exclusion of tenosynovitis differed signifi-cantly when considering cross-sectional MR (p<0.01) with mean confidence scores of 4.00 (median 4, range 2–5) for R1 and 3.29 (median 3, range 2–5) for reader 2 but were similar regarding synovitis maps (p=0.10). The k-values for the detection of articular synovitis and tenosynovitis indicated moderate inter-observer agreement (k=0.34) using the quick shot method. Bland-Altman analysis revealed differences in
review times between the two readers (i.e. cross-sectional
MR=−28±66 s, synovitis maps=12±29 s). Mean review
times of R1 were significantly shorter compared with R2 regarding cross-sectional MRI (p<0.05) but were significantly (p<0.05) longer compared with R2 when considering synovitis maps. Diagnostic confidence scores and review times for both readers and both techniques (i.e. cross-sectional MR and synovitis maps) are demonstrated
in Fig.3.
Comparison between cross-sectional MR and synovitis maps
Intra-observer agreement regarding the detection of articular synovitis (R1: k=0.59; R2: k=0.44) and tenosynovitis (R1: k= 0.49; R2: k=0.47) were good between cross-sectional MRI and synovitis maps for both readers. Confidence scores regarding the detection or exclusion of articular synovitis of R1 (p=0.13) and R2 (p=0.12) were similar when comparing synovitis maps and cross-sectional MR for each reader separately. Similarly, no significant differences (p=0.29) in confidence scores regarding the detection or exclusion of tenosynovitis were observed for R1 when comparing cross-sectional MRI and Fig. 3 Bar diagrams demonstrating the mean diagnostic confidence scores (a) and review times (b) for both readers and both techniques (i.e. conventional MR and synovitis maps) for the assessment of articular synovitis and tenosynovitis
T able 3 Performance of conventional MR and synovitis maps for the diagnosis of tenosynovitis for both readers TP TN FP FN Sensitivity (95% CI) Specificity (95% CI) PPV (95% CI) NPV (95% CI) Accuracy (95% CI) T endon sheath based analysis (n = 560) R1 synovitis maps 18 463 53 26 0.41 (0.26 –0.57) 0.89 (0.87 –0.92) 0.25 (0.16 –0.37) 0.95 (0.92 –0.96) 0.86 (0.83 –0.89) R1 conventional MRI 53 438 18 51 0.51 (0.41 –0.61) 0.96 (0.94 –0.98) 0.75 (0.63 –0.84) 0.90 (0.87 –0.92) 0.88 (0.85 –0.90) R2 synovitis maps 3 487 68 2 0.60 (0.15 –0.95) 0.88 (0.85 –0.90) 0.04 (0.01 –0.12) 1.00 (0.99 –1.00) 0.88 (0.84 –0.90) R2 conventional MRI 19 478 52 1 1 0.63 (0.44 –0.80) 0.90 (0.87 –0.93) 0.27 (0.17 –0.39) 0.98 (0.96 –0.99) 0.89 (0.86 –0.91) Patient-based analysis (n = 40) R1 synovitis maps 14 17 2 7 0.67 (0.43 –0.85) 0.89 (0.67 –0.99) 0.88 (0.62 –0.98) 0.71 (0.49 –0.87) 0.87 (0.62 –0.89) R1 conventional MRI 20 12 7 1 0.95 (0.76 –1.00) 0.63 (0.38 –0.84) 0.74 (0.54 –0.89) 0.92 (0.64 –1.00) 0.80 (0.64 –0.91) R2 synovitis maps 8 1 9 0 13 0.38 (0.18 –0.62) 1.00 (0.83 –1.00) 1.00 (0.63 –1.00) 0.59 (0.41 –0.76) 0.68 (0.51 –0.81) R2 conventional MRI 14 15 4 7 0.67 (0.43 –0.85) 0.79 (0.54 –0.94) 0.78 (0.52 –0.94) 0.68 (0.45 –0.86) 0.73 (0.56 –0.85) TP true-positives, TN true-negatives, FP false-positives, FN false-negatives, PPV positive-predictive value, NPV negative-predictive value, CI confidence interval, R1 reader 1, R2 reader 2 All analyses were performed including all joints and tendon sheaths T able 2 Performance of conventional MR and synovitis maps for the diagnosis of articular synovitis for both readers TP TN FP FN Sensitivity (95% CI) Specificity (95% CI) PPV (95% CI) NPV (95% CI) Accuracy (95% CI) Joint-based analysis (n = 1440) R1 synovitis maps 79 1216 71 74 0.52 (0.43 –0.60) 0.94 (0.93 –0.96) 0.53 (0.44 –0.61) 0.94 (0.93 –0.95) 0.90 (0.88 –0.91) R1 conventional MR 1 1 0 1 158 40 132 0.45 (0.39 –0.52) 0.97 (0.95 –0.98) 0.73 (0.66 –0.80) 0.90 (0.88 –0.91) 0.88 (0.86 –0.90) R2 synovitis maps 47 1262 103 28 0.63 (0.51 –0.74) 0.92 (0.91 –0.94) 0.31 (0.24 –0.39) 0.98 (0.97 –0.99) 0.91 (0.89 –0.92) R2 conventional MR 18 1275 132 15 0.55 (0.36 –0.72) 0.91 (0.89 –0.92) 0.12 (0.07 –0.18) 0.99 (0.98 –0.99) 0.90 (0.88 –0.91) Patient-based analysis (n = 40) R1 synovitis maps 28 6 2 4 0.87 (0.71 –0.96) 0.75 (0.35 –0.97) 0.93 (0.78 –0.99) 0.60 (0.26 –0.88) 0.85 (0.70 –0.95) R1 conventional MR 30 7 0 3 0.91 (0.76 –0.98) 1.00 (0.59 –1.0) 100 (0.88 –1.00) 0.70 (0.35 –0.93) 0.93 (0.79 –0.98) R2 synovitis maps 20 8 1 0 2 0.91 (0.71 –0.99) 0.45 (0.21 –0.69) 0.67 (0.47 –0.83) 0.80 (0.44 –0.97) 0.70 (0.53 –0.83) R2 conventional MR 25 10 5 0 1.00 (0.86 –1.00) 0.67 (0.38 –0.88) 0.83 (0.65 –0.94) 1.00 (0.69 –1.00) 0.88 (0.73 –0.95) TP true-positives, TN true-negatives, FP false-positives, FN false-negatives, PPV positive-predictive value, NPV negative-predictive value, CI confidence-interval All analyses were performed including all joints and tendon sheaths
synovitis maps. A significant difference in diagnostic confi-dence was found regarding the detection or exclusion of tenosynovitis for R2 (p<0.05) when comparing cross-sectional MRI and synovitis maps with a lower mean confidence score (3.31; median 3, range 2–5) for cross-sectional MR and a
higher mean confidence score (3.72; median 4, range 2–5) for
synovitis maps. Differences in review times were observed regarding cross-sectional MRI and synovitis maps for each reader separately. Mean review times were signif-icantly longer for cross-sectional MR compared with synovitis maps for both readers (both, P<0.001).
The review times of the two readers were not correlated with the diagnostic confidence concerning cross-sectional MRI and synovitis maps separately (p>0.05).
Diagnostic accuracy
The panel of senior staff musculoskeletal radiologists identified 150/1440 joints (10.4%) affected by synovitis in 30/40 patients (75%) located in the distal radioulnar joints in 8/40 patients (20%), the radio-carpal joints in 5/40 patients (12.5%), the inter-carpal joints in 13/40 patients (32.5%), the carpometacarpal joints in 4/40 patients (10%), the metacarpophalangeal joints in 25/40 patients (62.5%), and the interphalangeal joints in 13/40 patients (32.5%), respectively. Articular synovitis was excluded in 10/40 patients (25%).
The panel identified 71/560 tendon sheaths (12.7%) affected by tenosynovitis in 21/40 patients (52.5%) located in the carpal region in 8/40 patients (20%) and the phalangeal region in 19/40 patients (47,5%), respec-tively. Tenosynovitis was excluded in 19/40 patients (47.5%). Diagnostic accuracy for the detection of articular synovitis and tenosynovitis of the two techni-ques (i.e. cross-sectional MRI and synovitis maps) and the two readers is demonstrated on per-joint based / tendon-sheath-based and per-patient-based analyses in
Tables 2 and 3. Mean diagnostic accuracy, sensitivity,
specificity, positive predictive value and negative predic-tive value of the assessment of inflammatory changes
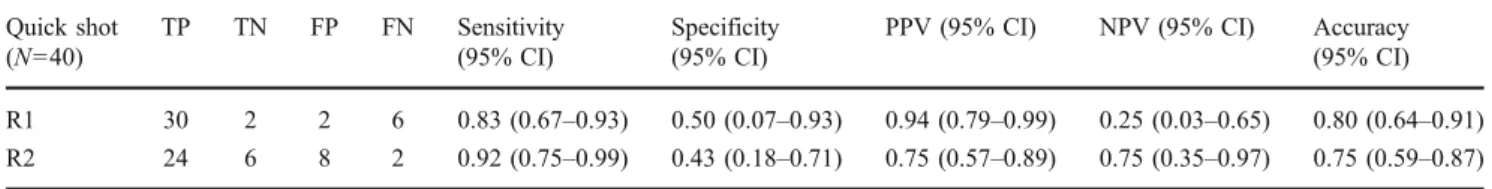
using the quick shot method are demonstrated in Table4.
Discussion
The aim of our study was to demonstrate and evaluate the ability of synovitis maps, derived from a fast low angle shot (FLASH) MR sequence, to illustrate and depict articular synovitis and tenosynovitis of the hand compared with cross-sectional MR sequences with a panel of musculo-skeletal imaging experts serving as the standard of reference.
The FLASH technique was originally developed by a work group around Frahm, in order to establish a rapid gradient echo sequence to significantly shorten the time of acquisition and to enable a more detailed depiction of
anatomical structures without losing spatial resolution [10].
FLASH sequences may be added to any MRI protocol as their acquisition time is short. In our study, the acquisition of FLASH sequences required 4–5 min per patient. Taking advantage of the rapid acquisition times, FLASH sequences
are commonly applied in MR angiography [11], in general
MR imaging of the thorax or abdomen and in cardiac MR imaging. The use of this fast imaging technique for the assessment of inflammatory joint and tendon sheath changes is rational because such changes are associated with increased blood flow and increased capillary perme-ability and thus early contrast enhancement. However, little has been published on the use of 3D-MRI in the assessment
of articular synovitis and tenosynovitis. Mori et al [12]
proposed the use of MIP images reconstructed from transverse, T1-weighted, contrast-enhanced MR images after fat saturation and suggested the introduction of a new scoring system for MIP imaging of the hand in rheumatoid arthritis. Usually, reproducible scoring systems such as the Outcome Measures in RA Clinical Trials (OMERACT) include the assessment of bone erosions,
bone marrow oedema and synovitis volume [13], which are
considered the key factors for predicting erosive
progres-sion [14]. According to the rheumatoid arthritis magnetic
resonance imaging system (RAMRIS) criteria, bone ero-sions have to be detectable in two, preferably axial and coronal, image planes, whereas bone marrow oedema is best depicted upon non-contrast-enhanced, T2-weighted
Table 4 Diagnostic accuracy of the quick shot diagnoses regarding articular synovitis and tenosynovitis Quick shot (N=40) TP TN FP FN Sensitivity (95% CI) Specificity (95% CI)
PPV (95% CI) NPV (95% CI) Accuracy (95% CI) R1 30 2 2 6 0.83 (0.67–0.93) 0.50 (0.07–0.93) 0.94 (0.79–0.99) 0.25 (0.03–0.65) 0.80 (0.64–0.91) R2 24 6 8 2 0.92 (0.75–0.99) 0.43 (0.18–0.71) 0.75 (0.57–0.89) 0.75 (0.35–0.97) 0.75 (0.59–0.87) TP true-positives, TN true-negatives, FP false-positives, FN false-negatives, PPV positive predictive value, NPV negative predictive value, CI confidence interval, R1 reader 1, R2 reader 2
images after fat saturation, preferably in the coronal plane
[15].
Regarding the quantification of synovitis, the measure-ment of synovial volume, which should be performed on contrast-enhanced T1-weighted images after fat saturation
[16, 17], appears to be a reliable predictor of disease
progression and response to treatment [18, 19]. Dynamic
contrast-enhanced MRI (DCE-MRI), defined as the acqui-sition of sequential images during and after the injection of intravenous contrast agent, is capable of evaluating the time course of synovial enhancement, which may be illustrated graphically. To perform DCE-MRI of the hand and wrist, improved temporal and spatial resolution is necessary due to the fast enhancement of the synovium and the relatively small anatomical structures. Therefore, rapid 3D sequences with high spatial resolution should
be chosen [20, 21]. A correlation between the results of
DCE-MR and clinical findings such as joint swelling, pain
and disease activity scores has been reported [22–24].
Various studies have demonstrated the importance of an early depiction of synovitis and tenosynovitis by MR imaging in order to start proper treatment and avoid
disease progression [25,26].
Comparing the diagnostic accuracy in the assessment of articular synovitis and tenosynovitis of MRI with that of other imaging techniques such as ultrasound, computed tomogra-phy (CT), radiogratomogra-phy and scintigratomogra-phy, the superiority of MR imaging has been demonstrated by different study groups. Weiner et al reported a rather low sensitivity (32%) in the detection of joint abnormalities using radiography and point out the advantage of MR imaging in comparison to ultrasound
[2]. Cyteval demonstrated that Doppler ultrasound can be
used to differentiate active from inactive synovitis but propose DCE-MRI as the imaging method of choice
regarding the evaluation of synovitis [27]. Several reports
emphasise that MR imaging is superior to radiography in the detection of erosions within the first year of the onset of
disease [28–30]. In addition, MR represents the only
technique capable of depicting bone marrow oedema, a
precursor of bone destruction [31]. A further advantage of
MRI over other imaging techniques is the evaluation of tendons and tendon sheaths. Tehranzadeh et al. described an improving diagnostic accuracy in the depiction of tenosyn-ovitis using contrast-enhanced MRI compared with
unen-hanced MRI [32]. Eshed et al. pointed out flexor
tenosynovitis as a strong early predictor of rheumatoid arthritis and reported a sensitivity of 60% and a diagnostic accuracy of 66% for the diagnosis of tenosynovitis for the flexor tendons and a sensitivity of 24% and diagnostic accuracy of 38% for the diagnosis of tenosynovitis for the
extensor tendons [33].
In our study, we have found the appearance of the enhancement pattern of tenosynovitis on the synovitis maps
to be very similar to“tram lines”. However, on the synovitis
maps, it is not possible to differentiate between flexor and extensor tendons regarding the exact location of tenosynovitis due to the fact that synovitis maps represent 3D summation images. However, our results are superior compared with
Eshed’s group concerning the diagnosis of tenosynovitis,
using cross-sectional MR and synovitis maps.
In our study, the diagnostic performance of cross-sectional MRI was superior to the synovitis maps when read by a radiologist. The second reader in our study was a member of the rheumatology department, who reached better results interpreting the synovitis maps than the cross-sectional MR studies. Although we do not consider the diagnostic perfor-mance of the synovitis maps sufficient for stating a diagnosis, the presented method may assist not only radiologists but also clinicians by illustrating the key findings of articular synovitis and tenosynovitis in a more convenient way. This is achieved by presenting an overview of all locations that are affected by pathological contrast enhancement, as occurs in articular synovitis and tenosynovitis. The two readers in our study also had to perform a quick shot diagnosis upon the synovitis maps to decide if inflammatory joint or tendon sheath changes were present or not. Reader 1 (Radiologist) identified 80% of patients correctly, while reader 2 (Rheumatologist) reached 75%. Furthermore the review times for synovitis maps were significantly lower for both readers if compared with cross-sectional MR imaging. Therefore synovitis maps may be useful for both radiologists and clinicians, to get a quick look at the extent of inflammatory disorders of the hands before assessing the cross-sectional MR images to develop a final diagnosis.
Although synovitis maps may add value to a standard MR protocol, we need to allege some limitations at this point. First, the detailed localisation of the affected anatomical structure is restricted due to the fact that synovitis maps are reconstructed summation images. Second, other anatomical or pathological structures may imitate synovitis or tenosynovitis such as any focus of hyperaemia. We have observed the onychostroma to show such hyperattenuation. Small haemangiomas or arterio-venous malformations may imitate an inflammatory focus on synovitis maps. Third, bone marrow oedema may not be depicted on the synovitis maps. Fourth, we have to state that Reader 2 was a staff member of the rheumatology department and was therefore less experienced in reading MR images than Reader 1, who was a Radiologist.
Conclusion
Synovitis maps provide a comparable diagnostic accuracy to conventional MR images in the assessment of articular synovitis and tenosynovitis of the hand. Because of short
review times, synovitis maps provide a fast overview of locations with synovial enhancement.
Disclosure Prof. J. Hodler is a member of the Siemens MSK advisory board. All other authors have nothing to disclose.
References
1. Botha-Scheepers S, Riyazi N, Watt I et al (2009) Progression of hand osteoarthritis over 2 years: a clinical and radiological follow-up study. Ann Rheum Dis 68:1260–1264
2. Weiner SM, Jurenz S, Uhl M et al (2008) Ultrasonography in the assessment of peripheral joint involvement in psoriatic arthritis: a comparison with radiography, MRI and scintigraphy. Clin Rheumatol 27:983–989
3. Imhof H, Nobauer-Huhmann IM, Gahleitner A et al (2002) Pathophysiology and imaging in inflammatory and blastomatous synovial diseases. Skeletal Radiol 31:313–333
4. McQueen FM (2000) Magnetic resonance imaging in early inflam-matory arthritis: what is its role? Rheumatology (Oxford) 39:700–706 5. Ostergaard M, Stoltenberg M, Lovgreen-Nielsen P, Volck B, Jensen CH, Lorenzen I (1997) Magnetic resonance imaging-determined synovial membrane and joint effusion volumes in rheumatoid arthritis and osteoarthritis: comparison with the macroscopic and microscopic appearance of the synovium. Arthritis Rheum 40:1856–1867
6. van der Leij C, van de Sande MG, Lavini C, Tak PP, Maas M (2009) Rheumatoid synovial inflammation: pixel-by-pixel dynamic contrast-enhanced MR imaging time-intensity curve shape analysis– a feasibility study. Radiology 253:234–240
7. Bozgeyik Z, Ozgocmen S, Kocakoc E (2008) Role of diffusion-weighted MRI in the detection of early active sacroiliitis. AJR Am J Roentgenol 191:980–986
8. Ferencik M, Ropers D, Abbara S et al (2007) Diagnostic accuracy of image postprocessing methods for the detection of coronary artery stenoses by using multidetector CT. Radiology 243:696–702 9. Aufort S, Charra L, Lesnik A, Bruel JM, Taourel P (2005) Multidetector CT of bowel obstruction: value of post-processing. Eur Radiol 15:2323–2329
10. Frahm J, Haase A, Matthaei D (1986) Rapid NMR imaging of dynamic processes using the FLASH technique. Magn Reson Med 3:321–327
11. Sardanelli F, Di Leo G, Aliprandi A et al (2008) Evaluation of carotid vessel wall enhancement with image subtraction after gadobenate dimeglumine-enhanced MR angiography. Eur J Radiol 70:589–594
12. Mori G, Tokunaga D, Takahashi KA et al (2008) Maximum intensity projection as a tool to diagnose early rheumatoid arthritis. Mod Rheumatol 18:247–251
13. Lassere M, McQueen F, Ostergaard M et al (2003) OMERACT rheumatoid arthritis magnetic resonance imaging studies. Exercise 3: an international multicenter reliability study using the RA-MRI score. J Rheumatol 30:1366–1375
14. Palosaari K, Vuotila J, Takalo R et al (2006) Bone oedema predicts erosive progression on wrist MRI in early RA–a 2-yr observational MRI and NC scintigraphy study. Rheumatology (Oxford) 45:1542–1548
15. Conaghan P, Lassere M, Ostergaard M et al (2003) OMERACT rheumatoid arthritis magnetic resonance imaging studies. Exercise 4: an international multicenter longitudinal study using the RA-MRI score. J Rheumatol 30:1376–1379
16. Oliver C, Speake S, Watt I, Dieppe P, Ratcliffe G (1996) Advantages of an increased dose of MRI contrast agent for enhancing inflammatory synovium. Clin Radiol 51:487–493 17. Savnik A, Malmskov H, Thomsen HS et al (2001) MRI of the
arthritic small joints: comparison of extremity MRI (0.2 T) vs high-field MRI (1.5 T). Eur Radiol 11:1030–1038
18. Ostergaard M, Hansen M, Stoltenberg M et al (1999) Magnetic resonance imaging-determined synovial membrane volume as a marker of disease activity and a predictor of progressive joint destruction in the wrists of patients with rheumatoid arthritis. Arthritis Rheum 42:918–929
19. Ostergaard M, Hansen MS, Stoltenberg MB et al (2000) Magnetic resonance imaging as a marker of inflammation, destruction and prognosis in rheumatoid arthritis wrists. Ugeskr Laeger 162:4145– 4149
20. Kirkhus E, Bjornerud A, Thoen J, Johnston V, Dale K, Smith HJ (2006) Contrast-enhanced dynamic magnetic resonance imaging of finger joints in osteoarthritis and rheumatoid arthritis: an analysis based on pharmacokinetic modeling. Acta Radiol 47:845–851 21. Palosaari K, Vuotila J, Takalo R et al (2004) Contrast-enhanced
dynamic and static MRI correlates with quantitative 99Tcm-labelled nanocolloid scintigraphy. Study of early rheumatoid arthritis patients. Rheumatology (Oxford) 43:1364–1373 22. Cimmino MA, Innocenti S, Livrone F, Magnaguagno F, Silvestri
E, Garlaschi G (2003) Dynamic gadolinium-enhanced magnetic resonance imaging of the wrist in patients with rheumatoid arthritis can discriminate active from inactive disease. Arthritis Rheum 48:1207–1213
23. Konig H, Sieper J, Wolf KJ (1990) Rheumatoid arthritis: evaluation of hypervascular and fibrous pannus with dynamic MR imaging enhanced with Gd-DTPA. Radiology 176:473– 477
24. Ostergaard M, Lorenzen I, Henriksen O (1994) Dynamic gadolinium-enhanced MR imaging in active and inactive immunoin-flammatory gonarthritis. Acta Radiol 35:275–281
25. Calisir C, Murat Aynaci AI, Korkmaz C (2007) The accuracy of magnetic resonance imaging of the hands and feet in the diagnosis of early rheumatoid arthritis. Joint Bone Spine 74:362–367 26. Haavardsholm EA, Boyesen P, Ostergaard M, Schildvold A,
Kvien TK (2008) Magnetic resonance imaging findings in 84 patients with early rheumatoid arthritis: bone marrow oedema predicts erosive progression. Ann Rheum Dis 67:794–800 27. Cyteval C (2009) Doppler ultrasonography and dynamic magnetic
resonance imaging for assessment of synovitis in the hand and wrist of patients with rheumatoid arthritis. Semin Musculoskelet Radiol 13:66–73
28. Hoving JL, Buchbinder R, Hall S et al (2004) A comparison of magnetic resonance imaging, sonography, and radiography of the hand in patients with early rheumatoid arthritis. J Rheumatol 31:663–675
29. Klarlund M, Ostergaard M, Jensen KE, Madsen JL, Skjodt H, Lorenzen I (2000) Magnetic resonance imaging, radiography, and scintigraphy of the finger joints: one year follow up of patients with early arthritis. The TIRA group. Ann Rheum Dis 59:521–528 30. McQueen FM, Stewart N, Crabbe J et al (1998) Magnetic resonance imaging of the wrist in early rheumatoid arthritis reveals a high prevalence of erosions at four months after symptom onset. Ann Rheum Dis 57:350–356
31. Peterfy CG (2004) MRI of the wrist in early rheumatoid arthritis. Ann Rheum Dis 63:473–477
32. Tehranzadeh J, Ashikyan O, Anavim A, Tramma S (2006) Enhanced MR imaging of tenosynovitis of hand and wrist in inflammatory arthritis. Skeletal Radiol 35:814–822
33. Eshed I, Feist E, Althoff CE et al (2009) Tenosynovitis of the flexor tendons of the hand detected by MRI: an early indicator of rheumatoid arthritis. Rheumatology (Oxford) 48:887–891