Ions Produced by Electrospray Ionization in
Ultrahigh Vacuum
Konstantin Chingin,
aHuanwen Chen,
bGerardo Gamez,
aand Renato Zenobi
aaDepartment of Chemistry and Applied Biosciences, ETH Zürich, Zürich, Switzerland bApplied Chemistry Department, East China Institute of Technology, Fuzhou, China
Fluorescence spectroscopy and mass spectrometry have been extensively used for character-ization of biomaterials, but usually separately. An instrument combining fluorescence spec-troscopy and Fourier-transform ion cyclotron resonance mass spectrometry (FTICR-MS) has been developed to explore both fluorescence and mass spectrometric behavior of ions produced by electrospray ionization (ESI) in ultra high vacuum (⬍5 ⫻ 10⫺9 mbar). Using rhodamine 6G (R6G) as a sample, the instrument was systematically characterized. Gas-phase fluorescence and mass spectral signal of the same ion population are detected immediately after each other. Effects of gas pressure, ion density, and excitation laser power on the fluorescence signal intensity and mass spectral fragmentation patterns are discussed. Charac-teristic times of ion photodissociation in ultra high vacuum were recorded for different irradiation powers. Photofragmentation patterns of rhodamine 6G ions in the Penning trap of an FTICR spectrometer obtained by photoinduced dissociation (PID) with visible light and sustained off-resonance irradiation collision-induced dissociation (SORI-CID) were compared. The lowest energy dissociation fragment of rhodamine 6G ions was identified by relating PID patterns of rhodamine 6G and rhodamine 575 dyes at various irradiation powers. The unique instrument provides a powerful platform for probing the intramolecular relaxation mecha-nisms of nonsolvated ions when interacting with light, which is of great fundamental interest for better understanding of their physical and chemical properties. (J Am Soc Mass Spectrom 2009, 20, 1731–1738) © 2009 American Society for Mass Spectrometry
F
luorescence spectroscopy is widely applied for sensitive probing of the structure of matter due to its high specificity to the microenvironment. It can provide several types of information on a large variety of samples, such as solid surfaces, biological membranes, living cells, etc[1]. One powerful feature is that it allows one to obtain structural details of biomol-ecules. For instance, fluorescence spectroscopy allows determining binding sites of a protein, as well as its conformational transitions or intramolecular distances. Also, this technique yields information on flexibility, helix structure, torsion dynamics, and carcinogenesis of nucleic acids [1]. Typically, labeling with fluorescent probes is required since most biomolecules do not have intrinsic fluorophores. Protein tagging is nowadays routinely achieved using commercially available fluo-rescent labels that covalently bind to amino or sulfhy-dryl groups.Recently, fluorescence spectroscopy has started to be used to probe ions in the gas phase[2–7]. This comple-ments solution phase data and is important for
eluci-dating the role of the solvent in stabilizing a native structure. Also, gas-phase data are much easier to relate to theoretical calculations because in such a case it is not necessary to consider the interaction of a molecule with solvent molecules, which greatly simplifies the calcula-tions. Nonvolatile molecules are usually brought into the gas phase in ionic form by soft ionization tech-niques, such as electrospray ionization (ESI) [8] or matrix-assisted laser desorption/ionization (MALDI) [9]. Ions produced are typically guided into a quadru-polar trap where they can be stored for a long time as a compact cloud, which enables recording of their fluo-rescence[3, 4, 6, 7]. In their pioneering work, Parks and coworkers monitored dissociation of double-stranded oligonucleotide anions in the gas phase by observing the change in the efficiency of fluorescence resonance energy-transfer (FRET, [10]) between a pair of fluoro-phores BODIPY-TMR (donor) and BODIPY-TR (accep-tor) labeling two strands of the duplex [11]. Later, the same group described the gas-phase behavior of a small Trp-cage protein such as its folding/unfolding dynam-ics [12]. Again, they used BODIPY-TMR dye as a reporter because its fluorescence intensity depends strongly on its proximity to the intrinsic Trp residue of a protein. Quenching of the dye fluorescence was due to
Address reprint requests to Dr. R. Zenobi, Chemistry Department and Applied Biosciences, ETH Zürich, CH-8093 Zürich, Switzerland. E-mail:
zenobi@org.chem.ethz.ch
Published online May 29, 2009 © 2009 American Society for Mass Spectrometry. Published by Elsevier Inc. Received December 12, 2008
1044-0305/09/$32.00 Revised April 18, 2009
photoinduced electron-transfer (PET), which depends exponentially on fluorophore-quencher separation[13]. The same methodology was applied to explore confor-mational changes in unsolvated ions of polyproline peptides and a-hairpin peptide[14].
Fourier-transform ion cyclotron resonance mass spectrometry (FTICR-MS)[15]is a powerful technique which has been successfully applied in a variety of rapidly developing research areas of modern biochem-istry, such as proteomics and petroleomics. Up to now, fluorescence detection in the Penning trap of an FTICR spectrometer has only been performed in home-built instruments with internal ionization sources, such as electron impact (EI) [16] or internal MALDI [5]. This substantially limits the application range of these exper-imental setups.
Our previous experiments were performed in an FTICR mass spectrometer with an internal MALDI ionization source described in detail elsewhere [5]. Clear evidence of FRET occurring in the gas phase was demonstrated for the system rhodamine 6G (donor) and sulforhodamine B (acceptor) covalently bound through a phenyl ring linker [17]. One key limitation of this setup was the low molecular weight range (m/z⬍3000), because the relatively fast ions produced by the MALDI internal source could not be efficiently slowed down before entering the ICR cell. For this reason, heavier ions having higher kinetic energy could not be trapped. Also, since no ion optics were used between the MALDI target and the ICR cell, the ion cloud entering the cell was not focused in the radial direction. Therefore, quadrupolar axialization was always necessary to bring the ions onto the z-axis to provide a good overlap with the laser-induced fluorescence (LIF) excitation laser beam. The axialization in turn requires elevated buffer gas pressure (⬎10⫺5mbar). No fluorescence signal was observed without axialization.
Here we present a novel experimental setup for fluorescence and dissociation spectroscopy experi-ments on gas-phase ions produced in an ICR mass spectrometer using a commercial ESI source. The setup opens new perspectives for spectroscopic prob-ing of biomolecular ions under conventional FTICR-MS experimental conditions. If operated at ultra-high vacuum pressures, the FTICR offers superb mass spec-tral performance, including high mass accuracy, high-resolution, and MSncapabilities for the identification of ions using accurate mass measurements and by observ-ing fragmentation processes through radical or neutral losses. The setup described here offers high versatility as the fluorescence collection is essentially decoupled from the ion optics between the ESI source and the Penning trap. Therefore, our setup can be easily in-stalled on other commercial FTICR instruments, no modifications being required except the installation of the measuring cell described in detail in the Experimen-tal section.
Experimental
Setup
The experiments described here were performed on an FTICR mass spectrometer with an electrospray ionization (ESI) source (IonSpec Corporation, Lake Forest, CA, USA) and a 4.7 Tesla superconducting magnet (Bruker, Fäl-landen, Switzerland). A completely new fluorescence setup, including a new ICR cell, was engineered in our laboratory because the previous setup was not compatible with the z-axis ion introduction by external ESI[5].
Ions produced by ESI at atmospheric pressure were guided through a hexapole transport system with dif-ferential pumping into an open cylindrical cell. The diameter of the cell is 5 cm. All the electrodes were machined from OFHC copper (Haeuselmann Metal AG, Dietlikon, Switzerland). Holes of 6 mm in diameter were drilled into the excitation and detection plates to allow for a laser beam to be introduced into the cell.
The latest version of our experimental setup for the LIF measurements is shown schematically inFigure 1a. The trapped ions were irradiated by a CW Ar ion laser (Innova 300; Coherent, Santa Clara, USA) at a wave-length of 488 nm. The laser beam was introduced into the vacuum chamber through a high vacuum glass viewport (PF610010-X; Pfeiffer Vacuum, Asslar, Ger-many). Due to space limitations caused by the magnet core size (Figure 1), the beam was introduced into the ICR cell through a right angle reflector (74-90-UV; OceanOptics, Dunedin, FL, USA). It consists of a mirror mounted on an anodized aluminum holder so that the incident light is reflected at a 90° angle into the cell. To efficiently absorb the laser beam after it has crossed the ion cloud, a conical beam dump (PL15; Newport, Irvine, CA, USA) was mounted on the opposite side. Light would have to reflect at least three times from black surfaces (reflectivity of less than 10⫺4) to escape, but most of it undergoes many more. Note that we cannot use a “woods horn” beam dump because its installation would require much more free space in the radial direction of the vacuum chamber than available. To suppress scattered light further, two home-built baffle systems were introduced as shown inFigure 1. Finally, the inner walls of the FTICR cell were coated with vacuum compatible, electrically conductive paint (Aquadag E; Acheson Co., Port Huron, MI, USA), which dramatically reduced the scattered excitation laser light.
Alignment of the laser beam path was done when the cell was outside of the vacuum chamber. A long baffle was rigidly braced to the viewport on the flange. Two slits, 2 mm in diameter, were mounted inside the baffle. The distance between the slits was 50 cm. These slits were then used to guide the laser beam when the cell was inside the vacuum chamber. Figure 1b shows a photograph of the ICR cell during the alignment proce-dure. The conical beam dump was removed to control the position of the beam in the cell.
The ion cloud fluorescence was collected by a system of lenses (lens 1: ACH 25X50 MGF2TS, Edmund, f⫽ 50 mm; lens 2: 01LAG117/066, Melles Griot, Rochester, NY, USA; f ⫽ 25 mm), and focused onto the cleaved edge of a 3 mm core diameter plastic fiber with a high NA value of 0.51 (PGR FB 3000, SEDI, Courcouronnes, France). A long pass filter (LP02-488RU; RazorEdge, Semrock, Rochester, NY, USA) was used after the collimating lens to block a part of the scattered laser light. The distance between the collimating and the focusing lens was 10 cm.
The fiber passes the vacuum flange through a Kel-F feedthrough [18]. Light exiting the fiber was focused onto the active surface of a photomultiplier tube (R446; Hamamatsu, Hamamatsu City, Japan). A long pass filter (FEL0500; Thorlabs, North Newton, NJ, USA) was used to block the scattered excitation laser light that was not blocked in the vacuum chamber. The signal from the photomultiplier tube was recorded by an 800 MHz gated photon counter/multiscaler (PMS 400; Becker and Hickl GmbH, Berlin, Germany).
Visible spectra were collected by coupling the plastic fiber to a spectrograph (Shamrock SR-163; Andor, North-ern Ireland) with a 100 m entrance slit and a CCD camera (DV420A-OE, iDus; Andor, Northern Ireland).
The sequence of events in a typical experiment started from creating ions by ESI. These ions were then guided through a system of hexapole filters into the ICR cell. When an increase of the buffer gas pressure was necessary, a pulse of helium gas was introduced through a pulsed leak valve. Ions were stored in the cell as long as necessary (from 1 s to 5 min). Cyclotron motion of the trapped ions was then excited to record a mass spectrum. The Ar ion laser and the PMT were running constantly during the entire experiment. Back-ground signal was therefore detected continuously (be-tween 350 and 1 500 counts per s, depending on the excitation laser power). When the ions entered the cell, the signal increased due to their fluorescence (up to 10 000 counts per s for R6G ions). Excitation of the cyclo-tron motion broke the spatial overlap of the axialized ion cloud and the Ar ion laser beam, i.e., fluorescence was no longer recorded after that event. Note that the recorded mass spectrum shows all the photo-induced fragments produced during the ion cloud storage in the cell. Supplemental material, Figure S1, which can be found in the electronic version of this article, summa-rizes time profile of the major events during a single experiment.
Figure 1. (a) Experimental setup. (b) ICR cell during the laser beam alignment procedure. The conical beam dump was removed to show the position of the beam inside the cell.
For the CID experiments, sustained off-resonance irradiation (SORI) was applied with argon as a collision gas. The peak pressure was 4 ⫻ 10⫺6mbar, the offset frequency 800 Hz, irradiation duration 300 ms, and the amplitude ranged from 0.5 to 2.5 V. Some design features aimed at further improving the analytical per-formance of the platform are discussed in Supplemen-tary material.
Materials
Rhodamine 6G (R6G) was purchased from Acros Organ-ics, Liege Area, Belgium. Rhodamine 575 (R575) was purchased from Exciton, Dayton, OH, USA. Work solu-tions (0.5M) were prepared in an water/acetonitrile (3:7 vol:vol) mixture with 1% acetic acid added.
Results and Discussion
Ion Fluorescence in Ultra High Vacuum
It is worth noting that the light absorption/emission of polar dyes can significantly change when going from solution to the gas phase. Specifically, gas-phase R6G ions absorb the 488 nm laser line much better than the other major line of the Ar ion laser at 514 nm [17], suggesting that the absorption maximum lies close to 488 nm. In contrast, absorption of R6G in ethanol peaks at around 530 nm. A considerable blue shift of⬇40 nm of the R6G absorption can therefore be estimated to occur when moving from solution to the gas phase. This illustrates how sensitive fluorescence spectroscopy is to changes in the microenvironment.
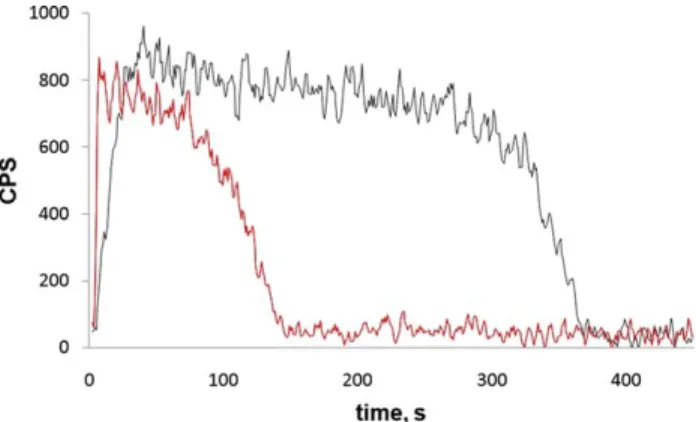
Figure 2shows fluorescence recorded from R6G ions irradiated at 488 nm at 0.2 mW/mm2. This low irradi-ance was used to make sure no photodissociation took place during the experiment. This was confirmed by the mass spectrum, which showed only molecular ions of R6G (not shown). It can be seen that it takes some time
after the ions enter the cell before the signal reaches a plateau (black curve). When eight 10 ms pulses of helium gas with a 200 ms interval were introduced into the cell right after the ion injection, the peak pressure being 5 ⫻ 10⫺5mbar, the signal reached its maximum much faster (red curve). We believe that this results from more efficient axial cooling of the ion cloud along the magnet field lines. At elevated pressure, a much shorter time is needed to focus ions axially in the ICR cell, which makes for a faster complete overlap of the ion cloud with the laser beam [16]. In case of lower pressure, a much longer time is required to cool the ion cloud and, therefore, complete overlap is achieved much later. The cooling can be indirectly observed by monitoring the intensity of the MS signal at different times. For short ion storage periods when the ion cloud in the cell is not completely focused, MS signal intensity is lower compared with that after the ions have been equilibrated. This is because the excitation field is stronger in the center of the ICR cell and, therefore, a better focused ion cloud would produce a stronger signal [19]. Also, the fact that the fluorescence signal grows while the ion cloud is getting more compact further indicates that the laser beam does go through the center of the cell. Otherwise, if the interaction with the ion cloud would take place at the periphery, the signal would decay while the ions were being focused towards the center of the cell.
Another interesting observation is that the fluores-cence signal decays whether or not gas was introduced, although no ion photodissociation occurred. We believe that the reason for this observation is the magnetron expansion of the ion cloud inside the ICR cell [15], which causes a gradual deterioration of the overlap between the laser beam and the ion cloud, resulting in the signal decay. Also, the MS signal intensity starts to decrease after some time as a result of the ion losses in the cell. The fluorescence signal decay was faster when helium gas was introduced (Figure 2, red curve), which enhances the magnetron expansion as its rate strongly depends on the background pressure[15].
Quadrupolar axialization is often performed to avoid magnetron expansion of the ion cloud in the ICR cell [15]. This, however, requires elevated pressure in the trap and therefore was not applied in our experiments. Figure S3 (Supplementary material) shows a correla-tion of the fluorescence signal with the intensity of a molecular peak for R6G ions in the mass spectrum, in the absence of photodissociation. In ICR the latter depends linearly on the number of ions in the cell. One can see that the dependence in the figure deviates from linearity at higher MS signal intensities. This can be explained by incomplete overlap between the ion cloud and the laser beam, since the ion cloud expands at high ion densities due to space charge effects. Better overlap can be achieved using a laser beam of a bigger diameter. This would, however, result in more pronounced laser light scattering inside the cell. For this reason, no attempt was undertaken to improve the overlap in this Figure 2. Two fluorescence signals recorded from rhodamine 6G
ions irradiated at 488 nm with an irradiance of 0.2 mW/mm2. Increase in the signals started right after the ions had entered the cell. Black curve: no neutral gas was introduced during the ion cloud storage in the ICR cell. Red curve: eight 10 ms helium gas pulses with a 200 ms interval were introduced right after the ions had entered the cell. The signals were background subtracted.
fashion. For moderate ion densities, which are typically used for optimal ICR-MS performance, the fluorescence signal does not deviate from linearity significantly (Figure S3). This implies overlap of⬃100% between the laser cross-section and the ion cloud in this case. The reproducibility of fluorescence intensity measurements increased with an increasing number of ions in the cell. For normal ICR-MS operating conditions, the scatter in fluorescence signal did not exceed 10% comparing different experiments with ion populations producing equal MS signals.
Effects of Gas Pressure and Laser Power on the
Fluorescence Signal
In earlier studies, it was demonstrated that the fluores-cence signal from gas-phase ions depends strongly on
the buffer gas pressure[4, 6, 7, 17]. Buffer gas molecules vibrationally cool excited ions, preventing them from rapid photodissociation. The higher the pressure, the more efficient the cooling, which allows using higher excitation laser power. Figure S4 (Supplementary ma-terial) demonstrates the dependence of the highest achievable fluorescence signal recorded from R6G ions in an ICR cell on buffer helium gas pressure recorded by Dashtiev et al.[17]. The attainable signal grew as the pressure increased, due to the possibility to use higher laser powers without destroying fluorescent ions. Qua-drupolar axialization was applied to keep the ions in the center of the cell while the fluorescence was re-corded. No photodissociation occurred at laser irradi-ances up to 50 – 65 mW/mm2 at a background gas pressure around 10⫺4–10⫺5 mbar, at least on the time scale of 10 s. Also, the fluorescence yield was found to
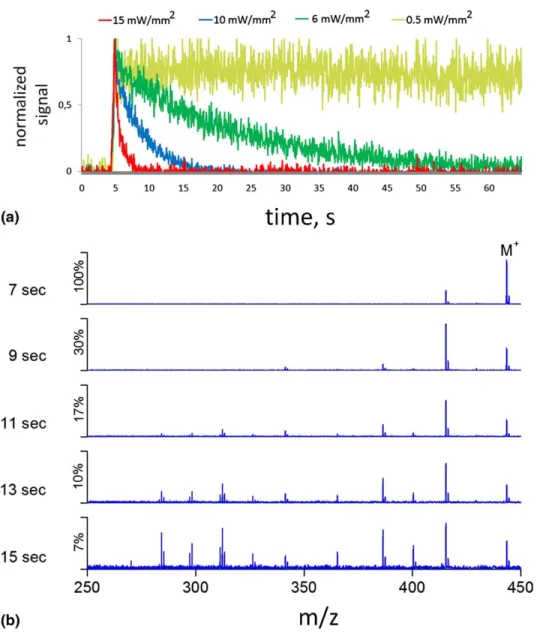
Figure 3. (a) Fluorescence signal decay due to photodissociation of rhodamine 6G ions at different excitation irradiances. (b) Evolution of the MS spectrum for rhodamine 6G ions due to photodecom-position. Laser irradiance was 10 mW/mm2(blue curve in Figure 3a). All spectra are normalized to the signal intensity of its corresponding largest peak. The y-axis shows the relative intensity of each spectrum with respect to the M⫹signal of the spectra at 7 s.
depend on what kind of buffer gas was used for the quadrupolar axialization[20]. In particular, no fluores-cence from R6G ions could be detected when argon gas was applied, which was explained by possible quench-ing due to the external heavy atom effect [1]. The highest fluorescence yield was obtained by helium gas as a buffer.
Clearly, in ultrahigh vacuum where collisions with neutrals are very rare, vibrational heating of ions should proceed very rapidly. Figure 3a shows the fluorescence signal from R6G ions recorded in our new setup at various excitation laser irradiances. Five time profiles were accumulated for each laser irradiance. The background signal was subtracted, and the resulting signals were then normalized. The rapid increase of the signal at around 4 s corresponds to the time when the ions enter the ICR cell. A short helium gas pulse was introduced as soon as they had been trapped to accel-erate axial focusing of the ion cloud. The decay is due to photodissociation of parent R6G ions into nonfluoresc-ing fragments (Figure 3b). It is worth noting that at least the first fragment of R6G at m/z 415, produced by loss of the ethylene, was found to fluoresce as well, which could be seen by illuminating the isolated ion species at m/z 415 (not shown). The structural and photochemical properties of the first fragment will be discussed in detail below. The decay curves thus represent the net fluorescence profile from both R6G ions and their fragments. These curves were well fit with a double exponential [y⫽ A1exp(⫺t/a1) ⫹ A2exp(⫺t/a2) ⫹ y0, A1⫽ 431, a1 ⫽ 3 s, A2 ⫽ 1219, a2 ⫽ 89 s, R2⫽ 0.97 for the decay at 10 mW/mm2 in Figure 3a (blue curve)], which suggests that the role of the fragments in pro-ducing the net signal cannot be neglected. We interpret the second, slower time constant to be due to the fluorescence from fragments that exhibit quite a differ-ent branching ratio between the differdiffer-ent excited-state decay channels (fluorescence, nonradiative decay, photodissociation), presumably due to the structural changes. Figure 3b shows how the mass spectrum evolves due to photofragmentation of R6G. The spectra
correspond to the blue decay curve in Figure 3a, pro-viding a complete time profile of photochemical disso-ciation reactions that take place in the ICR cell.
Indeed, rapid photodissociation limits the fluores-cence detection efficiency. It can be seen fromFigure 3a that at a laser irradiance of 15 mW/mm2, the fluores-cence signal decays completely within about 5 s after the ions have entered the cell. However, as mentioned earlier, at elevated pressures no photodissociation of R6G ions in an ICR cell could be seen at a laser irradiance as high as 65 mW/mm2, at least on a time scale of 10 s[17]. For comparison, the probability of R6G photobleaching in solution, where vibrational cooling is much more efficient than in gas phase due to frequent collisions with solvent molecules, is in the order of 10⫺6–10⫺7 for irradiances below 10 W/mm2, which results in fluorescence life times about 1000 s[21].
Photoactivation in Ultra High Vacuum
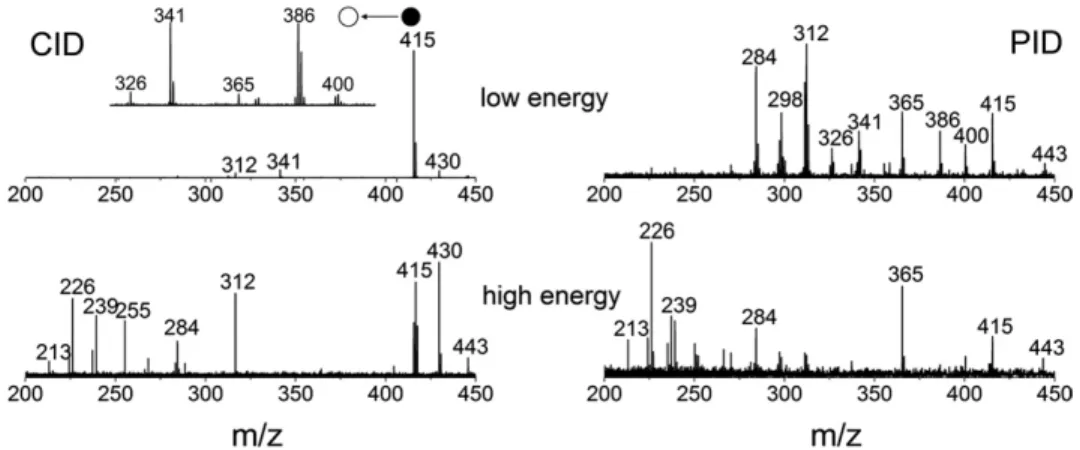
To obtain information on the structure of biomolecu-lar ions in FTICR mass spectrometry, sustained off-resonance irradiation collision-induced dissociation (SORI-CID) is often used[22]. However, it only allows for activation of ions with a certain m/z value and, therefore, prevents further dissociation of produced fragments. For large biomolecules, it can significantly limit attainable structural information on a parent ion [23]. Also, since SORI-CID is performed at an elevated pressure, the fragments produced may diffuse radially due to magnetron expansion promoted by the gas load. This can significantly compromise the accuracy of the mass measurement[24]. In case of photo-induced acti-vation, however, no gas introduction is necessary, and daughter ions are still available for further fragmenta-tion as long as they are spectroscopically active. Here we show that even for small ions, a difference exists between SORI-CID and photoinduced dissociation (PID) MS spectra.Figure 4demonstrates SORI-CID and PID spectra for R6G ions obtained at different activation energies. It can be seen that at low CID energy, ions at
Figure 4. SORI-CID (left) and PID (right) MS spectra obtained at different activation energies (SORI-CID voltages were 1.2 and 1.5 V, laser irradiance was 10 mW/mm2and 20 mW/mm2for the top and bottom spectra respectively). Inset: SORI-CID MS spectrum of the fragment at m/z 415.
m/z 415 are preferentially produced. Once produced, these ions are not available for further fragmentation in SORI-CID. Low-energy PID gives the same fragment at m/z 415. It was observed, however, that despite some structural changes, this fragment also absorbs light at the same wavelength as the parent R6G ions. Therefore, it can dissociate further, resulting in a more complete fragmentation pattern as can be seen by comparing top left and top right spectra inFigure 4. For example, the fragments at m/z 386 and 365 are absent in the SORI-CID spectra, while being easily detected by PID. The fragmentation patterns suggest that these species are much easier to produce from the fragment at m/z 415 rather than directly from the parent R6G ions. To prove this hypothesis, SORI-CID was performed on the frag-ment at m/z 415, revealing abundant signals at m/z 386 and 365 (inset in Figure 4). At higher activation ener-gies, the difference between CID and PID patterns is not so pronounced because the fragment at m/z 415 is no longer the main dissociation channel (Figure 4, bottom). It is worth noting that excitation of fluorescent mol-ecules with visible light in high vacuum results in gradual gain of internal energy during successive pho-ton absorption/emission cycles. Photofragmentation happens when accumulated vibrational energy is high enough to break the weakest chemical bond. This is very similar to the mechanism of infrared multiphoton dissociation (IRMPD) [23]where vibrational energy is accumulated directly through successive absorption of IR quants, without exciting the higher electronic energy level.
For molecules that absorb visible light but do not fluoresce (quenchers), excitation with visible light will, however, result in a much faster accumulation of vibra-tional energy due to internal conversion from the ex-cited electronic state and therefore very rapid fragmen-tation. If dissociation proceeds faster than complete vibrational energy redistribution (IVR), some comple-mentary structural information can be accessed (see the discussion in Supplementary material). Alternatively, excitation to the second excited state can be achieved for higher laser irradiances, in which case photophysics is essentially the same as for UV excitation[25].
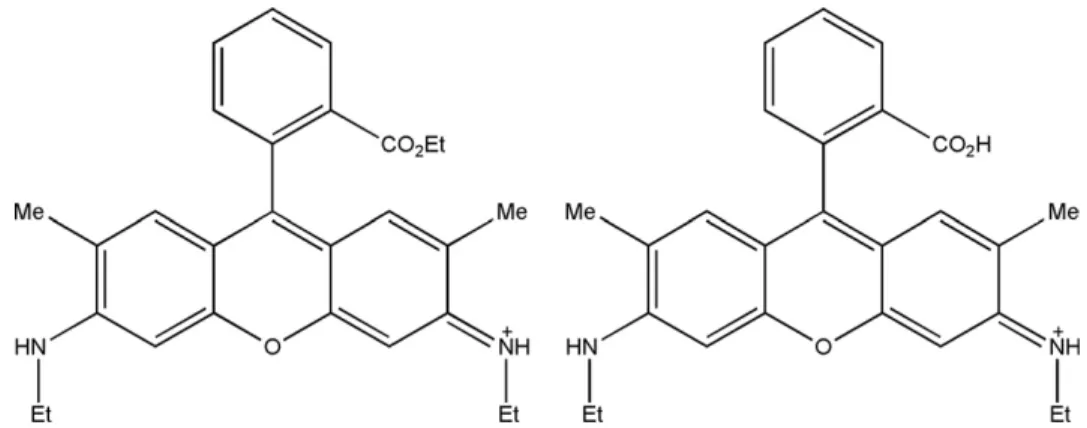
The lowest activation energy at which fragmentation starts to occur is characteristic of R6G photostability. It is thus important to know how the first fragment at m/z 415 is created. The structure of an R6G ion is shown in
Scheme 1 (left). The difference of 28 units is obviously due to the loss of an ethylene. It is not obvious, however, which C2H4group dissociates, among the three available. We believe that most probably it is the one from the ester group. If this is the case, the resulting fragment should look like in Scheme 1 (right), the structure of rhodamine 575 (R575), which is commercially available on the market. To prove our hypothesis, PID spectra of these two compounds were obtained at different exci-tation laser powers (Figure 5). A remarkable agreement between these two sets of data could be seen. This finding suggests that with high probability the lowest energy fragmentation channel of R6G ions is dissociat-ing into R575 ions due to loss of ethylene from the ester. Also, R575 was found to be fluorescent when activated at 488 nm, which is consistent with our finding that some Scheme 1. Structures of rhodamine 6G (left) and rhodamine 575 (right) ions.
Figure 5. PID spectra of rhodamine 6G (black line) and rhoda-mine 575 (red line) ions at different excitation laser powers.
fragments of R6G contribute into the net signal, as dis-cussed above. The fluorescence yield of R575 was about two times lower than that of R6G, which is probably due to the shift in absorption/emission maxima.
Conclusions
In combination with fluorescence/photofragmentation spectroscopy FTICR-MS provides unique capabilities for probing ions in the gas phase due to the long ion storage times, ultra low-pressure, and its high mass selectivity. A unique setup was built in our lab for this purpose, allowing us to perform fluorescence spectros-copy inside an FTICR spectrometer on ions produced by electrospray ionization. The new platform was thor-oughly described, and preliminary data on gaseous rhodamine 6G ions were shown.
Acknowledgments
The authors thank Mr. Kurt Baumgartner for machining the parts of the ICR measuring cell and Mr. Heinz Benz for the technical assistance with electronics. The authors also thank Dr. Arno Wortmann (Roche, Switzerland), Dr. Maxim Dashtiev (Bruker, Russia), Dr. Vladimir Azov (University of Bremen, Germany), and Dr. Michael Gorshkov (Institute of Energy Problems of Chemical Physics, Russia) for helpful discussions.
Appendix A
Supplementary Material
Supplementary material associated with this article may be found in the online version at doi:10.1016/ j.jasms.2009.05.011.
References
1. Valeur, B. Molecular Fluorescence: Principles and Applications; Wiley-VCH: Weinheim, 2002, 11–15, 41.
2. Wang, Y.; Hendrickson, C. L.; Marshall, A.G. Direct Optical Spectros-copy of Gas-Phase Molecular Ions Trapped and Mass-Selected by Ion Cyclotron Resonance: Laser-Induced Fluorescence Excitation Spectrum of Hexafluorobenzene (C6F6⫹). Chem. Phys. Lett. 2001, 1/3, 69–75. 3. Khoury, J. T.; Rodriguez-Cruz, S. E.; Parks, J. H. Pulsed Fluorescence
Measurements of Trapped Molecular Ions with Zero Background Detection. J. Am. Soc. Mass Spectrom. 2002, 6, 696 –708.
4. Wright, K. C.; Blades, M. W. Fluorescence Emission Spectroscopy of Trapped Molecular Ions. Proceedings of the 51st ASMS Conference on Mass
Spectrometry and Allied Topics; Montreal, Canada, June, 2003.
5. Frankevich, V.; Guan, X. W.; Dashtiev, M.; Zenobi, R. Laser-Induced Fluorescence of Trapped Gas-Phase Molecular Ions Generated by
Internal-Source Matrix-Assisted Laser Desorption/Ionization in a Fourier Transform Ion Cyclotron Resonance Mass Spectrometer. Eur. J.
Mass Spectrom. 2005, 5, 475– 482.
6. Bian, Q.; Talbot, F. O.; Forbes, M. W.; Yao, H.; Jockusch, R. A. Development and Characterization of Laser Induced Fluorescence Spectroscopy Coupled with Ion Trap Mass Spectrometry. Proceedings of
the 56th ASMS Conference on Mass Spectrometry and Allied Topics; Denver,
CO, June, 2008.
7. Sassin, N. A.; Everhart, S. C.; Dangi, B. B.; Ervin, K. M.; Cline, J. I. Fluorescence and Photodissociation of rhodamine 575 Cations in a Quadrupole Ion Trap. J. Am. Soc. Mass Spectrom. 2009, 1, 96 –104. 8. Fenn, J. B.; Mann, M.; Meng, C. K.; Wong, S. F.; Whitehouse, C. M.
Electrospray Ionization for Mass-Spectrometry of Large Biomolecules.
Science 1989, 4926, 64 –71.
9. Hillenkamp, F.; Karas, M.; Beavis, R. C.; Chait, B. T. Matrix-Assisted Laser Desorption Ionization Mass-Spectrometry of Biopolymers. Anal.
Chem. 1991, 24, A1193–A1202.
10. Stryer, L.; Haugland, R. P. Energy Transfer—A Spectroscopic Ruler.
Proc. Natl. Acad. Sci. U.S.A. 1967, 2, 719–726.
11. Danell, A. S.; Parks, J. H. FRET Measurements of Trapped Oligonucle-otide Duplexes. Int. J. Mass Spectrom. 2003, 1/2, 35– 45.
12. Iavarone, A. T.; Parks, J. H. Conformational Change in Unsolvated Trp-Cage Protein Probed by Fluorescence. J. Am. Chem. Soc. 2005, 24, 8606 – 8607.
13. Neuweiler, H.; Sauer, M. Using Photoinduced Charge Transfer Reac-tions to Study Conformational Dynamics of Biopolymers at the Single-Molecule Level. Curr. Pharm. Biotechnol. 2004, 3, 285–298.
14. Iavarone, A. T.; Duft, D.; Parks, J. H. Shedding Light on Biomolecule Conformational Dynamics Using Fluorescence Measurements of Trapped Ions J. Phys. Chem. A 2006, 47, 12714 –12727.
15. Marshall, A. G.; Hendrickson, C. L.; Jackson, G. S. Fourier Transform Ion Cyclotron Resonance Mass Spectrometry: A primer. Mass Spectrom.
Rev. 1998, 1, 1–35.
16. Li, G. Z.; Vining, VA.; Guan, S. H.; Marshall, A. G. Laser-Induced Fluorescence of Ba⫹ Ions Trapped and Mass-Selected in a Fourier Transform Ion Cyclotron Resonance Mass Spectrometer. Rapid Commun.
Mass Spectrom. 1996, 14, 1850 –1854.
17. Dashtiev, M.; Azov, V.; Frankevich, V.; Scharfenberg, L.; Zenobi, R. Clear Evidence of Fluorescence Resonance Energy Transfer in Gas-Phase Ions. J. Am. Soc. Mass Spectrom. 2005, 9, 1481–1487.
18. Abraham, E. R. I.; Cornell, E. A. Teflon Feedthrough for Coupling Optical Fibers into Ultrahigh Vacuum Systems. Appl. Optics 1998, 10, 1762–1763.
19. Guan, S. H.; Marshall, A. G. Ion Traps for Fourier-Transform Ion-Cyclotron Resonance Mass-Spectrometry—Principles and Design of Geometric and Electric Configurations. Int. J. Mass Spectrom. Ion
Pro-cesses 1995, 146, 261–296.
20. Dashtiev, M.; Zenobi, R. Effect of Buffer Gas on the Fluorescence Yield of Trapped Gas-Phase Ions. J. Am. Soc. Mass Spectrom. 2006, 6, 855– 858. 21. Eggeling, C.; Widengren, J.; Rigler, R.; Seidel, C. A. M. Photobleaching of Fluorescent Dyes Under Conditions Used for Single-Molecule Detec-tion: Evidence of Two-Step Photolysis. Anal. Chem. 1998, 13, 2651–2659. 22. Gauthier, J. W.; Trautman, T. R.; Jacobson, D. B. Sustained Off-Resonance Irradiation for Collision-Activated Dissociation Involving Fourier-Transform Mass-Spectrometry-Collision-Activated Dissociation Technique That Emulates Infrared Multiphoton Dissociation. Anal.
Chim. Acta 1991, 1, 211–225.
23. Little, D. P.; Speir, J. P.; Senko, M. W.; O’Connor, P. B.; McLafferty, F. W. Infrared Multiphoton Dissociation of Large Multiply-Charged Ions for Biomolecule Sequencing. Anal. Chem. 1994, 18, 2809 –2815.
24. Guan, S. H.; Marshall, A. G.; Wahl, M. C. MS/MS with High Detection Efficiency and Mass Resolving Power for Product Ions in Fourier-Transform Ion-Cyclotron Resonance Mass-Spectrometry. Anal. Chem.
1994,8, 1363–1367.
25. Williams, E. R.; Furlong, J. J. P.; McLafferty, F. W. Efficiency of Collisionally-Activated Dissociation and 193-nm Photodissociation of Peptide Ions in Fourier-Transform Mass-Spectrometry. J. Am. Soc. Mass