HAL Id: hal-01483007
https://hal.archives-ouvertes.fr/hal-01483007
Submitted on 6 May 2020HAL is a multi-disciplinary open access archive for the deposit and dissemination of sci-entific research documents, whether they are pub-lished or not. The documents may come from teaching and research institutions in France or abroad, or from public or private research centers.
L’archive ouverte pluridisciplinaire HAL, est destinée au dépôt et à la diffusion de documents scientifiques de niveau recherche, publiés ou non, émanant des établissements d’enseignement et de recherche français ou étrangers, des laboratoires publics ou privés.
Effect of a marine protected area on tropical estuarine
fish assemblages: Comparison between protected and
unprotected sites in Senegal
Oumar Sadio, Monique Simier, Jean-Marc Ecoutin, Jean Raffray, Raymond
Laë, Luis Tito de Morais
To cite this version:
Oumar Sadio, Monique Simier, Jean-Marc Ecoutin, Jean Raffray, Raymond Laë, et al.. Effect of a marine protected area on tropical estuarine fish assemblages: Comparison between protected and unprotected sites in Senegal. Ocean and Coastal Management, Elsevier, 2015, 116, pp.257-269. �10.1016/j.ocecoaman.2015.08.004�. �hal-01483007�
Effect of a marine protected area on tropical estuarine fish
assemblages: Comparison between protected and unprotected
sites in Senegal
Abstract
A comparative study of fish assemblages of a marine protected area and an exploited area was carried out in the Sine Saloum estuary (Senegal, West Africa). Data were collected at these two sites between 2008 and 2011. The two areas are morphologically similar, and comparison of the physicochemical parameters (salinity, transparency, temperature and percentage of saturation of dissolved oxygen) showed that the water masses are similar. The bio-ecological indicators and ecological, trophic and size structures were also compared. Given the environmental similarity of the two sites, their differences in bio-ecological characteristics and fish assemblage organization can be explained by the protection status of the MPA. The species richness and fish abundance per sampling unit were higher in the exploited site, but the mean trophic level and the observed maximum size of individuals were higher in the MPA. Although slightly higher for the MPA, the differences observed for biomass and average size between the two sites were not significant. The beta diversity in the MPA was higher than in the exploited site. The fish assemblage was dominated in terms of abundance by two pelagic herbivores
Ethmalosa fimbriata (80%) and Sardinella maderensis (12.3%) and in terms of biomass by E.
fimbriata (37.4%) and a benthic predator, Arius latiscutatus (23.7%). The assemblage of the MPA had a
marine affinity characterized by the presence of piscivorous or generalist predators; large individuals were not uncommon. In the exploited site, the fish assemblage was relatively stable, dominated in abundance by E. fimbriata (33.4%) and S. maderensis (32.8%). In terms of biomass, a species of mullet, Liza dumerili, ranked first (26.2%), followed by E. fimbriata (22.4%) and S. maderensis
(14.9%). The assemblage in the exploited site had a more estuarine affinity, dominated by detritivorous or phytophagous herbivores. Individuals observed there were mostly of small or medium size. This study confirms that the establishment of MPA is an effective tool for restoring marine biodiversity and trophic structure of fish assemblages.
Oumar Sadio (a), Monique Simier (b), Jean-Marc Ecoutin (c), Jean Raffray (d), Raymond Laë (e), Luis Tito de Morais (d)
(a) Institut de Recherche pour le Développement (IRD), UMR LEMAR 195 (Laboratoire des sciences de l'Environnement MARin), BP 1386 Dakar, Senegal
(b) Institut de Recherche pour le Développement (IRD), UMR MARBEC 248 (MARine Biodiversity, Exploitation and Conservation), Avenue Jean Monnet, CS 30171, 34203 Sète Cedex, France
(c) Institut de Recherche pour le Développement (IRD), UMR LEMAR 195 (Laboratoire des sciences de l'Environnement MARin), Avenue Jean Monnet, CS 30171, 34203 Sète Cedex, France
(d) Institut de Recherche pour le Développement (IRD), UMR LEMAR 195 (Laboratoire des sciences de l'Environnement MARin), BP 70, 29280 Plouzané, France
(e) Institut de Recherche pour le Développement (IRD), UMR LEMAR 195 (Laboratoire des sciences de l'Environnement MARin), Bd Sidi Abderrahman Ain Diab, Casablanca, Morocco
1. Introduction
Marine Protected Areas (MPAs) are one of the sustainable management strategies for marine environments and their biodiversity (Babcock et al ., 1999; Manson and Die, 2001; Halpern, 2003;
Gerber et al ., 2003; Micheli et al ., 2004; Rioja-Nieto and Sheppard, 2008; Muthiga, 2009; Molloy et al
., 2009; Vandeperre et al ., 2011; Gascuel and Henichart, 2011; Ecoutin et al ., 2013). Depending on their objectives, MPAs are classified according to their conservation status, which vary from no-take zones (small or large areas where all extraction activities are strictly prohibited) to multipurpose MPAs, in which human activities are authorized and regulated (Kelleher, 1999; Hilborn et al ., 2004; Claudet, 2006; Di Franco et al ., 2009; Lester et al ., 2009; Gascuel and Henichart, 2011; Al- Abdulrazzak and Trombulak, 2012; Sciberras et al ., 2013). Several approaches exist to assess the effects of MPAs on fish assemblages: studies of their evolution within the MPA (McClanahan et al ., 1999; Mosquera et al ., 2000; Gell and Roberts, 2003; Evans and Russ, 2004; Stobart et al ., 2009; Molloy et al ., 2009;
Babcock et al ., 2010; Hoskin et al ., 2011), comparison before and after closure to fishing (Halpern and Warner, 2002; Albaret et al ., 2005; Claudet et al ., 2010; Moland et al ., 2013; Ecoutin et al., 2014), and comparative studies between areas inside and outside the MPA (Westera et al ., 2003; Kamukuru et al ., 2004; Denny and Babcock, 2004; Abesamis et al ., 2006; Watson et al ., 2009; Sciberras et al ., 2013;
Ecoutin et al ., 2013). In comparative studies, the protective effect on fish assemblages through the creation of an MPA is measured using bio-ecological indicators, which are compared between protected and unprotected areas. This approach has been applied to MPAs in Spain (the marine reserve of the island of Columbretes, Cabo de Palos, Cabrera, Medes, Tabarca, Alicante, Cabo Palos-Islas Hormigas, Cabo de Gata, Aquila, Isla Grosa and Western Mallerca) (García-Charton et al ., 2004; Harmelin-Vivien et al ., 2008; Stobart et al ., 2009; Villamor and Becerro, 2012). The Scandola Reserve and MPAs of Carry-le- Rouet and Banyuls in the French Mediterranean Sea (Francour, 2000; Harmelin-Vivien et al ., 2008), and the Ningaloo Marine Park and Maud Sanctuary in Australia (Westera et al ., 2003; Evans and Russ, 2004) have also been the subject of comparative studies. The Bamboung MPA (Sine Saloum, Senegal, Fig. 1) was established in late 2003 (Breuil, 2011). The extraction of any type of organism is prohibited there, and the MPA is permanently watched by a villager's committee in order to prevent from illegal fishing. A specific characteristic of the Bamboung MPA compared with other MPAs established in Senegal and elsewhere in West Africa, is the regular monitoring of its fish assemblage from the closing off of the area until 2012 (Ecoutin et al ., 2013). Scienti fic monitoring conducted between 2003 and 2007, with 2003 as the base year, focused on the description and evolution of the fish assemblage present in the Bolong Bamboung before and after closure to fishing (Albaret et al ., 2005; Tito de Morais et al ., 2007; Ecoutin et al., 2014). This description was analyzed with regard to other knowledge already available on the Sine Saloum fish assemblages (Diouf, 1996; Simier et al ., 2004; Ecoutin et al ., 2010). Ecoutin et al. (2014) showed that the main effects of the fishing ban after 4 years of closure were an increase of total biomass and of maximal fish length for many species, a
change in the community structure with more small fish, more big fish, and fewer medium sized fish (18 - 25 cm), and an increase of the contribution of marine affinity species and high level predator species. Since 2008, monitoring has focused on the comparison of fish assemblages observed at two geographically close sites with similar environmental characteristics, one protected from fisheries exploitation (MPA), and the other not (Sangako Bolong, exploited site). Using the latter approach, the present study compares the fish assemblages observed during the 2008 - 2011 period between the two sites studied using several bio-ecological indicators. First, the absence of environmental differences that might explain any differences between the two fish assemblages was verified. The second issue addressed was whether the MPA had led to a different fish species composition in the surrounding area. This work specifically sought to identify the components of the assemblage that had benefited from the marine protected area.
2. Materials and methods
2.1. Study sites
The Sine Saloum estuary is located 100 km south-east of Dakar, between 13° 55’ and 14° 10’ North and 16° 03’ and 16° 50’ West (Fig. 1). The system includes three main branches from north to south: the Saloum, the Diomboss and the Bandiala (Simier et al ., 2004). It drains a catchment area of 29 720 km2
and has a water surface area of 900 km2. This is a hyperhaline estuary whose salinity gradient is
reversed during much of the year (increasing upstream from the mouth) (Diouf, 1996; Ecoutin et al ., 2013). The two study sites (Bamboung MPA and Sangako Bolong) are two tributaries of the Diomboss (Fig. 1). The area of the Bamboung MPA covers 68 km2 as a whole. The central marine area, essentially
consisting of Bolong Bamboung and its branches, has a length of 15 km from the confluence with the Diomboss to the mudflats of the forest of Kole, and an area of approximately 4 km2. The maximum
width is about 500 m, while the maximum depth is 15 m. The confluence of Diomboss with Bolong Bamboung is located 17 km from the mouth of the sea of the Diomboss (Albaret et al ., 2005; Ecoutin
et al., 2014). The Sangako Bolong (exploited site) is located upstream of the Diomboss, at 22 km from
the sea. The mouth of Sangako Bolong is about 270 m wide, with a maximum depth of 14 m and an area of about 3.8 km 2. It is about 11 km in length from its junction with the Diomboss up the mudflat of the Sandikoli Forest (Fig. 1) (Ecoutin et al ., 2013).
2.2. Sampling strategy
Methods, techniques, protocols and nature of biological information used in this study were the same in the two sites. They are similar to those used to describe the fish assemblages in Sine Saloum (Diouf, 1996; Simier et al ., 2004; Ecoutin et al ., 2010) or to follow the evolution of the fish assemblages in the MPA since its closure to fishing in 2003 (Albaret et al ., 2005; Tito de Morais et al ., 2007; Ecoutin et
al., 2014). Five stations were selected in the MPA and six in the exploited area (Fig. 1), representing the
different types of habitats encountered. The data were collected during 12 fishing surveys (2008 e 2011) carried out during the three main hydro-climatic seasons of the region in March (end of the cool dry season), June (end of the hot dry season) and October (end of the wet season). Samples were fished
with a purse seine (length 250 m, height 20 m, 14 mm side mesh) (Simier et al ., 2004). The sampling unit was the fishing haul. Each fish sampling station was associated with a hydrological station where salinity, temperature and dissolved oxygen at the surface, as well as transparency were measured. Fish were identified to the species level, counted and weighed (to the nearest gram) for each fishing haul. A sub-sample of 30 individuals per species per fishing haul was measured (fork length for fish with a forked caudal fin with crescent or indented form; total length for species with a rounded caudal fin with a pointed or truncated form; disc width for rays). Species were classified into six of the nine ecological categories of Albaret (1999), which take into account the degree of euryhalinity and the characteristics of their bio-ecological cycle in different estuarine environments of West Africa (Table 1). Species were also classified into seven trophic categories (Table 2) according to their stomach contents and
information available in the literature. The trophic level of each species was taken from Fishbase (Froese and Pauly, 2014).
2.3. Bio-ecological indicators
The bio-ecological indicators calculated for this study were species richness, abundance and biomass, mean size, maximum size and mean trophic level (McClanahan and Mangi, 2004).
2.4. Size structure
The evolution of the size of sh assemblages at both sites were described using the size structure of fish between 2008 and 2011. Individuals were grouped into size classes of 1 cm length. The total numbers of fish per size class were divided by the total number of fishing hauls for each site before being transformed by log(x + 1). Size frequency distributions of the two sites could then be compared. The analysis of size distributions was performed for each site overall and by ecological or trophic
categories. For marine accessory and marine occasional species, the size spectra were not plotted due to very small numbers of individuals.
2.5. Data analysis methods
Environmental data such as bio-ecological indicators, which did not meet the criteria of normality and homogeneity of variances, were compared between the two sites using the Wilcoxon rank sum test (Wilcoxon, 1945). The comparison of the structure of assemblages of the two sites was conducted by a Correspondence Analysis, for which the numbers of species were transformed into log (x þ 1) to stabilize the variances. In order to estimate the beta diversity for the MPA and for the exploited site, the total variance of the species e haul abundance table was computed, using the Hellinger distance
(Legendre and De C aceres, 2013). Statistical processing and graphics were made with R software (R
Core Team, 2014) using the ade4 library for multivariate analysis (Dray and Dufour, 2007). All data used for this study are archived in the PPEAO information system (Simier and Ecoutin, 2012).
3. Results
3.1. Similarity of the aquatic environment between the two study sites
The results of the Wilcoxon test showed no significant difference for the main environmental
parameters between the Bamboung MPA and the exploited site (Sangako Bolong): salinity (p = 0.778), temperature (p = 0.719), transparency (p = 0.478) and oxygen (p = 0.064) (Fig. 2).
3.2. Descriptions of fish assemblages
From the 60 fishing hauls in the MPA and 72 in the exploited site, 64 species belonging to 30 families were identified over the two sites, 37 species being common to both sites (Appendix). Between 2008 and 2011, 54 species belonging to 28 families were identified in the MPA compared with 47 species in 23 families in the exploited site. Of the 54 species in the MPA, 17 species were absent from the
exploited site. Ten of the species in the exploited site were not observed in the MPA (Appendix). In the MPA, the most abundant species were Ethmalosa fimbriata and Sardinella maderensis, which
represented 80% and 12% of the total, respectively, two thirds of the E. fimbriata numbers being observed in 2011. In terms of biomass, E. fimbriata dominated in the MPA, with 37% of the total biomass, followed by Arius latiscutatus (24%). In the exploited site, two species accounted for 66% of the total numbers (E. fimbriata : 33% and S. maderensis : 33%). Liza dumerili ranks first for biomass (26% of the total biomass) followed by E. fimbriata (22%) and S. maderensis (15%).
3.3. Bio-ecological indicators
Mean numbers and mean biomass per haul were about twice as high in the Bamboung MPA as in the exploited site (Table 3), but high inter-haul variability suggested that we should compare the two sites on the basis of the rank distribution, which is less sensitive to outliers than absolute values. The median abundance was about 3 times lower in the MPA than in the exploited site (Table 3) and this difference was significant (Wilcoxon: W = 1508, p = 0.0014). The median biomass, meanwhile, although slightly higher in the MPA is not significantly different (Wilcoxon W = 2217, p = 0.399). Species richness was significantly higher in the exploited site (W = 1280 and p < 0.001), while the median trophic level (W = 2440 and p = 0.030) and maximum size (W = 2803 and p < 0.001) were higher in the MPA. The median size was not significantly different between the two sites (W = 2461 and p = 0.086). The Correspondence Analysis performed on the fauna table of the two sites produced a first factorial plane that explained 16.2% of the total inertia (respectively 9.8% for axis 1 and 6.3% for axis 2). This relatively low value was due to the large size of the data table (64 species over 132 records). The projection of mean points per site shows a contrast between the two sites on axis 1 (Fig. 3a). In
addition, intra-site variability was higher in the MPA than in the exploited site. This was confirmed by a higher total beta diversity in the MPA than in the exploited site, respectively 0.72 and 0.56 on a [0 - 1] scale. In order to aid the reading of the projection of species on this first factorial plane (Fig. 3b), species have been grouped by category on Fig. 3c and d. On the projection of average points by ecological category (Fig. 3c), axis 1 describes an opposition between, on the one hand, the marine species, occasional in estuaries (Mo), marine-estuarine species (ME), and to a lesser extent marine
species, accessory in estuaries (Ma) and estuarine from marine origin species (Em), connected to of the Bamboung MPA and, on the other hand, the strictly estuarine species (Es) and estuarine species from continental origin (Ec) associated to the exploited site. The projection of average points per trophic category (Fig. 3d) distinguishes two groups on axis 1. The first group was formed by the second level piscivorous predators (p2-pi), the first level generalist predators feeding on macro-crustaceans (p1-mc), the second level generalist predators (p2-ge) and the first level predators mainly feeding on
zooplankton (p1-zo) typical of the MPA and situated to the left of the axis 1. The second group was formed by the scavenger or grazer herbivores (he-de) and the herbivores mainly feeding on
phytoplankton (he-ph), typical of the exploited site and situated in the right-hand part of axis 1 (Fig. 3d). Axis 1, which separates the two sites, was therefore simultaneously an axis of ecological
structuring (estuarine affinity vs. marine affinity) and of trophic structure (herbivore vs. predator).3.4. Comparative structure of the fish assemblages
3.5. Ecological structure
As regards to species richness, the assemblage of the Bamboung MPA and that of the exploited site (Sangako Bolong) were mainly composed of species belonging to the category marine-estuarine (ME), accounting for 35% and 30% of the species, respectively, followed by estuarine from marine origin species (Em), which account for 30% of the species at both sites (Table 4). In terms of abundance, the MPA was largely dominated by estuarine from marine origin species (Em) with 83%, followed by marine-estuarine species (ME) with 16%. However, the exploited site was equally dominated by marine-estuarine species (ME) with 46% and estuarine from marine origin species (Em) with 45%. In terms of biomass, estuarine from marine origin species (Em) dominate in the MPA with 54% of the total biomass, followed by marine-estuarine species (ME) with 39%. Similarly, in the exploited site, the estuarine from marine origin species (Em) dominate with 63% of the total biomass, followed by marine-estuarine species (ME) with 26%.
3.6. Trophic structure
As regards species richness, predator species were better represented in the MPA, with 46% second level predators and 41% first level predators (Table 5). In the exploited site, two trophic categories were well represented: the second level generalist predators (p2-ge) with 28% of species and the first level predators mainly benthophagous (p1-bt) with 25% of species. In terms of abundance, the
herbivores mainly feeding on phytoplankton (he-ph) ranked first in the MPA with 80% of the numbers, followed by first level predators mainly feeding on zooplankton (p1-zo) with 13%. In the exploited site, the he-ph category was also dominant in abundance, but with only 35%, followed by the p1-zo
category with 33%, the first level generalist predators feeding on macro-crustaceans (p1- mc) with 18% and the scavenger or grazer herbivores (he-de) with 11%. In terms of biomass, the herbivores mainly feeding on phytoplankton (he-ph) were dominant in the MPA, representing 37% of the total biomass, followed by second level generalist predators (p2-ge) with 31%. In the exploited site, the biomass was highly concentrated in herbivores: scavenger or grazer herbivores (he-de) with 36% and herbivores mainly feeding on phytoplankton (he-ph) with 24%.
3.7. Size spectrum of assemblages
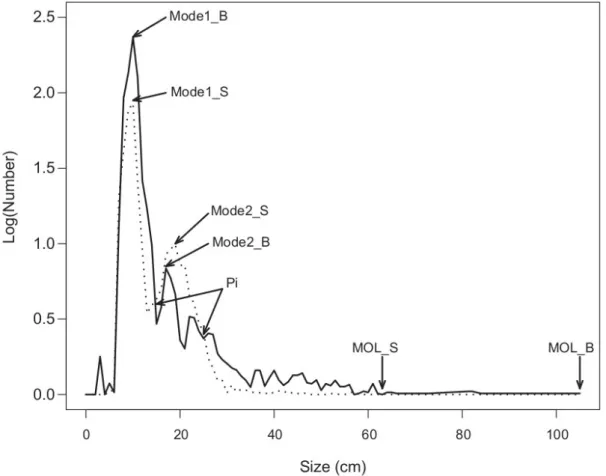
The minimum sizes observed out of all the species were 34 mm (E. fimbriata) in the MPA and 44 mm (Hemicaranx bicolor) in the exploited site. The maximum sizes observed (TMO) were 1055 mm (Pseudotolithus brachygnatus) in the MPA and 635 mm (Trachinotus teraia) in the exploited site. The frequency distribution of size per fishing haul was bimodal in both sites (Fig. 4). The first mode was 10 cm in both sites, but the modal numbers was twice as high in the MPA as in the exploited site. From this first mode, the number by size class declines in a different pattern according to site. In the
exploited site, from 13 cm, numbers per size class increase, resulting in the formation of a second mode centered on the 19 cm class (compared to 17 cm in the MPA), then decrease steadily to the maximum size of 63 cm. The first size class with no members can be seen at 39 cm, and other empty class sizes can be noted between 40 and 63 cm. After the first intersection (14 cm), the size spectrum of the exploited site remains above that of the MPA up to the second intersection (25 cm); the gap between the two curves was particularly large between 18 and 22 cm (Fig. 4). Between the mode of recruitment and the first point of intersection of the two size spectra at 14 cm, the numbers per size class were higher in the MPA than in the exploited site. The first size classes with no members were noted at 57 cm and 63 cm in the MPA. After the second intersection, the MPA spectrum remains above that of the exploited site (Fig. 4).
3.8. Size spectrum of ecological categories
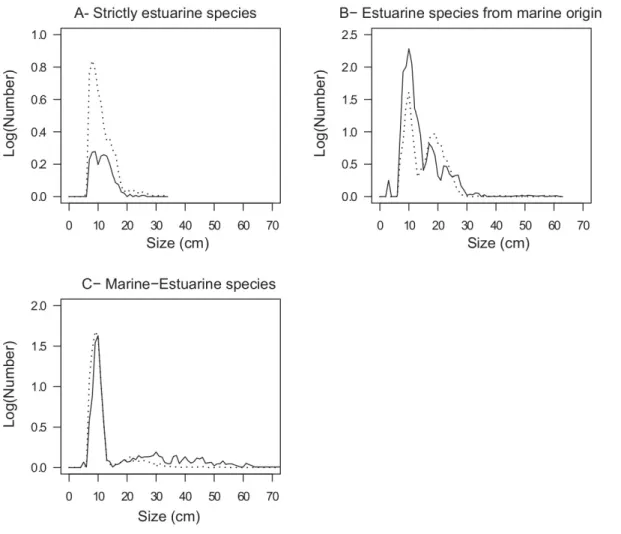
The strictly estuarine species (Es) have a size range between 7 and 26 cm in the MPA and between 7 and 34 cm in the exploited site (Fig. 5a). Both these size spectra have the same shape, with a mode in the form of a plateau between 7 and 19 cm. There were more individuals per size class in the exploited site in the MPA. The size of estuarine species from marine origin (Em) varied between 3 and 61 cm in the MPA and between 5 and 63 cm in the exploited site (Fig. 5b). The frequency distribution of size was bimodal in both sites. In the MPA, the first mode was between 6 and 15 cm and the second
between 15 and 21 cm. In the exploited site, the first and the second modes were between 6 and 13 cm and between 13 and 28 cm, respectively. Between 6 and 15 cm then between 26 and 34 cm, numbers by size class were higher in the MPA than in the exploited site. Few individuals above 34 cm were
observed in the exploited site. The size spectrum of marine-estuarine species (ME) was unimodal and was relatively similar in form for both sites (Fig. 5c). This mode extends from 5 to 15 cm. In the size classes of more than 23 cm, the numbers were higher for MPA and for the exploited site.
3.9. Size spectrum of trophic categories
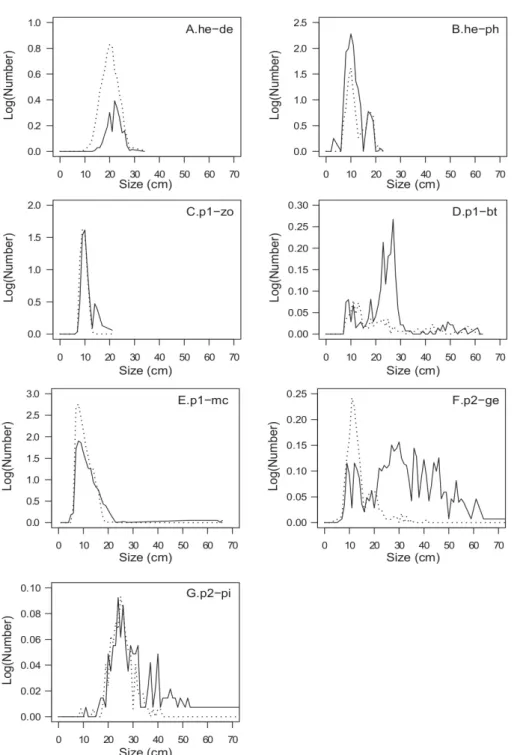
The size spectrum of detritivorous species (he-de) was unimodal for both sites but numbers by size class are lower for the MPA than for the exploited site (Fig. 6a). The size range was relatively similar in both sites: 14 e 29 cm in the MPA, and 10 e 34 cm in the exploited site. The phytoplanktivores (he-ph) had a bimodal size spectrum in both sites and the modes were superimposed (Fig. 6b). The first mode of the size spectrum in the MPA (3 e 15 cm) was wider and more representative than that of the exploited site (7 e 15 cm). The amplitude of the second mode was similar in the two sites with a slightly larger number in the exploited site. For zooplanktivores (p1-zo), the first mode (7 e 13 cm) was
similar for the two sites. Numbers per size class were higher in the exploited site than in the MPA (Fig. 6c). A second mode corresponding to the size range 13 e 21 cm existed in the MPA. The size of the benthivorous species (p1-bt) varied between 7 and 61 cm in the MPA and between 7 and 63 cm in the exploited site (Fig. 6d). Numbers per size class was much higher in the MPA than in the exploited site for size ranges from 20 to 30 cm. The size spectrum of macrophagous predators (p1-mc) was unimodal and similar between the two sites (Fig. 6e). The spectrum of the MPA was below that of the exploited site in the size classes between 6 and 14 cm. The sizes varied between 5 and 66 cm in the MPA and between 6 and 21 cm in the exploited site. The size of second level generalist predators (p2-ge) varied between 7 and 105 cm in the MPA and between 4 and 41 cm in the exploited site (Fig. 6f). The size spectrum was unimodal (7 - 15 cm) in the exploited site but does not present a clear distribution in the MPA, where the size of generalist predators varies between 7 and 105 cm. From 0 to 20 cm, the numbers per size class were higher in the exploited site, while above 20 cm, they were higher in the MPA. The piscivores (p2-pi) size spectrum was unimodal between 15 and 35 cm in both sites (Fig. 6g). Both modes were of similar magnitude, with a higher number of individuals per size class in the MPA. Above 41 cm, the size classes contained zero individuals in the exploited site.
4. Discussion
The objective of this study was to compare fish assemblages between two sites, one where all fishing operations had been prohibited (Bamboung MPA) and the other which was still open to exploitation (Sangako Bolong) during the period 2008 e 2011. Before any analysis was done, a comparative study of environmental parameters was made to identify any possible effects of the environment.
4.1. Aquatic environment
Due to the short distance between the two sites (8 km), the weather conditions (rainfall, wind, solar, tidal, ocean current, air humidity ...) are similar and cannot be the cause of any differences between the two fish assemblages. In addition, there was no significant difference in physical and chemical water parameters between the two study sites, con firming the hypothesis of the homogeneity of
environmental parameters between the MPA and exploited site.
4.2. General characteristics of the fish assemblage at the sites
Total species richness was higher in the MPA (54 species) than in the exploited site (47 species), which is in agreement with the ob- servations of several previous authors (Guidetti et al ., 2005; Neely and Zajac, 2008; Gonzalez-Bergonzeni et al., 2012; Travers et al ., 2012). However, the richness per fishing haul was higher in the exploited site. The MPA was therefore richer but with a lower prob- ability of capturing a particular species in any single haul. This reflects a changing assemblage in the MPA but a more stable one in the exploited site. The beta diversity, higher in the MPA than in the exploited site, confirms this interpretation. Among all the species observed over both sites, more than 50% were observed in the MPA. All the species present in the MPA but not found in the exploited site were high trophic level predators. The average abundance observed in the MPA was higher than that observed in
the exploited site (Johnson, 1999; Williamson et al ., 2004; Kamukuru et al ., 2004; Micheli and
Halpern, 2005; Abesamis et al ., 2006; Watson et al ., 2009; Harmelin-Vivien et al ., 2008; Watson et al ., 2009). This difference is related the increase in the abundance of E. fimbriata in the MPA and its decrease in the exploited site (Ecoutin et al ., 2013). This high average abundance in the MPA was however influenced by a few extremely high values. The median abundance, on the contrary, was higher in the exploited site (100) than in the MPA (35). Average biomass in the MPA was also higher than in the exploited site (Stobart et al ., 2009; Aburto-Oropeza et al ., 2011; Sciberras et al ., 2013), but this difference was not statistically significant. The higher biomass in the MPA can be explained by its high proportion of predatory species (Harmelin-Vivien et al ., 2008). This phenomenon can also explain a higher trophic level in the MPA (Williamson et al ., 2004; Langlois et al ., 2006). Mean fish size did not differ significantly between the two sites despite the presence of large individuals (> 35 cm) higher in the MPA than in the exploited site. This result can be explained by the presence of twice as many small individuals (< 15 cm) in the MPA than in the exploited site. These results were opposite to those found by Gell and Roberts (2003) and Stobart et al . (2009). The higher number of large individuals in the MPA compared with the exploited site explains the higher maximum size in the MPA than in the exploited site (Johnson, 1999; Guidetti et al ., 2005; Floeter et al ., 2006; Stobart et al ., 2009). In summary, the comparison of bio-ecological indicators showed a positive effect of the MPA on total species richness, size-related indicators (Edgar et al ., 2009; Gell and Roberts, 2003; Stobart et al ., 2009), biomass (Tetreault and Ambrose, 2007; Valle and Bayle-Sempere, 2009) and trophic level (Samoilys et al ., 2007). The MPA, however, had a negative effect on abundance (García-Charton et al ., 2004; Parnell et al ., 2005) and on the median value of species richness per fishing haul (Lester et al ., 2009).
4.3. Comparative analysis of ecological and trophic guilds
The fish assemblages of the MPA and of the exploited site are dominated in terms of richness, abundance and biomass by species whose life cycle is spread across both marine and estuarine environments (Albaret et al ., 2005; Ecoutin et al ., 2012, 2014). For the 2008 e 2011 period, the fish assemblage of the two study sites was an assemblage with a marine affinity typical of the Sine Saloum estuary (Diouf, 1996; Simier et al ., 2004). Species completing their whole life cycle in the estuary were almost the same in the two sites, with the exception of Sarotherodon melanotheron only found in the exploited site. The difference in ecological composition can be explained by 8 species (Pseudotolithus
elongatus, Pomadasys jubelini, Arius parkii, Drepane africana, Pseudotolithus brachygnatus,
Polydactylus quadrifilis, Pseudotolithus typus and Trichiurus lepturus) present only in the MPA and 3
species (Strongylura senegalensis, Caranx senegallus and Mugil cephalus) observed only in the exploited site. The species that were different between the two sites were large predators in the MPA, and two small predators and a detritivore in the exploited site. Herbivores and second level predators were at least twice as abundant in the MPA as in the exploited site (Stockwell et al ., 2009); first level predators being more frequent in the latter. In terms of biomass, herbivores, and first and second level predators were more frequently found and more abundant in the MPA than in the exploited site. Moreover, second level predators were 11 times more abundant in the MPA than in the exploited site
(Guidetti, 2007). The results from the combined analysis of ecological and trophic guilds re fl ect the attraction effect of the MPA which, unlike the exploited site, seems to be a favorable area for predation (Mumby et al ., 2006).
4.4. Comparative analysis of size structure
The comparative study of size spectra highlights differences both in terms of the assemblage and of the ecological and trophic guilds. The size spectra of fish assemblages at the two sites evolved in the same way overall, with increasing numbers by size class between 0 and 10 cm and then decreasing numbers beyond 10 cm. Schools of fish were much more common in the MPA than in the exploited site. Small individuals (< 15 cm) were also more numerous in the MPA. The decline in the abundance of the 15 - 25 cm size range was greater there due to higher predation effects in the MPA than in the exploited site (Graham et al ., 2003; Baskett, 2006; Babcock et al ., 2010). This predation pressure was particularly strong on individuals between 18 and 22 cm present in the MPA. The fundamental difference of the size structure of the two assemblages was above the 25 cm size class, as a result of the presence of high trophic level predators in the MPA. These findings are supported by other studies (Guidetti, 2006;
Claudet et al ., 2011; Ecoutin et al ., 2012). The size spectra that best re fl ect the differences between the MPA and the exploited site are those of strictly estuarine species, estuarine species of marine origin and marine estuarine species. Species that complete their entire life cycle in the estuary do not benefit from the protective effect of the MPA, unlike the marine species that spend only a part of their lives in estuaries (Tito de Morais et al ., 2007). Only scavenger or grazer herbivores (he-de) do not benefit from the MPA whatever their size, unlike phytophagous species (he-ph), more abundant in the MPA than in the exploited site for size classes below 15 cm. First level predators over 15 cm also take advantage from the protective effect: benthivores (p1-bt) between 16 and 34 cm, macrophages (p1-mc) over 16 cm and zooplanktivores (p1-zo) over 14 cm were more abundant in the MPA. Benthivores, especially medium to large species, benefit from the non exploitation of benthic organisms (shell fish, worms, small crustaceans, etc.) for their own dietary needs. Finally, second level generalist predators (p2-ge) over 20 cm and fish-eating predators (p2-pi) over 35 cm also benefit from the protective effect of the MPA. These findings are consistent with other studies in marine reserves (Micheli et al ., 2004; Guidetti et al ., 2008). The results of the comparison between the MPA and the exploited site support those obtained in the diachronic study of the Bamboung MPA from 2003 to 2007 (Ecoutin et al., 2014) with regard to size indicators. The modi fication of the MPA assemblage structure was also the same, with an increase in species with a marine affinity and a decrease in species with an estuarine affinity (Faye et al ., 2011). An increase in the number of small and large individuals at the expense of medium-sized ones, which was revealed by the diachronic study (Ecoutin et al., 2014), is confirmed by the present comparative study.
5. Conclusion
The comparison of fish assemblages between the MPA and the exploited site clearly shows an effect of the fishing ban within the MPA. This effect was positive for total richness, biomass, trophic level, average size and maximum size and negative for abundance and richness per fishing haul. However, it
should be noted that the variability of the bio-ecological indicators observed in the MPA was much higher than that observed in the exploited site, indicating a degree of instability in the MPA
assemblage. The size structures show an unequal distribution between the two sites. The medium-size individuals of the assemblage within the MPA did not benefit from the protective effect, probably through predation effects. The greater presence of large fish in the MPA reflects the return of large predators and the positive effect of the closure. The ecological category approach brings out the opposition between the dynamics of species with an estuarine affinity, which lose their importance in the MPA, and those with a marine affinity, which strengthen their central position. Between 2008 and 2011, the MPA opened an estuarine area to the marine component of the Sine Saloum assemblages, including the integration of species rarely seen in estuaries and uncommonly large specimens. The trophic composition analysis of the assemblage of the marine protected area highlights a key role of the predatory component, especially high-level predators; this component was formed by a greater number of species, which were observed more regularly in the MPA. This predatory component consists of individuals of varied sizes, but the closure to fishing accentuated the role played by large predators. Trophic analysis shows the MPA as providing a feeding ground for predators and reflects the attraction effect of the MPA. The combined analysis of the ecological and trophic interpretation shows that the fundamental difference between the two sites lies more in the trophic role of each species than in the specific composition: most significant positive effect of the MPA was not the increase in biodiversity, but the change of the trophic composition of the fish assemblage towards the presence of high-level predators. This study has highlighted the in fl uence of the protection effect on the fish assemblage within an MPA which is an effective tool for restoring marine biodiversity and trophic structure of fish assemblages. From this point of view, estuaries which are areas under strong natural variability and/or anthropogenic perturbations, are determinant for the sensible ecophases of numerous species and must be protected even if the changes due to the variability are difficult to show.
Acknowledgments
The results presented here are from the multidisciplinary pro- gram linked to the projects Narou heuleuk (FFEM/AFD/ONG Oce- anium/IRD), AMPHORE (ANR Biodiversity) and Cepia (AFD/CSRP/ UICN/IRD). The authors are grateful to the fishermen and their team leader Mbaye Mbengue and also to the crew of the Diassanga research vessel and its captain F. Sanseo, without whom these results could not have been obtained. The authors also want to thank the three anonymous reviewers for their constructive comments.
References
• Abesamis, R.A., Russ, G.R., Alcala, A.C., 2006. Gradients of abundance of fish across no-take
marine reserve boundaries: evidence from Philippine coral reefs. Aquat. Conserv. Mar. Freshw. Ecosyst. 16, 349 e 371.
• Aburto-Oropeza, O., Erisman, B., Galland, G.R., Mascare ñ as-Osorio, I., Sala, E., Ezcurra, E.,
• Al-Abdulrazzak, D., Trombulak, S.C., 2012. Classifying levels of protection in Marine Protected
Areas. Mar. Policy 36, 576 e 582.
• Albaret, J.J., 1999. Les peuplements des estuaires et des lagunes. In: L ev eque, C., Paugy, D.
(Eds.), Les poissons des eaux continentales africaines: diversit e, ecologie, utilisation pour l'homme. IRD, Paris, pp. 325 e 350.
• Albaret, J.J., Simier, M., Sadio, O., July 2005. Suivi biologique des peuplements de poissons
d'une aire prot eg ee en zone de mangrove : le bolon de Bamboung (Sine-Saloum, Senegal. Narou Heuleuk (Oceanium/AFD/IRD), Dakar, p. 80. Final report, Convention report. http:/horizon.documentation.ird.fr/exl-doc/pleins_ textes/divers12-05/010055094.pdf.
• Babcock, R.C., Kelly, S., Shears, N.T., Walker, J.W., Willis, T.J., 1999. Changes in community
structure in temperate marine reserves. Mar. Ecol. Prog. Ser. 189, 125 e 134.
• Babcock, R.C., Shears, N.T., Alcala, A.C., Barrett, N.S., Edgar, G.J., Lafferty, K.D.,
McClanahan, T.R., Russ, G.R., 2010. Decadal trends in marine reserves reveal differential rates of change in direct and indirect effects. Proc. Natl. Acad. Sci. U. S. A. 107 (43), 18256 e 18261. http://dx.doi.org/10.1073/pnas. 0908012107.
• Baskett, M.L., 2006. Prey size refugia and trophic cascades in marine reserves. Mar. Ecol.
Prog. Ser. 328, 285 e 293.
• Breuil, C., 2011. Senegal. In: Sanders, J.S., Greboval, D., Hjort, A. (Eds.), Marine protected
Areas: Country Case Studies on Policy, Governance and Institutional Issues. FAO Fish, pp. 72 e 95.
• Claudet, J., 2006. Aires marines prot eg ees et r ecifs arti ficiels : m ethodes d' evaluation,
protocole exp erimentaux et indicateurs (PhD thesis). EPHE- IFREMER, Perpignan, p. 254.
• Claudet, J., García-Charton, J.A., Lenfant, P., 2011. Combined effects of levels of protection
and environmental variables at different spatial resolutions on fish assemblages in a marine protected area. Conserv. Biol. 25, 105 e 114.
• Claudet, J., Osenberg, C.W., Domenici, P., Badalamenti, F., Millazzo, M., Falc on, J.M.,
Bertocci, I., Benedetti-Cecchi, L., García-Charton, J.A., Go ñ i, R., Borg, J.A., Forcada, A., de Lucia, A., P erez-Ruzafa, A., Afonso, P., Brito, A., Guala, I., Le Direach, L., Sanchez-Jerez, P., Somer field, P.J., Planes, S., 2010. Marine reserves: fish life history and ecological traits matter. Ecol. Appl. 20, 830 e 839.
• Denny, C.M., Babcock, R.C., 2004. Do partial marine reserves protect reef fish assemblages?
Biol. Conserv. 116, 119 e 129.
• Di Franco, A., Bussotti, S., Navone, A., Panzalis, P., Guidetti, P., 2009. Evaluating effects of
total and partial restrictions to fishing on Mediterranean rocky-reef fish assemblages. Mar. Ecol. Prog. Ser. 387, 275 e 285.
• Diouf, P.S., 1996. Les peuplements de poissons des milieux estuariens de l'Afrique de l'ouest:
l'exemple de l'estuaire hypersalin du Sine Saloum. Th ese de doctorat. Universit e Montpellier II, Montpellier, p. 267. Th eses et Documents Micro fich es 156, ORSTOM, Paris.
http://horizon.documentation.ird.fr/exldoc/pleins_textes/ pleins_textes_7/TDM_7/010008130.pdf.
• Dray, S., Dufour, A.B., 2007. The ade4 package: implementing the duality diagram for
ecologists. J. Stat. Softw. 22, 1 e 20.
• Ecoutin, J.M., Simier, M., La e, R., Albaret, J.J., Tito de Morais, L., 2010. Changes over a
decade in fish assemblages exposed to both environmental and fishing con- straints in the Sine Saloum estuary (Senegal). Estuar. Coast. Shelf Sci. 87, 284 e 292.
• Ecoutin, J.M., Sadio, O., Simier, M., Raffray, J., Tito de Morais, L., juin 2012. Com- paraison
des peuplements de poissons d'une aire prot eg ee en zone de mangrove (le bolon de Bamboung, Sine Saloum, Senegal) avec les peuplements de deux sites proches non prot eg es de
l'exploitation halieutique, p. 67. Report on Contract n CSRP/AFD/C11/2011. Dakar. http://www.documentation.ird.fr/ hor/fdi:010056414.
• Ecoutin, J.M., B ehagle, N., Brochier, T., Guillard, J., La e, R., Lebourges-Dhaussy, A., Le
Loc'h, F., Raffray, J., Sadio, O., Simier, M., Sow, I., Tito de Morais, L., 2013. L'aire marine prot eg ee communautaire de Bamboung (Sine Saloum) : synth ese 2003 e 2011. IRD, Dakar, p. 170. http://horizon.documentation.ird.fr/exl-doc/ pleins_textes/divers13-12/010060105.pdf.
• Ecoutin, J.M., Simier, M., Albaret, J.J., La e, R., Raffray, J., Sadio, O., Tito de Morais, L., • 2014. Ecological field experiment of short-term effects of fishing ban on fish assemblages in a
tropical estuarine MPA. Ocean Coast. Manag. 100, 74 e 85.
• Edgar, G.J., Barrett, N.S., Stuart-Smith, R.D., 2009. Exploited reefs protected form fishing
transform over decades into conservation features otherwise absent from seascapes. Ecol. Appl. 19, 1967 e 1974.
• Evans, R.D., Russ, G.R., 2004. Larger biomass of targeted reef fish in no-take marine reserves
on the Great Barrier Reef. Aquat. Conserv. Mar. Freshw. Ecosyst. 14, 505 e 519.
• Faye, D., Tito de Morais, L., Raffray, J., Sadio, O., Thiaw, O.T., Le Loch, F., 2011. Structure
and seasonal variability of fish food webs in an estuarine tropical marine protected area (Senegal): evidence from stable isotope analysis. Estuar. Coast. Shelf Sci. 92, 607 e 617.
• Floeter, S., Halpern, B.S., Ferreira, C., 2006. Effects of fishing and protection on Brazilian reef
fishes. Biol. Conserv. 128, 391 e 402.
• Francour, P., 2000. Evolution spatio-temporelle a long terme des peuplements de poissons des
herbiers a Posidonia oceanica de la r eserve naturelle de Scandola (Corse, M editerran ee nord-occidentale). Cybium 24, 85 e 95.
• Froese, R., Pauly, D. (Eds.), 2014. FishBase. World Wide Web Electronic Publication. www.
fishbase.org. version (04/2014).
• García-Charton, J.A., P erez-Ruzafa, A., Sanchez-Jerez, P., Bayle-Sempere, J.T., Renones, O.,
Moreno, D., 2004. Multi-scale spatial heterogeneity, habitat structure, and the effect of marine reserves on Western Mediterranean rocky reef fish assemblages. Mar. Biol. 144, 161 e 182.
• Gascuel, D., Henichart, L.M., 2011. Etude sur l' etat de l'art du r ô le des AMP dans la gestion
des p ê ches : volet bio- ecologie. Technical report for the sous commis- sion r egionale des p ê ches, Dakar, Senegal, p. 121.
• Gell, F.R., Roberts, C.M., 2003. benefits beyond boundaries: the fishery effects of marine
• Gerber, L.R., Botsford, L.W., Hastings, A., Possingham, H.P., Gaines, S.D., Palumbi, S.R.,
Andelman, S., 2003. Population models for marine reserve design: a retro- spective and prospective synthesis. Ecol. Appl. 13, 47 e 64.
• Gonzalez-Bergonzoni, I., Meerhoff, M., Davidson, T.A., Teixeira-de Mello, F.,
Baattrup-Pedersen, A., Jeppesen, E., 2012. Meta-analysis shows a consistent and strong latitudinal pattern in fish omnivory across ecosystems. Ecosystems 15, 492 e 503.
• Graham, N.A.J., Evans, R.D., Russ, G.R., 2003. The effects of marine reserve protection on the
trophic relationships of reef fishes on the Great Barrier Reef. Environ. Conserv. 30, 200 e 208.
• Guidetti, P., 2006. Marine reserves reestablish lost predatory interactions and cause community
changes in rocky reefs. Ecol. Appl. 16, 963 e 976.
• Guidetti, P., 2007. Potential of marine reserves to cause community-wide changes beyond their
boundaries. Conserv. Biol. 21, 540 e 545.
• Guidetti, P., Verginella, L., Viva, C., Odorico, R., Boero, F., 2005. Protection effects on fish
assemblages, and comparison of two visual-census in shallow arti ficial rocky habitats in the northern Adriatic Sea. J. Mar. Biol. Assoc. U. K. 85, 247 e 255.
• Guidetti, P., Milazzo, M., Bussotti, S., Molinari, A., Murenu, M., Pais, A., Spano, N., Balzano,
R., Agardy, T., Boero, F., Carrada, G., Cattaneo-Vietti, R., Cau, A., Chemello, R., Greco, S., Manganaro, A., di Sciara, G.N., Russo, G.F., Tunesi, L., 2008. Italian marine reserve effectiveness: does enforcement matter? Biol. Conserv. 141, 699 e 709.
• Halpern, B.S., 2003. The impact of marine reserves: do reserves work and does reserve size
matter? Ecol. Appl. 13 (1), 117 e 137.
• Halpern, B.S., Warner, R.R., 2002. Marine reserves have rapid and lasting effects. Ecol. Lett. 5,
361 e 366.
• Harmelin-Vivien, M., Le Direach, L., Bayle-Sempere, J., Charbonnel, E., García- Charton, J.A.,
Odyf, D., P erez-Ruzafa, A., Renones, O., Sanchez-Jerez, P., Valle, C., 2008. Gradients of abundance and biomass across reserve boundaries in six Mediterranean marine protected areas: evidence of fish spillover? Biol. Conserv. 141, 1829 e 1839.
• Hilborn, R., Stokes, K., Maguire, J.-J., Smith, T., Botsford, L.W., Mangel, M., Orensanz, J.,
Parma, A., Rice, J., Bell, J., Cochrane, K.L., Garcia, S., Hall, S.J., Kirkwood, G.P., Sainsbury, K., Stefansson, G., Walters, K., 2004. When can marine reserves improve fisheries
management? Ocean Coast. Manag. 47, 197 e 205.
• Hoskin, M.G., Coleman, R.A., von Carlshausen, E., Davis, C.M., 2011. Variable popu- lation
responses by large decapods crustaceans to the establishment of a temperate marine no-take zone. Can. J. Fish. Aquat. Sci. 68, 185 e 200.
• Johnson, D.R., 1999. Effectiveness of an existing estuarine no-take fish sanctuary within the
Kennedy Space Center, Florida. N. Am. J. Fish. Manag. 19, 436 e 453.
• Kamukuru, A.T., Mgaya, Y.D., Ohman, M.C., 2004. Evaluating a marine protected area in a
developing country: Ma fia Island Marine Park, Tanzania. Ocean. Coast. Manag. 47 (7 e 8), 321 e 337.
• Kelleher, G., 1999. Guidelines for Marine Protected Areas. World Conservation Union, Gland,
• Langlois, T.J., Anderson, M.J., Babcock, R.C., Kato, S., 2006. Marine reserves demonstrate
trophic interactions across habitats. Oecologia 147, 134 e 140.
• Legendre, P., De C aceres, M., 2013. Beta diversity as the variance of community data:
dissimilarity coef ficients and partitioning. Ecol. Lett. 16, 951 e 963.
• Lester, S.E., Halpern, B.S., Grorud-Colvert, K., Lubchenco, J., Ruttenberg, B.I., Gaines, S.D.,
Airame, S., Warner, R.R., 2009. Biological effects within no-take marine reserves: a global synthesis. Mar. Ecol. Prog. Ser. 384, 33 e 46.
• Manson, F., Die, D., 2001. Incorporating commercial fishery information into the design of
marine protected areas. Ocean Coast. Manag. 44, 517 e 530.
• McClanahan, T.R., Mangi, S.C., 2004. Gear-based management of a tropical artisanal fishery
based on species selectivity and capture size. Fish. Manag. Ecol. 11, 51 e 60.
• McClanahan, T.R., Muthiga, N.A., Kamukuru, A.T., Machano, H., Kiambo, R.W., 1999. The
effects of marine parks and fishing on coral reefs of northern Tanzania. Biol. Conserv. 89, 161 e 182.
• Micheli, F., Halpern, B.S., 2005. Low functional redundancy in coastal marine assemblages.
Ecol. Lett. 8, 391 e 400.
• Micheli, F., Halpern, B.S., Botsford, L.W., Warner, R.R., 2004. Trajectories and cor- relates of
community change in no-take marine reserves. Ecol. Appl. 14, 1709 e 1723.
• Moland, E., Olsen, E.M., Knutsen, H., Garrigou, P., Espeland, S.H., Kleiven, A.R., Andr e, C.,
Knutsen, J.A., 2013. Lobster and cod benefit from small scale northern marine protected areas: inference from an empirical before-after control- impact study. Proc. R. Soc. B 280, 2012 e 2679.
• Molloy, P.P., McLean, I.B., C ô t e, I.M., 2009. Effects of marine reserve age on fish
populations: a global meta-analysis. J. Appl. Ecol. 46, 743 e 751.
• Mosquera, I., C ô t e, I.M., Jennings, S., Reynolds, J.D., 2000. Conservation benefits of marine
reserves for fish populations. Anim. Conserv. 4, 321 e 332.
• Mumby, P.J., Dahlgren, C.P., Harborne, A.R., Kappel, C.V., Micheli, F., Brumbaugh, D.R.,
Holmes, K.E., Mendes, J.M., Broad, K., Sanchirico, J.N., Buch, K., Box, S., Stof fl e, R.W., Gill, A.B., 2006. Fishing, trophic cascades, and the process of grazing on coral reefs. Science 311, 98 e 101.
• Muthiga, N.A., 2009. Evaluating the effectiveness of management of the Malindi- Watamu
marine protected area complex in Kenya. Ocean Coast. Manag. 52, 417 e 423.
• Neely, A.E., Zajac, R.N., 2008. Applying marine protected area design models in large estuarine
systems. Mar. Ecol. Prog. Ser. 373, 11 e 23.
• Parnell, P.E., Lennert-Cody, C.E., Geelen, L., Stanley, L.D., Dayton, P.K., 2005. Effectiveness
of a small marine reserve in southern California. Mar. Ecol. Prog. Ser. 296, 39 e 52.
• R Core Team, 2014. R: a Language and Environment for Statistical Computing. R Foundation
for Statistical Computing, Vienna, Austria. URL. http://www.R- project.org.
• Rioja-Nieto, R., Sheppard, C., 2008. Effects of management strategies on the land- scape
• Samoilys, M.A., Martin-Smith, K.M., Giles, B.G., Cabrera, B., Anticamara, J.A., Brunio, E.O.,
Vincent, A.C.J., 2007. Effectiveness of five small Philippines coral
• reef reserves for fish populations depends on site-specific factors, particularly enforcement
history. Biol. Conserv. 136, 584 e 601. Sciberras, M., Jenkins, S.R., Kaiser, M.J., Hawkins, S.J., Pullin, A.S., 2013. Evaluating the biological effectiveness of fully and partially protected marine areas. Environ. Evidence 2 e 4. http://dx.doi.org/10.1186/2047-2382-2-4.
• Simier, M., Blanc, L., Aliaume, C., Diouf, P.S., Albaret, J.J., 2004. Spatial and temporal
structure of fish assemblages in an “ inverse estuary ”, the Sine-Saloum system (Senegal). Estuar. Coast. Shelf Sci. 59, 69 e 86.
• Simier, M., Ecoutin, J.M., 2012. Syst eme d'informations sur les Peuplements de poissons et la P
ê che artisanale des Ecosyst emes estuariens, lagunaires ou continentaux d'Afrique de l'ouest. Base donn ees. http://www.ppeao.ird.fr/ index.php.
• Stobart, B., Warwick, R., Gonzalez, C., Mallol, S., Diaz, D., Renones, O., Go ñ i, R., 2009.
Long-term and spillover effects of a marine protected area on an exploited fish community. Mar. Ecol. Prog. Ser. 384, 47 e 60.
• Stockwell, B., Jadloc, C.R.L., Abesamis, R.A., Alcala, A.C., Russ, G.R., 2009. Trophic and
benthic responses to no-take marine reserve protection in the Philippines. Mar. Ecol. Prog. Ser. 389, 1 e 15.
• Tetreault, I., Ambrose, R.F., 2007. Temperate marine reserves enhance targeted but not
untargeted fishes in multiple no-take MPAs. Ecol. Appl. 17, 2251 e 2267.
• Tito de Morais, L., Simier, M., Raffray, J., Sadio, O., 2007. Suivi biologique des peuplements de
poissons d'une aire prot eg ee en zone de mangrove : le bolon de Bamboung (Sine-Saloum, Senegal). Final report, Convention report. Narou Heuleuk/AFD/IRD, Dakar, p. 23. July 2005. http://www.documentation.ird.fr/ hor/fdi:010055076.
• Travers, M.J., Potter, I.C., Clarke, K.R., Newman, S.J., 2012. Relationships between latitude
and environmental conditions and the species richness, abundance and composition of tropical fish assemblages over soft substrata. Mar. Ecol. Prog. Ser. 446, 221 e 241.
• Valle, C., Bayle-Sempere, J.T., 2009. Effects of a marine protected area on fish assemblages
associated with Posidonia oceanica seagrass beds: temporal and depth variations. J. Appl. Ichthyol. 25, 537 e 544.
• Vandeperre, F., Higgins, R.M., Sanchez-Meca, J., Maynou, F., Go ñ i, R., Martin-Sosa, P., P
erez-Ruzafa, A., Afonso, P., Bertocci, I., Crec'hriou, R., D'Anna, G., Dimech, M., Dorta, C., Esparza, O., Falc on, J.M., Forcada, A., Guala, I., Le Direach, L., Marcos, C., Ojeda-Martínez, C., Pipitone, C., Schembri, P.J., Stelzenmüller, V., Stobart, B., Santos, R.S., 2011. Effects of no-take area size and age of marine protected areas on fisheries yields: a meta-analytical
approach. Fish Fish. 12, 412 e 426.
• Villamor, A., Becerro, M.A., 2012. Species, trophic and functional diversity in marine protected
and non-protected areas. J. Sea Res. 73, 109 e 116.
• Watson, D.L., Anderson, M.J., Kendrick, G.A., Nardi, K., Harvey, E.S., 2009. Effects of
Abrolhos Islands, Western Australia. Mar. Ecol. Prog. Ser. 384, 241 e 249. http://dx.doi.org/10.3354/meps08009.
• Westera, M., Lavery, P., Hyndes, G., 2003. Differences in recreationally targeted fishes between
protected and fished areas of a coral reef marine park. J. Exp. Mar. Biol. Ecol. 294, 145 e 168.
• Wilcoxon, F., 1945. Individuals comparison by ranking methods. Biomet. Bull. 1, 80 e 83. • Williamson, D.H., Russ, G.R., Ayling, A.M., 2004. No-take marine reserves increase abundance
and biomass of reef fish on inshore fringing reefs of the Great Barrier Reef. Environ. Conserv. 31 (2), 149 e 159.
Figures, tables and appendix
Fig. 1. The estuary of the Sine Saloum in Senegal. Location of the two study sites (Bamboung MPA and Sangako bolong), MPA limits and position of the sampling stations.
Fig. 2. Variability of environmental parameters in Bamboung MPA (BBG) and Sangako Bolong (SNK) for the period 2008-2011. The black dots superimposed to the box-and-whiskers plots represent mean values.
Fig. 3. Correspondence Analysis on Bamboung MPA (BBG) and exploited site (SNK): 132 samples - 64 species on the 1-2 factorial plane. (a) projection of samples with average points per site; (b) projection of species; (c) projection of species with average points per ecological category; (d)
projection of species with average value per trophic category. Descriptions of ecological categories and trophic categories are given in Tables 1 and 2, respectively.
Fig. 4. Size spectrum of fish assemblages of the MPA (solid lines) and exploited site (dashed). MOL_B = maximum size observed in the MPA and MOL_S = maximum size observed in the exploited site, Mode1_B = Recruiting mode in the MPA, Mode1_S = Recruiting mode in the exploited site, Mode2_B = second mode in the MPA, Mode2_S = second mode in the exploited site and Pi = intersection points of the two spectra.
Fig. 5. Size spectrum of ecological classes for each study site (solid line: MPA, dashed line: exploited site). (a) Strictly estuarine species, maximum observed length = 34 cm; (b) Estuarine species from marine origin, maximum observed length = 63 cm; (c) Marineeestuarine species. The distribution is truncated at 70 cm.
Fig. 6. Size spectrum of trophic categories for each study site (solid line: MPA, dashed line: exploited site). (a) Scavenger or grazer herbivores, maximum observed length = 34 cm; (b) Herbivores mainly feeding on phytoplankton or micro-phytoplankton, maximum observed length = 23 cm; (c) First level predators, mainly feeding on zooplankton, maximum observed length = 21 cm; (d) First level
predators, mainly benthophagous, maximum observed length = 63 cm; (e) First level generalist predators, maximum observed length = 66 cm; (f) Second level generalist predators, maximum
observed length = 105 cm; (g) Second level piscivorous predators, maximum observed length = 92 cm. The distribution is truncated at 70 cm.
Table 1
Bio-ecological categories observed in the Bamboung MPA and Sangako Bolong (after Albaret, 1999).
Table 2
Trophic groups used in the study of the Bamboung MPA and Sangako Bolong.
Table 3
Inter-site comparison of bio-ecological indicators per fishing haul for the period 2008-2011 (BBG, Bamboung MPA and SNK, exploited site). (CV, coefficient of variation).
Table 4
Total richness (%), abundance (%) and biomass (%) per fishing haul and ecological category (see Table 1 for codes) in both study sites, 2008-2011.
Table 5
Richness (%), abundance (%) and biomass (%) per fishing haul and trophic category (see Table 2 for codes) in both study sites, 2008-2011.
APPENDIX
List of the 64 species observed in Bamboung MPA and Sangako Bolong (exploited site) between 2008 and 2011. Percentage of abundance (%Abun) and biomass (%Biom) with the name of the family, species code, ecological category (Ecol. Cat., see Table 1) and trophic category (Troph. Cat., see Table 2) (*, value < 0.01%).