HAL Id: hal-03208693
https://hal.archives-ouvertes.fr/hal-03208693
Submitted on 27 Apr 2021
HAL is a multi-disciplinary open access
archive for the deposit and dissemination of sci-entific research documents, whether they are pub-lished or not. The documents may come from teaching and research institutions in France or abroad, or from public or private research centers.
L’archive ouverte pluridisciplinaire HAL, est destinée au dépôt et à la diffusion de documents scientifiques de niveau recherche, publiés ou non, émanant des établissements d’enseignement et de recherche français ou étrangers, des laboratoires publics ou privés.
Distributed under a Creative Commons Attribution - NonCommercial - NoDerivatives| 4.0 International License
Assessment of the efficiency of three sampling methods
for the recovery of soil charcoals in tropical
anthropogenic sites
Stéphanie Bodin, Thomas Feiss, Jean-François Molino, Laurent Bremond
To cite this version:
Stéphanie Bodin, Thomas Feiss, Jean-François Molino, Laurent Bremond. Assessment of the efficiency of three sampling methods for the recovery of soil charcoals in tropical anthropogenic sites. Quaternary International, Elsevier, 2021, 595, pp.145-154. �10.1016/j.quaint.2021.04.023�. �hal-03208693�
Assessment of the efficiency of three sampling methods for the recovery of soil charcoals in
1
tropical anthropogenic sites
2
Stéphanie C. Bodin*1,2, Thomas Feiss3, Jean-François Molino2, and Laurent Bremond1,4
3 4
1ISEM, Université Montpellier, CNRS, EPHE, IRD, Montpellier, France
5
2AMAP, IRD, CIRAD, CNRS, INRA, Université Montpellier, Montpellier, France
6
3Université de Lorraine, AgroParisTech, INRAE, UMR 1434 SILVA, Nancy, France
7
4École Pratique des Hautes Études, PSL University, Paris, France
8 9
Institut des Sciences de l’Évolution (ISEM) 10
UMR 5554 | Université de Montpellier | CNRS | IRD | EPHE 11
Place Eugène Bataillon | Cc 065 12
34095 Montpellier cedex 05 | France 13
s.bodin90@gmail.com 14
Abstract
15
The recovery and identification of wood charcoals from soil not associated to archaeological 16
excavation is called pedoanthracology. Researchers in this field use different sampling methods, and 17
only one study, in a temperate context, has compared their efficiency so far. In this paper, we 18
compare the efficiency of three sampling methods on charcoal concentration (> 4 mm) and on 19
taxonomic representativeness in a tropical environment for the first time. These methods are pit 20
sampling, auger sampling and opportunistic handpicking of charcoal on tree uprooted mounds or in 21
the soil excavated during the digging of a pit. Our results suggest that the two digging methods (pit 22
and auger) allow to recover similar charcoal concentrations whatever the site and the depth under 23
consideration. But as expected, the charcoal concentration of a site depends on its history (e.g. type 24
of activity). We also show that the estimation of the minimal sampling effort required to obtain 25
taxonomically representative assemblages, in terms of number of charcoals and of auger samplings, 26
varied greatly depending on the site and on the presence of overrepresented taxa. Finally, our results 27
show that auger cores were often monospecific (34 %). Nevertheless, they allowed to recover 28
different taxa from the pit method, with 18 to 21 % of the taxa exclusive to the first method and 30 29
to 40 % of the taxa exclusive to the second one in the sites under consideration. Charcoals from 30
opportunistic handpicking also allowed to improve the taxonomic diversity of the whole assemblage 31
of a site with 5 to 15 % of the taxa being exclusive to this method. The three methods are therefore 32
complementary and we suggest to use the three of them to obtain the best taxonomic diversity in an 33
anthracological assemblage and to overcome the specific biases of each method. With this study, we 34
hope that we will help tropical (pedo)anthracologists to optimize charcoal sampling in anthropogenic 35
sites were the sampling design cannot benefit from archaeological excavations. 36
Key words: Pedoanthracology – Sampling design – Tropical forest – Rarefaction curves – 37
Representativeness 38
1. Introduction
39
Anthracology and pedoanthracology are sister archaeobotanical specialties which are used for the 40
reconstruction of past ligneous vegetation through the identification of wood charcoal. The former is 41
in close relation with archaeology since wood charcoals are sampled in known archaeological 42
contexts (Chabal 1997; Heinz and Thiébault 1998; Dotte-Sarout 2017; Bachelet and Scheel-Ybert 43
2017), whilst the latter deals with soil charcoals not associated to archaeological units (Thinon 1978; 44
Carcaillet and Thinon 1996; Scheel-Ybert et al. 2003; Di Pasquale et al. 2008; Talon 2010; Touflan et 45
al. 2010; Nelle et al. 2013). The reliability of anthracological assemblages to reconstruct past ligneous 46
environments has been demonstrated and the representativeness of these assemblages is the 47
subject of an abundant literature (Badal Garcia 1992; Chabal et al. 1999; Scheel-Ybert 2002; Théry-48
Parisot et al. 2010; Chrzazvez et al. 2014; Dotte-Sarout et al. 2015). Nevertheless, studies focusing on 49
the efficiency of the sampling protocols are nearly inexistent, although this is a central issue 50
concerning the representativeness of pedoanthracological assemblages. While anthracological 51
sampling protocols ‘guided’ by the presence of archaeological deposits have been optimized (Chabal 52
et al. 1999), pedoanthracological sampling schemes vary greatly among specialists and, to our 53
knowledge, only one study has addressed this issue (Feiss et al. 2017). Two methods can be used for 54
the systematic sampling of soil charcoals: pit sampling and auger sampling. The first one, which is the 55
most used, consists in sampling soil volumes (usually 10 L or 10 kg) along a soil profile in layers 56
respecting the pedological horizons (Carcaillet and Thinon 1996; Dutoit et al. 2009; Feiss et al. 2017) 57
or in artificial layers of about 10 cm in the tropics where soils horizons (oxisols) are less distinct 58
(Scheel-Ybert et al. 2003; Hubau et al. 2012; Fernandes Caromano et al. 2013; Morin-Rivat et al. 59
2014; 2016; Dotte-Sarout et al. 2015). The dimensions of the pits vary among the studies and can 60
take the form of large trenches of 1 x 2 m wide (Scheel-Ybert et al. 2003; Di Pasquale et al. 2008) or 61
small test-pits of 0.5 m × 0.5 m or 1 x 1 m wide (Dotte-Sarout et al. 2015; Morin-Rivat et al. 2016). 62
The second method, auger sampling, is rarely used alone, i.e. without the pit sampling method 63
(Vleminckx et al. 2014; Feiss et al. 2017). It is often restricted to prospection, i.e. to assess the depth 64
of charcoal layers and the abundance of charcoals, which helps to determine the location for digging 65
a pit (Tardy 1998; Hubau et al. 2012; 2013; Bourland et al. 2015; Dotte-Sarout and Kahn 2017) or to 66
supplement a pit sampling in the deepest layers (Scheel-Ybert et al. 2003). Here again, the number of 67
auger cores and the sampling design differ greatly depending on the environment and the aim of the 68
study. In tropical regions, it is particularly important to develop effective sampling methods because 69
field access is often difficult and environmental constraints are high, therefore sites cannot be easily 70
revisited to supplement an insufficient sampling. 71
In this paper, we compare the efficiency of three sampling methods in a tropical environment for the 72
first time, along the lines of the comparative study by Feiss et al. (2017) in a temperate environment. 73
The three methods are auger sampling, pit sampling (digging methods) and opportunistic 74
handpicking of charcoals during excavations or on uprooted tree mounds. This latter method can be 75
used to prospect sites of interest (Tardy 1998) and as such, it is interesting to estimate its potential in 76
terms of taxonomic coverage. 77
Specifically, we address the following questions: 78
1) is one of the two digging methods more efficient than the other for the recovery of soil charcoals? 79
2) do the site and sampling depth influence the amount of charcoal retrieved with each digging 80
method? 81
3) do any of the three methods yield assemblages with better taxonomic richness? 82
4) do they require the same sampling effort? 83
2. Material and methods
84
2.1.
Study area
85
The fieldwork took place in the Nouragues Natural Reserve, central French Guiana, in 12 sites located 86
near the two base camps ‘Saut Pararé’ (4°02’ N - 52°41’W) and ‘Inselberg’ (4°05’ N - 52°41’W). The 87
prospected sites displayed different patterns of past human occupation in terms of vegetation 88
structure and composition and in terms of archaeological evidences (earthworks, potsherds 89
associated with charcoals, dark earths). Sites 1 and 5 are in Lasiacis thickets, site 9 is in a liana forest, 90
site 7 is at the limit between a Lasiacis thicket and a liana patch and the remaining sites are under 91
forest cover. Site 3 corresponds to a circular anthropogenic ditch circling a hilltop, a type of 92
archaeological earthwork common in French Guiana. Table 1 summarizes the main features of the 93
sites. See also Bodin et al. (2020) for additional information on site location. 94
2.2.
Sampling methods
95
The sampling protocol was formerly described in Bodin et al. (2020). Despite the presence of 96
archaeological artefacts (potsherds) and earthworks in several sites, our approach is 97
pedoanthracologic because the recovery of charcoal fragments did not benefit from archaeological 98
excavations. In sites 1 to 9, we dug 80 x 80 cm pits in which we collected 10 kg of soil in each 10-cm 99
depth layer. We also collected charcoal fragments by hand in the soil excavated during the digging 100
process. Second, in sites where charcoals were abundant enough in the pit (at least a dozen of 101
fragments), we sampled with a soil auger along transects centered on the pit in a 1-ha surface (Fig. 102
1), except for site 3 where we sampled at several points in the ditch. The objective with auger cores 103
was to cover a larger area to better catch taxonomic diversity at the stand scale. The number of 104
auger samples depended on site constraints such as vegetation thickness (pseudo-bamboos in site 1 105
and lianas in site 9 are hard to penetrate) and the presence of potential archaeological artifacts 106
detected by magnetic anomalies (site 8). The sampling depth depended on the depth of the bedrock. 107
For lack of time, the pits at sites 10 to 12 were not sampled, nor were sites 11 and 12 with any 108
digging method. Finally, on sites 9 to 12 we looked for charcoals on all uprooted tree mounds 109
present in the 1-ha surface centered on the pit. This last method was chosen because it was a quick 110
way to obtain qualitative information on sites that we did not have time to fully investigate. For sites 111
1 to 8, searching for charcoals in soil excavated during the digging of the pit is considered to be 112
similar as searching on an uprooted tree mound because it is opportunistic. The different sampling 113
methods applied for each site are showed in Table 1. 114
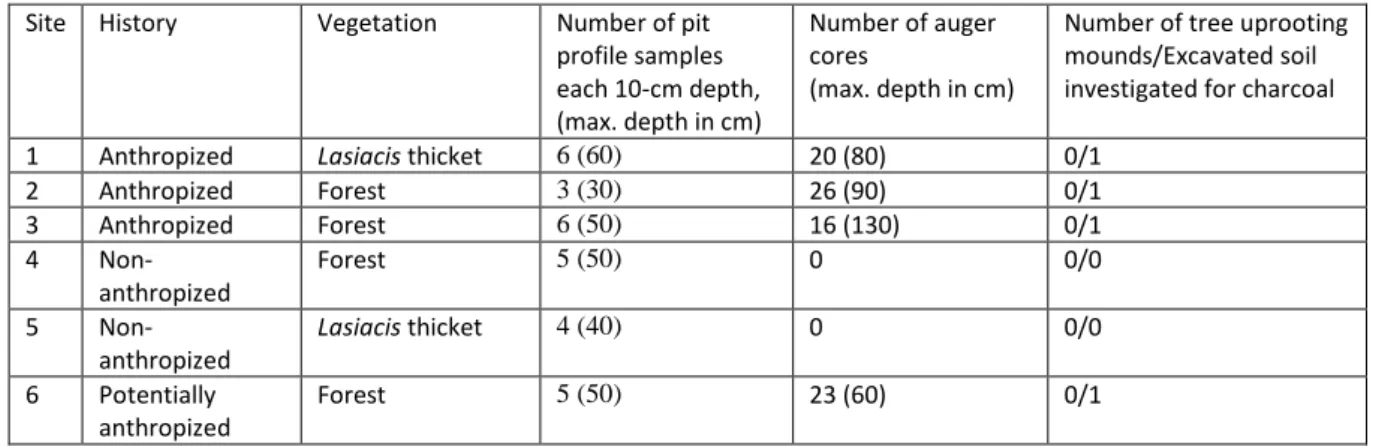
Table 1: history and main vegetation type of the sites investigated and number of samples for each 115
sampling method applied (after Bodin et al. 2020). 116
Site History Vegetation Number of pit
profile samples each 10-cm depth, (max. depth in cm) Number of auger cores (max. depth in cm)
Number of tree uprooting mounds/Excavated soil investigated for charcoal
1 Anthropized Lasiacis thicket 6 (60) 20 (80) 0/1
2 Anthropized Forest 3 (30) 26 (90) 0/1 3 Anthropized Forest 6 (50) 16 (130) 0/1 4 Non-anthropized Forest 5 (50) 0 0/0 5 Non-anthropized Lasiacis thicket 4 (40) 0 0/0 6 Potentially anthropized Forest 5 (50) 23 (60) 0/1
7 Anthropized Lasiacis
thicket/liana forest
5 (50) 0 0/1
8 Anthropized Forest 4 (40) 6 (80) 0/1
9 Anthropized Liana forest 7 (70) 17 (60) 9/0
10 Non-anthropized Forest - 16 (60) 11/0 11 Anthropized Forest - - 15/0 12 Non-anthropized Forest - - 3/0 117
2.3.
Charcoal extraction and identification
118
Soil samples from pit profiles and auger cores were water-sieved in the field to recover charcoal 119
fragments in a 4-mm mesh, a suitable size for charcoal identification, especially in tropical areas 120
(Chabal et al. 1999; Scheel-Ybert 2001). Charcoals were identified with the help of an electronic 121
identification key (Bodin et al. 2019), the InsideWood online database (Wheeler 2011), specialized 122
literature (Détienne et al. 1982; Détienne and Jacquet 1983; Scheel-Ybert and Gonçalves 2017) and 123
reference collections of charred wood from Brazil and French Guiana (Scheel-Ybert 2016). 124
2.4.
Testing the effects of sampling method, sampling depth and site on charcoal
125
concentration
126
The sites considered for statistical analysis were those which were sampled with the same methods, 127
i.e. sites 1, 2, 3, 6, 8 and 9. Sites 4 and 5 did not provide any charcoal fragment. We first tested the 128
correlation between the number of taxa and the number of charcoal fragments using a Spearman 129
test. The idea here was to determine whether we could discuss taxonomic richness given the 130
charcoal richness. We then expressed the charcoal concentration as the total number of charcoal 131
pieces per litre of sieved sediment (from pits and augers) to allow for comparison between all sites. 132
We tested the effect of the sampling method (pit vs. auger cores) on charcoal concentration using a 133
Wilcoxon test. We then tested the effect of sampling depth and of site on charcoal concentration 134
using a Kruskal-Wallis test and performed a Conover post hoc test from the PMCMRplus R package 135
(Pohlert 2020) with a holm correction whenever significant. 136
Finally, we tested the effect of depth and of site on each method using Friedman tests: sites 1, 2, 3, 6, 137
7, 8 and 9 were considered for the pit method and sites 1, 2, 3, 6, 8, 9 and 10 were considered for the 138
auger method (Table 1). In each case, comparisons were made for the same sampling depths, i.e. 139
down to the 30 cm level when pits were included and down to the 60 cm level when comparisons 140
were made for the auger method only, as we dug deeper in the soil with the auger (Table 1). We 141
used the exact all-pairs comparisons test for unreplicated blocked data (Eisinga et al. 2017) from the 142
PMCMRplus R package when the Friedman tests were significant. 143
2.5.
Determining the minimal sampling effort required to obtain a representative
144
assemblage
145
To determine the minimal number of charcoal fragments and the minimal number of auger cores 146
required to obtain a representative assemblage of the floristic diversity, we followed the procedure 147
described in Chao et al. (2014). We established individual-based rarefaction curves of the richest sites 148
(i.e. 1, 2, 3, 9) for each sampling method and sample-based rarefaction curves using the iNEXT 149
function from the iNEXT package (Hsieh et al. 2016). Individual-based curves represent the number 150
of taxa as a function of the number of identifiable charcoal fragments (i.e. excluding unidentifiable 151
ones) whilst sample-based curves represent the number of taxa as a function of the number of 152
sampling units, here defined as the number of auger cores. The minimal sampling effort is 153
determined as the minimal number of charcoal fragments or auger cores required to reach the 154
asymptote, which corresponds to the predicted diversity. Securely identified taxa were merged with 155
their ‘cf.’ analogous before building the curves (e.g. ‘taxon A’ was merged with ‘cf. taxon A’). 156
Finally, we computed the number of taxa recovered exclusively by each sampling method in these 157
sites to assess the complementarity of the methods. 158
These analyses and the following were performed with R software version 3.5.0 (R Core Team 2018). 159
3. Results
160
Charcoal richness is positively correlated with taxonomic diversity (Spearman test: rho = 0.8303; p-161
value = 0.0056). The number of charcoals and identifiable taxa retrieved from each site using each 162
sampling methods is given in Supplementary Information (Tables A.1 and A.2). 163
3.1.
Effect of sampling method on charcoal concentration
164
Due to high variability in charcoal concentration between sites, the results are hereafter given as 165
median ± standard error. We found no difference in charcoal concentration between auger cores and 166
pits: 2 ± 1 vs. 2.7 ± 1.52 charcoals/L (Fig. 2; Wilcoxon test: p-value = 0.6461). 167
3.2.
Effect of sampling depth
168
We found no significant differences in charcoal concentrations between sampling depths when 169
considering the two sampling methods together (Fig. 3A and and Table A.4, Kruskal-Wallis test: p-170
value = 0.1029), or separately (Fig. 3B-C and Table A.4, Friedman test: p-values = 0.7716 for the pits 171
and 0.2095 for the augers). Nevertheless, the level “10-20 cm” tends to be richer in charcoals 172
fragments than the other levels with a higher median, whatever the sampling method under 173
consideration. 174
3.3.
Effect of site
175
When the results of pit and auger methods are pooled, only sites 2 and 8 appear significantly 176
different, the former having a higher charcoal concentration than the latter (Fig. 4A and Table A.3; 177
Kruskal-Wallis test: p-value = 0.0096). We found a difference between sites 2 and 7 when we 178
compared pits only, and between site 8 and sites 2 and 3 when we compared augers only (Fig. 4B-C 179
and Table A.3; Friedman test: p-values = 0.0247 and 0.0016, respectively). There are no other 180
remarkable differences. 181
3.4.
Estimating the minimal sampling effort using rarefaction curves
182
Observed and predicted diversity, and sampling effort required to reach the predicted diversity for 183
the richest sites 1, 2, 3 and 9 are summarized in Table 3. Individual- and sample-based rarefaction 184
curves are presented in Fig. 5. The percentage of the total number of taxa exclusively recovered by 185
each sampling method is presented in Fig. 6. 186
Table 3: outputs from individual- and sample-based rarefaction curves in each site, for each of the 187
three sampling methods and when pooled (‘All’). ‘Exc. soil’ refers to the excavated soil investigated 188
for charcoals with the naked eye. 189
Individual-based Sample-based Sit e Meth od Observ ed diversit y Estimat ed asympto te s. e. Predict ed diversit y Sampling effort (nb of charcoal s)* Observ ed diversit y Estimat ed asympto te s. e. Predict ed diversit y Sampli ng effort (nb of auger cores)* 1 Exc. soil 17 41.615 23.873 41 657 __ __ __ __ __ Pit 26 36.062 8.965 36 1073 __ __ __ __ __ Auger s 13 17.327 4.636 17 76 13 18.819 5.79 9 18 54 All 39 52.944 9.863 52 926 __ __ __ __ __ 2 Exc. soil 5 5.992 2.183 5 131 __ __ __ __ __ Pit 10 30.942 17.198 30 3733 __ __ __ __ __ Auger s 16 40.173 30.699 40 1356 16 50.615 32.1 42 50 331 All 26 123.828 111.36 66 123 19544 __ __ __ __ __ 3 Exc. soil 10 12.213 3.345 12 165 __ __ __ __ __ Pit 20 30.057 8.961 30 1017 __ __ __ __ __ Auger s 14 18.127 4.840 18 409 14 37.438 22.7 56 37 168 All 30 38.615 6.798 38 968 __ __ __ __ __ 9 Moun ds 8 11.765 5.002 11 44 8 __ __ __ __ Pit 25 55.055 28.464 55 2826 __ __ __ __ __ Auger s 14 21.875 7.999 21 99 14 25.765 10.0 86 25 74 All 43 68.657 16.071 68 1192 __ __ __ __ __
*based on the integer part of the estimated asymptote, i.e. the predicted diversity.
190
Overall, the pit method tends to recover more taxa (81) than the auger method (57). The excavated 191
soil/mound method (thereafter exc. soil/mound method) recovered less taxa (42), but with a higher 192
variability among sites. 193
At sites 1, 3 and 9 augers presented a lower observed diversity than pits (13 vs 26, 14 vs 20 and 14 vs 194
25, respectively). Only at site 2 did the augers have a greater observed diversity than the pit (16 vs 195
10). 196
At sites 2, 3 and 9, the exc. soil/mound method showed a lower observed diversity (5, 10 and 8, 197
respectively) than other methods. At site 1, the observed diversity from excavated soil was lower 198
than in the pit (17 vs 26) but higher than in augers (17 vs 13). 199
The sampling effort estimated to reach a plateau varied greatly depending on site and sampling 200
method. We only reached a plateau with the excavated soil from site 2 with a very low diversity of 5 201
taxa for a sampling effort of 131 charcoals. The estimated sampling effort varied from 1017 to 3733 202
charcoals with the pit method, from 76 to 1356 charcoals with the auger method and from 44 to 657 203
with the exc. soil/mound method. 204
Even the pooling of all methods, i.e. the use of as many charcoals as possible, did not allow to reach 205
an asymptote. 206
Sampled-based curves sometimes gave a much higher predicted diversity than individual-based 207
curves: 50 vs 40 for site 2 and 37 vs 18 for site 3 with the auger method. Consequently, this led to a 208
very high estimated sampling effort of 331 auger cores for site 2 and 168 auger cores for site 3. 209
Sampled-based curves of sites 1 and 9 presented a predicted diversity closer to that of individual-210
based curves: 18 vs 17 for site 1 and 25 vs 21 for site 9. The estimated sampling effort for these two 211
sites was consequently much lower than for sites 2 and 3 with 54 auger cores for site 1 and 74 auger 212
cores for site 9. 213
3.5.
Percentage of taxa found exclusively in one or another method
214
At each site, between 5 and 15 % of the taxa were only found through the exc. soil/mounds method 215
(Fig. 6 and Table A.5). In sites 1, 3 and 9, 30 to 40% of the taxa were only found in the pit and 18 to 216
21% were only found in the auger cores. Site 2 shows a different pattern with 50% of the taxa found 217
only in auger cores and 23% found only in the pit. 218
4. Discussion
219
4.1.
Complementarity of sampling methods
220
The observed diversity was lower with the auger method than with the pit method at three sites out 221
of four. The low number of taxa in most auger cores could explain this difference. Indeed, we noticed 222
during charcoal identification that many auger cores contained either a single charcoal and 223
consequently a single taxon or a majority of charcoals belonging to the same taxon: nearly 34 % of 224
the auger cores containing charcoals were monospecific and 25 % contained only one charcoal 225
fragment. This is probably due to the small soil surface covered by an auger core (ca. 40 to 60 cm² 226
depending on devices), which increases the probability of sampling a single individual (e.g. a piece of 227
trunk). Therefore, despite a better spatial coverage on a 1 ha area, the fact that we get few taxa in 228
each auger core did not help to have a higher taxonomic richness than with pits. Only the augers 229
from site 2 allowed to recover a better observed diversity. At this site, the pit assemblage was 230
dominated by two taxa counting together for 97% of all charcoal pieces. In this case, the spatially 231
extended coverage of augers allowed to better catch taxonomic diversity: 50% of the taxa found at 232
this site were exclusive to augers (Fig. 6). In the other sites, the auger method also allowed to recover 233
new taxa that we had not found in pits. In sites 1, 3 and 9, between 18 and 21 % of the taxa were 234
found exclusively in augers. There is a need for other methodologic studies to compare our results. 235
Indeed, the auger method is rarely used in pedoanthracology (Feiss et al. 2017) and particularly in 236
the tropics where we did not find any studies using this method, except for prospection (Tardy 1998; 237
Hubau et al. 2012; Bourland et al. 2015; Dotte-Sarout and Kahn 2017). The exc. soil/mound method 238
also allowed to discover new taxa that we did not recovered with the two other methods. This 239
opportunistic method is not intended to replace the two others because of the bias induced by a 240
naked eye collect. However, our results show that it can be used additively to obtain a 241
supplementary qualitative information. The variability of the observed diversity obtained with this 242
method depends on the presence of monospecific lenses. At site 2, we reached an asymptote 243
because of a high amount of charcoal fragments from the same individual (probably a piece of trunk 244
or branch which was broken during digging). At site 9, we obtained a lower observed diversity than 245
with the excavated soils from site 1 and 3 despite a better spatial coverage (7 sampled mounds) 246
because of the overrepresentation of some taxa. 247
These results suggest that these three methods are complementary for the recovery of charcoal > 4 248
mm. With the pit method, which is a very local sampling point, there is a risk to dig at the location of 249
a monospecific lens of charcoal which can correspond to a single individual (cf. site 2). A similar issue 250
has been pointed by Scheel-Ybert et al (2003), in a site at the ecotone between cerrado and semi-251
deciduous forest in Brazil. In trenches of 1.0 m x 2.0 m large and up to 2.4 m depth, a maximum of 15 252
taxa were identified. One can be surprised by such poor taxonomic diversity in a highly diverse 253
floristic environment, but the authors point out that trees burn were they stand, especially during a 254
natural fire, explaining the feeble amount of taxa discovered in a single sampling point. This could 255
explain what we observed at site 2. In this case, a broader spatial sampling is required to overcome 256
the overrepresentation issue. Even if auger cores are often monospecific and contain few charcoals, 257
almost every new core brings in a new taxon. At site 1, 54 % of the taxa recovered in augers cores 258
were found only once (i.e. in only one core) and this figure reaches 75 % at site 2 and 71 % at sites 3 259
and 9. At sites 2 and 3, characterized by many rare taxa, this resulted in a high predicted diversity 260
and a high estimated sampling effort (sample-based curves) because each new auger core is likely to 261
contain a new taxon. Collecting charcoals on mounds can also allow to increase the taxonomic 262
diversity of a charcoal assemblage of a site (see Tardy 1998), but one has to be careful not to pick 263
only the largest charcoal fragments which can come from the same burnt individual. 264
4.2.
Obtain a representative assemblage in a species-rich area
265
The minimal sampling effort estimated from our data is very high, exceeding 1000 charcoals with the 266
pit method to reach 30 taxa (site 3) and even 3000 when there is an overrepresentation of some taxa 267
in the charcoal assemblage (site 2). With the auger method, 76 to more than 1300 charcoal pieces 268
and 54 to more than 300 auger cores would be required to reach a hypothetic plateau of 17 to 30 269
taxa, depending on taxonomic richness and monospecific concentrations of charcoals. In a temperate 270
environment, where the floristic diversity is weaker, Feiss et al. (2017) estimated the minimal 271
sampling effort to 500 charcoals with the pit method and to 600 charcoals with the auger method. If 272
these figures can be achieved in temperate milieus, most of our estimated minimal sampling efforts 273
are however not realistic both in terms of number of charcoals and number of auger cores, because 274
of the time required to drill and sieve large amounts of soil. Even when considering the three 275
methods together, which can be considered as a greater sampling effort because it multiplies the 276
number of charcoals, the curves did not reach an asymptote (Fig. 5). As a matter of fact, constantly 277
increasing the sampling effort would lead to the collection of more and more taxa and would only 278
push back the hypothetical asymptote (predicted diversity). 279
With an estimated tree diversity of 1,700 native species in French Guiana (Molino et al. 2009), it 280
seems unrealistic to try to get a stabilization of the rarefaction curves, whatever the sampling 281
method under consideration. The sampling effort should simply aim to maximize the number of 282
charcoals collected, which should in turn mechanically maximize taxonomic diversity. This can be 283
achieved by combining pit and auger sampling methods, thereby overcoming their respective biases 284
(monospecific auger cores, spatially limited pits). Now, if it is not possible to estimate a minimum 285
sampling effort based on the extrapolation of rarefaction curves, then how to proceed? 286
The incapacity to reach a plateau with anthracologic data has already been observed in Brazilian 287
coastal environments (Scheel-Ybert 2002) and in tropical forests of New Caledonia (Dotte-Sarout et 288
al. 2015). In these cases, the construction of a Gini-Lorenz curve, which represents the cumulative 289
frequencies of taxa as a function of the relative taxa rank, is an alternative to assess the 290
representativeness of an anthracological assemblage (Chabal et al. 1999; Scheel-Ybert 2002). The 291
intersection between the curve and the second diagonal gives the Gini-Lorenz index which is typically 292
comprised between 28:72 and 22:78 in tropical environments (estimations based on floristic surveys, 293
Scheel-Ybert 2002). An index of 22:78 means that 22 % of the taxa are represented in 78 % of the 294
sampled individuals. When the Gini-Lorenz index of an anthracological assemblage falls within this 295
range, this assemblage can be considered as representative of the past floristic diversity, even if no 296
conclusive plateau was reached with rarefaction or accumulation curves. Therefore, the Gini-Lorenz 297
index may be a good way to assess the representativeness of anthracological assemblages from 298
French Guianan forests as well, and the minimal sampling effort may be estimated as the one 299
required to obtain typical tropical values of the Gini-Lorenz index. According to Scheel-Ybert (2002), 300
this minimal sampling effort would be of 200-300 charcoal fragments per sampling level in a pit or a 301
trench. 302
4.3.
Proposal for an efficient sampling scheme
303
How can the sampling protocol be optimized to get the best taxonomic diversity? According to our 304
results, the charcoal concentration is equivalent between the pit and the auger sampling methods for 305
a same volume of sampled soil (Wilcoxon test). Therefore, both are equally efficient for the recovery 306
of soil charcoals. Nevertheless, our results also show that the two methods should be used together 307
to overcome their respective bias and to get the best picture of the past diversity on a study site. 308
The number of pits or auger cores can be adjusted according to the charcoal richness of a site. 309
Among the 6 sites compared on the basis of their charcoal concentration, whatever the sampling 310
method we saw that some are significantly richer. In these sites, it is worthy to increase the sampling 311
effort to get high diversity assemblages, but in the poorest sites, the effort should be adapted to not 312
lose too much time digging for feeble amounts of charcoals. It is very helpful to have an idea of the 313
charcoal richness of a site before starting systematic digging methods, bearing in mind that, 314
according to our experience in the Nouragues forest, drilling 20 auger cores of 60 cm-depth in a 1-ha 315
area takes about 10 hours, whereas digging and sampling an 80 x 80 pit of the same depth takes ca. 4 316
hours with two people. To quickly assess the charcoal richness of a site before starting any 317
excavation, prospections can be made thanks to small test-pits (Morin-Rivat et al. 2016), auger cores 318
(Hubau et al. 2012; Kahn et al. 2015; Feiss et al. 2017) and investigation of uprooted tree mounds 319
(Tardy 1998) if they are abundant in the site of interest. In French Guiana, Riéra et al. (1989) 320
estimated the windfall frequency at 0.75/ha/yr, 33% of which accounting for uprooted trees. In old-321
growth temperate forests of Czech Republic, for example, the uprooting frequency vary from 0.6 322
(highlands) to 1.9 (mountains) (Šamonil et al. 2017). Investigation of uprooted tree mounds is the 323
fastest method to have a glimpse on charcoal distribution: we estimated that about 3 hours are 324
needed to prospect about ten uprooted mounds in a 1-ha area. 325
We found no statistical evidence to differentiate charcoal richness between sampling levels, but this 326
might be due to a low number of replicates. However, our results show that the soil layer between 327
10 and 20 cm-depth tends to be the richest one. Our charcoal assemblages were dated to the late 328
Holocene (Bodin et al. 2020); in other charcoal studies, the highest charcoal concentration 329
concerning Holocene-dated fragments is often observed in the first 50 cm. Peaks were recorded 330
between 0 and 40 cm depth in temperate zones (Carcaillet 2001; Touflan et al. 2010; Robin et al. 331
2013; Feiss et al. 2017) and between 0 and 50 cm depth in tropical ones (Piperno and Becker 1996; 332
Hubau et al. 2013; Fernandes Caromano et al. 2013; Vleminckx et al. 2014). Variations may depend 333
on the type of soil and on the intensity of soil disturbances or bioturbation. The activity of the 334
pedofauna plays a key role in the accumulation of charcoal and organic matter in the first layers of 335
the soil. In the tropics, termites, ants and earthworms mix old and recent organic matter in soil and 336
contribute to the upward reworking of the buried material (Lee and Wood 1971; Lavelle 1997; Gabet 337
et al. 2003; Topoliantz et al. 2006) which can explain the concentration of charcoal in the upper soil 338
layers. Burrows of larger animals, tree uprooting and tree root activity are also important processes 339
in the mixing of organic matter in soil (Lavelle et al. 1997; Šamonil et al. 2015). To assess the burial 340
depth of charcoal fragments, a quick prospection with auger cores can be done before a systematic 341
sampling. In our case, focusing on these charcoal-rich levels during sampling and not digging too 342
deep would have saved time to make some additional auger cores at the most interesting sampling 343
depths. In our case, most of the information given by anthracological data on past human activity 344
was contained in the first 30 cm of soil (Bodin et al. 2020). Therefore, selecting richest depths for 345
sampling can be enough informative. 346
Depending on the time available for fieldwork and site accessibility, a sampling scheme could be to 347
dig 3 to 5 pits in a site. One pit can be large enough to allow pedological description (e.g. 80 x 80 cm) 348
and the others can be smaller (e.g. 30 x 30 cm). Multiplying the number of pits would allow to 349
overcome spatial heterogeneity issues, as several studies have shown that charcoals deposit 350
heterogeneously in tropical (Vleminckx et al. 2014; Morin-Rivat et al. 2016), boreal (Ohlson and 351
Tryterud 2000) and temperate environments (Eckmeier et al. 2007; Touflan and Talon 2009). If 352
logistical limitations prevent the digging of several pits, then each profile of a same pit can be 353
searched for charcoals to increase the number of samples. Then the sampling can be supplemented 354
by auger cores on a grid superimposed on pits, the spatial coverage of which may depend on the size 355
of the site and its topography, or could be adapted to match that of an existing floristic survey 356
(generally 1 ha for tree inventory plots). As recommended by Feiss et al. (2017) in temperate forests, 357
the auger cores should be sufficiently spaced, i.e. a few meters, to avoid spatial autocorrelation. The 358
number of auger cores can be adapted to vegetation constraints and accessibility (especially in 359
tropical forests). It may also be adjusted according to the volume of soil collected from pits for 360
comparison purposes, as both methods are equally efficient for charcoal recovery. 361
5. Conclusion
362
Our study showed that the two digging methods that we compared – pit and auger sampling – each 363
have their biases, so it can be problematic to choose only one, at least in highly diverse tropical 364
environments. Digging a single pit can be risky, because it may contain an assemblage in which a few 365
taxa are over-represented, an issue than can only be detected after the identification phase in the 366
lab. However, we found that auger cores contained fewer taxa than pits despite a higher sampling 367
coverage, as many cores were monospecific. Nevertheless, our results showed that the two methods 368
are complementary because they allowed to collect different taxa. We therefore suggest combining 369
the two methods to get as diverse anthracological assemblages as possible, by digging several pits to 370
overcome spatial heterogeneity issues and by drilling cores to get a better representativeness of the 371
taxonomic diversity in the tropical forest. The opportunistic harvesting of charcoals during digging or 372
on uprooted tree mounds can also be used to increase the pool of taxa in the anthracological record. 373
This is also a very quick method to get an insight into the charcoal richness of a site, which can be 374
helpful to adjust the sampling effort with the two digging methods. 375
Acknowledgments
376
This study is part of the LongTIme project (Long Term Impact of ancient Amerindian settlements on 377
Guianese forests). We acknowledge an Investissement d’Avenir grant from the Agence Nationale de 378
la Recherche (CEBA: ANR-10-LABX-25-01). We are grateful to all the people who helped during the 379
three fieldwork campaigns: C. Docquier, F. Jeanne, G. Odonne, J.-L. Smock, M.-A. Tareau, M. Rapinski, 380
M. Ayanne, M. Roy and T. Leblanc. We also thank L. Paradis for the realization of Fig. 1 and B. 381
Flotterer, C. Favier, G. le Moguédec and V. Bonhomme for their helpful advices on the analyses 382
conducted in this paper. 383
References
384
Bachelet C, Scheel-Ybert R (2017) Landscape and firewood selection in the Santa Elina rock shelter 385
(Mato Grosso, Brazil) during the Holocene. Quat Int 431:52–60 . 386
https://doi.org/10.1016/j.quaint.2015.12.019 387
Badal Garcia E (1992) L’anthracologie préhistorique : à propos de certains problèmes 388
méthodologiques. Bull Société Bot Fr Actual Bot 139:167–189 389
Bodin SC, Molino J-F, Odonne G, Bremond L (2020) Unraveling pre-Columbian occupation patterns in 390
the tropical forests of French Guiana using an anthracological approach. Veg Hist 391
Archaeobotany 29:567–580 . https://doi.org/10.1007/s00334-019-00767-w 392
Bodin SC, Scheel-Ybert R, Beauchêne J, Molino J-F, Bremond L (2019) CharKey: An electronic 393
identification key for wood charcoals of French Guiana. IAWA J 40:75–91 394
Bourland N, Cerisier F, Daïnou K, Smith AL, Hubau W, Beeckman H, Brostaux Y, Fayolle A, Biwolé AB, 395
Fétéké F, Gillet J-F, Morin-Rivat J, Lejeune P, Tiba EN, Van Acker J, Doucet J-L (2015) How 396
Tightly Linked Are Pericopsis elata (Fabaceae) Patches to Anthropogenic Disturbances in 397
Southeastern Cameroon? Forests 6:293–310 . https://doi.org/10.3390/f6020293 398
Carcaillet C (2001) Are Holocene wood-charcoal fragments stratified in alpine and subalpine soils? 399
Evidence from the Alps based on AMS 14C dates. The Holocene 11:231–242 . 400
https://doi.org/10.1191/095968301674071040 401
Carcaillet C, Thinon M (1996) Pedoanthracological contribution to the study of the evolution of the 402
upper treeline in the Maurienne Valley (North French Alps): methodology and preliminary 403
data. Rev Palaeobot Palynol 91:399–416 404
Chabal L (1997) Forêts et sociétés en Languedoc (Néolithique final, Antiquité tardive). 405
L’anthracologie, méthode et paléoécologie, Editions de la Maison des Sciences de l’Homme. 406
Editions de la Maison des Sciences de l’Homme, Paris 407
Chabal L, Fabre L, Terral JF, Théry-Parisot I (1999) L’anthracologie. In: Bourquin-Mignot C, Brochier J, 408
Chabal L, Crozat S, Fabre L, Guibal F, Marinval P, Richard H, Terral JF, Théry-Parisot I (eds) La 409
botanique. Errance, Paris, pp 43–104 410
Chao A, Gotelli NJ, Hsieh TC, Sander EL, Ma KH, Colwell RK, Ellison AM (2014) Rarefaction and 411
extrapolation with Hill numbers: a framework for sampling and estimation in species 412
diversity studies. Ecol Monogr 84:45–67 . https://doi.org/10.1890/13-0133.1 413
Chrzazvez J, Théry-Parisot I, Fiorucci G, Terral J-F, Thibaut B (2014) Impact of post-depositional 414
processes on charcoal fragmentation and archaeobotanical implications: experimental 415
approach combining charcoal analysis and biomechanics. J Archaeol Sci 44:30–42 . 416
https://doi.org/10.1016/j.jas.2014.01.006 417
Détienne P, Jacquet P (1983) Atlas d’identification des bois de l’Amazonie et des régions voisines. 418
Centre Technique Forestier Tropical, Nogent-Sur-Marne 419
Détienne P, Jacquet P, Mariaux A (1982) Manuel d’identification des bois tropicaux. Tome 3 : Guyane 420
française. Centre Technique Forestier Tropical, Nogent-Sur-Marne 421
Di Pasquale G, Marziano M, Impagliazzo S, Lubritto C, De Natale A, Bader MY (2008) The Holocene 422
treeline in the northern Andes (Ecuador): first evidence from soil charcoal. Palaeogeogr 423
Palaeoclimatol Palaeoecol 259:17–34 424
Dotte-Sarout E (2017) Evidence of forest management and arboriculture from wood charcoal data: 425
an anthracological case study from two New Caledonia Kanak pre-colonial sites. Veg Hist 426
Archaeobotany 26:195–211 427
Dotte-Sarout E, Carah X, Byrne C (2015) Not just carbon: assessment and prospects for the 428
application of anthracology in Oceania: Not just carbon. Archaeol Ocean 50:1–22 . 429
https://doi.org/10.1002/arco.5041 430
Dotte-Sarout E, Kahn JG (2017) Ancient woodlands of Polynesia: A pilot anthracological study on 431
Maupiti Island, French Polynesia. Quat Int 457:6–28 . 432
https://doi.org/10.1016/j.quaint.2016.10.032 433
Dutoit T, Thinon M, Talon B, Buisson E, Alard D (2009) Sampling soil wood charcoals at a high spatial 434
resolution: a new methodology to investigate the origin of grassland plant communities: 435
Sampling soil wood charcoals at a high spatial resolution. J Veg Sci 20:349–358 . 436
https://doi.org/10.1111/j.1654-1103.2009.05403.x 437
Eckmeier E, Rösch M, Ehrmann O, Schmidt MWI, Schier W, Gerlach R (2007) Conversion of biomass 438
to charcoal and the carbon mass balance from a slash-and-burn experiment in a temperate 439
deciduous forest. The Holocene 17:539–542 . https://doi.org/10.1177/0959683607077041 440
Eisinga R, Heskes T, Pelzer B, Te Grotenhuis M (2017) Exact p-values for pairwise comparison of 441
Friedman rank sums, with application to comparing classifiers. BMC Bioinformatics 18:68 . 442
https://doi.org/10.1186/s12859-017-1486-2 443
Feiss T, Horen H, Brasseur B, Lenoir J, Buridant J, Decocq G (2017) Optimal sampling design and 444
minimal effort for soil charcoal analyses considering the soil type and forest history. Veg Hist 445
Archaeobotany 26:627–637 446
Fernandes Caromano C, Cascon LM, Neves EG, Scheel-Ybert R (2013) Revealing Fires and Rich Diets: 447
Macro- and Micro-archaeobotanical Analysis at the Hatahara Site, Central Amazonia. Tipití J 448
Soc Anthropol Lowl S Am 11:40–51 449
Gabet EJ, Reichman OJ, Seabloom EW (2003) The Effects of Bioturbation on Soil Processes and 450
Sediment Transport. Annu Rev Earth Planet Sci 31:249–273 . 451
https://doi.org/10.1146/annurev.earth.31.100901.141314 452
Heinz C, Thiébault S (1998) Characterization and Palaeoecological Significance of Archaeological 453
Charcoal Assemblages during Late and Post-Glacial Phases in Southern France. Quat Res 454
50:56–68 . https://doi.org/10.1006/qres.1998.1978 455
Hsieh TC, Ma KH, Chao A (2016) iNEXT: an R package for rarefaction and extrapolation of species 456
diversity (Hill numbers). Methods Ecol Evol 7:1451–1456 . https://doi.org/10.1111/2041-457
210X.12613 458
Hubau W, Van den Bulcke J, Kitin P, Mees F, Baert G, Verschuren D, Nsenga L, Van Acker J, Beeckman 459
H (2013) Ancient charcoal as a natural archive for paleofire regime and vegetation change in 460
the Mayumbe, Democratic Republic of the Congo. Quat Res 80:326–340 461
Hubau W, Van den Bulcke J, Kitin P, Mees F, Van Acker J, Beeckman H (2012) Charcoal identification 462
in species-rich biomes: A protocol for Central Africa optimised for the Mayumbe forest. Rev 463
Palaeobot Palynol 171:164–178 464
Kahn JG, Dotte-Sarout E, Molle G, Conte E (2015) Mid- to Late Prehistoric Landscape Change, 465
Settlement Histories, and Agricultural Practices on Maupiti, Society Islands (Central Eastern 466
Polynesia). J Isl Coast Archaeol 10:363–391 . 467
https://doi.org/10.1080/15564894.2014.1001922 468
Lavelle P (1997) Faunal Activities and Soil Processes: Adaptive Strategies That Determine Ecosystem 469
Function. In: Advances in ecological research. Academic Press, pp 93–132 470
Lavelle P, Bignell D, Lepage M, Wolters V, Roger P-A, Ineson P, Heal OW, Dhillion S (1997) Soil 471
function in a changing world: the role of invertebrate ecosystem engineers. Eur J Soil Biol 472
33:159–193 473
Lee KE, Wood TG (1971) Termites and soils. Academic Press, London, UK 474
Molino JF, Sabatier D, Prévost MF, Frame D, Gonzalez S, Bilot-Guérin V (2009) Etablissement d’une 475
liste des especes d’arbres de la Guyane française. IRD Cayenne 476
Morin-Rivat J, Biwolé A, Gorel A-P, Vleminckx J, Gillet J-F, Bourland N, Hardy OJ, Smith AL, Daïnou K, 477
Dedry L, Beeckman H, Doucet J-L (2016) High spatial resolution of late-Holocene human 478
activities in the moist forests of central Africa using soil charcoal and charred botanical 479
remains. The Holocene 26:1954–1967 . https://doi.org/10.1177/0959683616646184 480
Morin-Rivat J, Fayolle A, Gillet J-F, Bourland N, Gourlet-Fleury S, Oslisly R, Bremond L, Bentaleb I, 481
Beeckman H, Doucet J-L (2014) New Evidence of Human Activities During the Holocene in the 482
Lowland Forests of the Northern Congo Basin. Radiocarbon 56:209–220 . 483
https://doi.org/10.2458/56.16485 484
Nelle O, Robin V, Talon B (2013) Pedoanthracology: Analysing soil charcoal to study Holocene 485
palaeoenvironments. Quat Int 289:1–4 . https://doi.org/10.1016/j.quaint.2012.11.024 486
Ohlson M, Tryterud E (2000) Interpretation of the charcoal record in forest soils: forest fires and their 487
production and deposition of macroscopic charcoal. The Holocene 10:519–525 488
Piperno DR, Becker P (1996) Vegetational History of a Site in the Central Amazon Basin Derived from 489
Phytolith and Charcoal Records from Natural Soils. Quat Res 45:202–209 . 490
https://doi.org/10.1006/qres.1996.0020 491
Pohlert T (2020) PMCMRplus: Calculate Pairwise Multiple Comparisons of Mean Rank Sums Extended 492
R Core Team (2018) R: A language and environment for statistical computing. R Foundation for 493
Statistical Computing, Vienna, Austria 494
Riéra B, Puig H, Lescure JP (1989) La dynamique de la forêt naturelle. Bois For Trop 219:69–78 495
Robin V, Talon B, Nelle O (2013) Pedoanthracological contribution to forest naturalness assessment. 496
Quat Int 289:5–15 . https://doi.org/10.1016/j.quaint.2012.02.023 497
Šamonil P, Daněk P, Adam D, Phillips JD (2017) Breakage or uprooting: How tree death type affects 498
hillslope processes in old-growth temperate forests. Geomorphology 299:76–84 . 499
https://doi.org/10.1016/j.geomorph.2017.09.023 500
Šamonil P, Daněk P, Schaetzl RJ, Vašíčková I, Valtera M (2015) Soil mixing and genesis as affected by 501
tree uprooting in three temperate forests. Eur J Soil Sci 66:589–603 . 502
https://doi.org/10.1111/ejss.12245 503
Scheel-Ybert R (2002) Evaluation of sample reliability in extant and fossil assemblages. Bar Int Ser 504
1063:9–16 505
Scheel-Ybert R (2001) Man and Vegetation in Southeastern Brazil during the Late Holocene. J 506
Archaeol Sci 28:471–480 . https://doi.org/10.1006/jasc.2000.0577 507
Scheel-Ybert R (2016) Charcoal collections of the world. IAWA J 37:489–505 508
Scheel-Ybert R, Gonçalves TAP (2017) Primeiro Atlas Antracológico de Espécies Brasileiras/First 509
Anthracological Atlas of Brazilian Species. Museu Nacional, Rio de Janeiro 510
Scheel-Ybert R, Gouveia SEM, Pessenda LCR, Aravena R, Coutinho LM, Boulet R (2003) Holocene 511
palaeoenvironmental evolution in the São Paulo State (Brazil), based on anthracology and 512
soil δ13C analysis. The Holocene 13:73–81 . https://doi.org/10.1191/0959683603hl596rp 513
Talon B (2010) Reconstruction of Holocene high-altitude vegetation cover in the French southern 514
Alps: evidence from soil charcoal. The Holocene 20:35–44 515
Tardy C (1998) Paléoincendies naturels, feux anthropiques et environnements forestiers de Guyane 516
Française du tardiglaciaire à l’holocène récent : Approches chronologique et 517
anthracologique. PhD dissertation, Université Montpellier 2 518
Théry-Parisot I, Chabal L, Chrzavzez J (2010) Anthracology and taphonomy, from wood gathering to 519
charcoal analysis. A review of the taphonomic processes modifying charcoal assemblages, in 520
archaeological contexts. Palaeogeogr Palaeoclimatol Palaeoecol 291:142–153 . 521
https://doi.org/10.1016/j.palaeo.2009.09.016 522
Thinon M (1978) pedoanthracologie: une nouvelle methode d’analyse phytochronologique depuis le 523
neolithique. Comptes Rendus Hebd Seances Ser Sci Nat 524
Topoliantz S, Ponge J-F, Lavelle P (2006) Humus components and biogenic structures under tropical 525
slash-and-burn agriculture. Eur J Soil Sci 57:269–278 . https://doi.org/10.1111/j.1365-526
2389.2005.00736.x 527
Touflan P, Talon B (2009) Spatial reliability of soil charcoal analysis: The case of subalpine forest soils. 528
Écoscience 16:23–27 . https://doi.org/10.2980/16-1-3177 529
Touflan P, Talon B, Walsh K (2010) Soil charcoal analysis: a reliable tool for spatially precise studies of 530
past forest dynamics: a case study in the French southern Alps. The Holocene 20:45–52 . 531
https://doi.org/10.1177/0959683609348900 532
Vleminckx J, Morin-Rivat J, Biwolé AB, Daïnou K, Gillet J-F, Doucet J-L, Drouet T, Hardy OJ (2014) Soil 533
Charcoal to Assess the Impacts of Past Human Disturbances on Tropical Forests. PLoS ONE 534
9:e108121 . https://doi.org/10.1371/journal.pone.0108121 535
Wheeler EA (2011) InsideWood – a web resource for hardwood anatomy. IAWA J 32:199–211 536
537
Supplementary material
538
Table A.1: charcoal concentration and number of identifiable taxa recovered in each site investigated 539
with the pit and the auger sampling methods, with respect to the sampling depths and to the volume 540
of soil sampled 541
Si te Depth (cm) Vol. (L) Charcoal concentration (nbtot/L) Nb of identifiable taxa Vol. (L) Charcoal concentration (nbtot/L) Nb of identifiable taxa site1 10 10 2,8 10 4,2 1,67 2 20 10 12,8 22 4,2 2,62 6 30 10 1,3 9 4,05 0,99 4 40 10 0,6 5 3,9 0,51 1 50 10 1,1 4 2,85 0,35 0 60 10 0,4 2 1,65 4,85 4 site2 10 10 26,2 3 5,1 2,94 3 20 10 5,1 8 5,1 5,69 7 30 10 8 2 5,1 2,75 5 40 - - - 4,95 4,44 7 50 - - - 2,85 3,51 5 60 - - - 0,6 8,33 1 site3 10 10 0,6 4 3,75 1,87 1 20 10 6,3 12 3,75 16,27 4 30 10 7,3 10 3,75 2,13 4 40 10 2,4 4 3,75 2,67 5 50 10 0,3 3 3,45 1,74 4 60 - - - 3,45 2,03 2 site6 10 10 0 0 4,95 0,81 2 20 10 0,6 3 4,95 11,92 6 30 10 0,5 3 4,95 1,41 2 40 10 0 0 4,05 0 0 50 10 0 0 3,75 0,8 1 60 - - - 1,5 1,33 1 site7 10 10 0 0 - - - 20 10 0 0 - - - 30 10 0,3 3 - - - 40 10 0 0 - - - 50 10 0,4 2 - - - site8 10 10 0,5 3 0,9 1,11 1 20 10 2,6 7 0,9 0 0 30 10 0 0 0,9 0 0 40 10 0,1 1 0,9 0 0 50 - - - 0,9 0 0 60 - - - 0,75 0 0 site9 10 10 8,9 11 5,1 0,78 2 20 10 4 12 5,1 3,14 4 30 10 2,4 7 5,1 3,14 9 40 10 2,1 5 5,1 0,78 2 50 10 1 5 5,1 0,20 1 60 10 0,3 2 4,2 0,24 0
site1 0 10 - - - 4,8 1,46 1 20 - - - 4,8 1,25 6 30 - - - 4,8 2,08 6 40 - - - 4,8 2,92 3 50 - - - 4,8 1,67 2 60 - - - 4,8 1,04 2 542
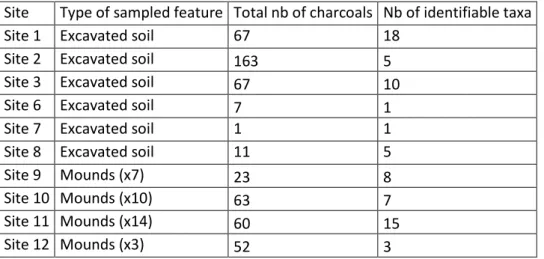
Table A.2: number of charcoals and number of identifiable taxa recovered in excavated pit soils and 543
tree uprooting mounds 544
Site Type of sampled feature Total nb of charcoals Nb of identifiable taxa
Site 1 Excavated soil 67 18
Site 2 Excavated soil 163 5
Site 3 Excavated soil 67 10
Site 6 Excavated soil 7 1
Site 7 Excavated soil 1 1
Site 8 Excavated soil 11 5
Site 9 Mounds (x7) 23 8
Site 10 Mounds (x10) 63 7
Site 11 Mounds (x14) 60 15
Site 12 Mounds (x3) 52 3
545
Table A.3: charcoal concentrations (median ± se) considering the pit and auger sampling methods 546
together and separately. The letters indicate the significant differences according to the Conover 547
post-hoc test for the pit + augers comparison and to the exact all-pairs comparisons test for the pit 548
and augers comparisons (p<0.05) 549
Site Pit and
augers Pit Augers 1 2.14 ± 1.84ab 2.80 ± 3.61ab 1.33 ± 0.69ab 2 5.39 ± 3.64a 8.00 ± 6.60a 3.98 ± 0.87a 3 4.22 ± 2.37ab 6.30 ± 2.09ab 2.08 ± 2.37a 6 0.70 ± 1.89ab 0.50 ± 0.19ab 1.07 ± 1.85ab 7 -- 0.00 ± 0.10b -- 8 0.25 ± 0.42b 0.50 ± 0.80ab 0.00 ± 0.19b 9 3.14 ± 1.12ab 4.00 ± 1.96ab 0.78 ± 0.57ab 10 -- -- 1.56 ± 0.28ab 550
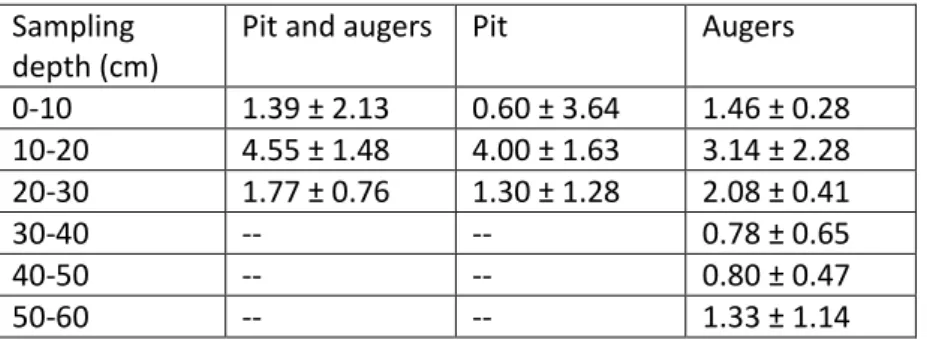
Table A.4: charcoal concentrations (median ± se) of sites 1, 2, 3, 6, 8 and 9 in each sampling depth 551
considering the pit and auger sampling methods together and separately 552
Sampling depth (cm)
Pit and augers Pit Augers
0-10 1.39 ± 2.13 0.60 ± 3.64 1.46 ± 0.28 10-20 4.55 ± 1.48 4.00 ± 1.63 3.14 ± 2.28 20-30 1.77 ± 0.76 1.30 ± 1.28 2.08 ± 0.41 30-40 -- -- 0.78 ± 0.65 40-50 -- -- 0.80 ± 0.47 50-60 -- -- 1.33 ± 1.14 553
Table A.5: number of exclusive taxa recovered with each sampling method for sites 1, 2, 3 and 9 554
Site 1 Site 2 Site 3 Site 9
Exc.soil/mounds 6 3 4 2
Pit 12 6 9 18
Augers 7 13 6 9
Total nb. of taxa 39 26 30 43
Captions
Figure 1: Sampling design representing the different sampling methods used for the recovery of charcoal in this study. Distance between auger samplings differed between sites depending on vegetation and archaeological limitations. The spacing between samples was managed to cover a 1-hectare area. The soil excavated during the digging of the pit and tree uprooting mounds were searched for charcoal fragments in some sites. As charcoals were searched with the naked eye with these two methods, they are considered opportunistic.
Figure 2: Charcoal concentrations with pit and auger sampling methods. Black diamonds indicate the means. Figure 3: Charcoal concentrations in different sampling levels, for pit and auger sampling methods together (A); pit sampling alone (B); auger method alone (C). Black diamonds indicate the means.
Figure 4: Charcoal concentrations in sites investigated with pit and auger sampling methods (A); pit method only (B) and auger method only (C). Letters in diagrams indicate significant differences between sites according to the Conover test (A) and to the exact all-pairs comparisons test (B and C). Black diamonds indicate the means.
Figure 5: Rarefaction curves with 95% confidence intervals for the most charcoal-rich sites 1, 2, 3, and 9 according to each sampling method and to all methods together (“All”). Left panel: individual-based rarefaction curves; right panel: sample-based rarefaction curves (sampling unit = one auger core). A and B: site 1; C and D: site 2; E and F: site 3; G and H: site 9.
Figure 6: Percentage of the total number of taxa recovered exclusively by a sampling method at sites 1, 2, 3 and 9.