HAL Id: hal-02990009
https://hal.inrae.fr/hal-02990009
Submitted on 5 Nov 2020HAL is a multi-disciplinary open access archive for the deposit and dissemination of sci-entific research documents, whether they are pub-lished or not. The documents may come from teaching and research institutions in France or abroad, or from public or private research centers.
L’archive ouverte pluridisciplinaire HAL, est destinée au dépôt et à la diffusion de documents scientifiques de niveau recherche, publiés ou non, émanant des établissements d’enseignement et de recherche français ou étrangers, des laboratoires publics ou privés.
Development time mediates the effect of larval diet on
ageing and mating success of male antler flies in the wild
Christopher Angell, Mathieu Oudin, Nicolas Rode, Brian Mautz, Russell
Bonduriansky, Howard D. Rundle
To cite this version:
Christopher Angell, Mathieu Oudin, Nicolas Rode, Brian Mautz, Russell Bonduriansky, et al.. Devel-opment time mediates the effect of larval diet on ageing and mating success of male antler flies in the wild. Proceedings of the Royal Society B: Biological Sciences, Royal Society, The, 2020, 287 (1938), pp.20201876. �10.1098/rspb.2020.1876�. �hal-02990009�
Development time mediates the effect of larval diet on ageing and mating success of male antler flies in the wild
Christopher S. Angell1, Mathieu J. Oudin1, Nicolas O. Rode1,2, Brian S. Mautz1,3, Russell Bonduriansky4, and Howard D. Rundle1, *
1Department of Biology, University of Ottawa; Ottawa ON, K1N 6N5, Canada
2Current address: CBGP, Univ Montpellier, CIRAD, INRAE, Institut Agro, IRD, Montpellier, France
3Current address: Division of Epidemiology, Department of Medicine, Vanderbilt University Medical
Center, 2525 West End Ave, Suite 0800, Nashville, TN 37203, USA
4Evolution and Ecology Research Centre and School of Biological, Earth and Environmental Sciences,
University of New South Wales, Kensington, Sydney, NSW 2052 Australia
* Corresponding author. E-mail: hrundle@uottawa.ca
Accepted Manuscript
Proceedings of the Royal Society B: Biological Sciences
Abstract
High-quality developmental environments often improve individual performance into adulthood, but allocating toward early-life traits, such as growth, development rate, and reproduction, may lead to trade-offs with late life performance. It is therefore uncertain how a rich developmental environment will affect the ageing process (senescence), particularly in wild insects. To investigate the effects of early-life environmental quality on insect life-history traits, including senescence, we reared larval antler flies (Protopiophila litigata) on four diets of varying nutrient concentration, then recorded survival and mating success of adult males released in the wild. Declining diet quality was associated with slower development, but had no effect on other life-history traits once development time was accounted for. Fast developing males were larger and lived longer, but experienced more rapid
senescence in survival and lower average mating rate compared to slow developers. Ultimately, larval diet, development time, and body size did not predict lifetime mating success. Thus, a rich environment led to a mixture of apparent benefits and costs, mediated by development time. Our results indicate that “silver spoon” effects can be complex and that development time mediates the response of adult life-history traits to early-life environmental quality.
1. Introduction
Early-life resource availability can be a critical contributor to variation in individual performance. This is because organisms must make developmental “decisions” in early life, such as the relative allocation of resources toward energy reserves (which can be mobilized later for metabolic processes) versus body structure (which cannot), which can have long-lasting fitness effects [1,2]. A high-quality
developmental environment is generally predicted to confer lasting benefits on individual performance [3]; this is known as the “silver-spoon” effect [4]. For instance, high quality environments in early life can lead to increased survival [5,6], fecundity [7], mating success [8–10], sperm quality and quantity [8,11,12], and immune function [13,14] in adulthood, compared to individuals from poor environments. However, late-life traits such as senescence—the progressive, intrinsic deterioration of organisms with age which leads to increased mortality and decreased reproductive performance—do not necessarily follow the same silver-spoon pattern as life-history traits expressed during development and early adulthood.
In many cases, senescence rates are affected by energetic and physiological trade-offs with traits expressed in early life. Much of the research on trade-offs between early- and late-life performance has focused on the costs of reproductive investment [15–19]. As future survival is uncertain, individuals with abundant access to resources may allocate highly to early-life performance, leading to more rapid declines with age [17,20–23]. Likewise, but less extensively studied, juvenile growth and development may also influence senescence, and are likely to depend on early-life environmental quality. There is a long theoretical tradition linking rapid growth and development to earlier or faster senescence [24–26]. Faster growth also requires greater energy expenditure, leaving fewer resources available for
phenotypic [21] or genetic correlations [28] between development rate and lifespan, although not all show this pattern [8,29]. Conversely, individuals with high resource acquisition may experience relaxed trade-offs [30] and enjoy high physiological performance throughout their lifespan. Thus, the ultimate effect of early-life environmental quality on senescence is unclear. Two recent meta-analyses failed to detect consistent silver-spoon effects across taxa on longevity or actuarial senescence, and only a small effect on reproductive senescence [31,32]. Nevertheless, some studies have reported significant
increases in lifespan and reduced senescence for individuals that experienced high quality developmental environments [6,9,33].
While studies of insect life histories and senescence in captivity are common (e.g. [34–36]), studies of senescence in wild populations have focused mainly on vertebrates [37,38]. Patterns of survival and performance can differ markedly between wild and captive animals, including insects [39– 41], and it is important to verify lab-based inferences under natural conditions. However, collecting longitudinal data on small, short-lived invertebrates poses significant logistical challenges, and studies of senescence in insects remain scarce, despite the abundance and diversity of these organisms [42]. A few field studies have detected trade-offs linking body size and reproductive effort to senescence rates in insects [18,43], but additional longitudinal studies are needed to understand the causes and fitness consequences of life history variation in wild insects.
To determine the impact of early-life environmental quality on senescence in survival and mating success of an insect under natural conditions, we manipulated diet quality of antler fly larvae (Protopiophila litigata; Diptera: Piophilidae) raised in the lab. We then marked males individually, released them at antlers stationed in a natural forest environment, and monitored their survivorship and mating success in the wild. Antler flies are small (~2 mm) necrophagous flies that oviposit exclusively
on shed moose and deer antlers [44]. Males defend territories in large aggregations on the antler surface [45], and their high site fidelity and short adult lifespan make them well suited for studies of
senescence in the wild because marked males can be released (in the absence of any enclosure) and their subsequent mating success and lifespan observed under entirely natural conditions. Previous studies have demonstrated significant increases in mortality rate (i.e. “actuarial senescence”) and decreases in mating rate (i.e. “reproductive senescence”) with age in wild male antler flies [39,43,46]. However, the effect of larval environment on such senescence remains unknown. In this study, we measured development time, body size, mating rate, and longevity to determine the impact of early-life resource availability on both early- and late-life traits. This allowed us to assess whether a nutrient-rich early-life environment causes a “silver spoon” reduction in senescence, or whether it leads to an
increase in senescence rates through physiological or energetic trade-offs with growth, development rate, or reproduction.
2. Material and Methods (a) Experimental procedure (i) Flies and culture techniques
An outbred laboratory stock population of Protopiophila litigata was created from a large sample (>500) of adult flies collected in the spring and early summer of 2012 at the Algonquin Wildlife Research Station, Algonquin Provincial Park. The population was maintained at the University of Ottawa with non-overlapping generations at 23°C, 60% relative humidity and under a 17:7 L:D photoperiod. The maintenance protocol is described in detail in reference [47]. In brief, adult flies are kept in acrylic cages, from which eggs are collected each generation via an oviposition dish placed in
each cage. Oviposition dishes contain a layer of 2.5 g of ground beef covered by foam sponge moistened with variable amounts of a 20% w/v ground beef solution [38] up to three times/week to maintain moisture. Larvae feed and develop within these dishes, after which they emerge to pupate in a layer of coco peat (Nutri+, India).
(ii) Diet manipulation
Our experiment involved a manipulation of the larval diet to create four treatments (A, B, C, D) that differed in the ratio of ground beef to plant fibre within the oviposition dishes. The A diet used only regular ground beef, the same as the stock population, while diets B, C and D, consisted of 9:1, 8:1, and 7:1 mixtures of ground beef:powdered inulin fibre (Exact, Canada), respectively. All four diets were prepared by homogenising the ground beef, with or without added fibre, using a standard household food blender. Preparations were stored in a freezer at -20°C prior to use. During larval development, all diets also received 1.5 ml of ground beef solution three times per week.
Our experiment used flies that had been reared for one generation on one of these four diets. To obtain these flies, we collected adults from the stock population and randomly placed them in five cages containing 125 individuals of each sex, with access to abundant sugar and water. We replaced dead flies daily to ensure constant sex ratio and density. An oviposition dish containing a sponge was added to each cage for 48 h, after which it was removed and replaced with a new one. Once the oviposition dishes were removed from the cage, each sponge was placed on 2.5 g of one of the four larval diets (ground beef with different levels of fibre or without fibre). Oviposition dishes were collected after each of nine consecutive 48 h laying periods beginning on May 2nd, 2013, creating nine temporal blocks of offspring. As there were five parental cages, one diet treatment within each block
was applied to two oviposition dishes, and the treatments were rotated among cages across blocks. Larval diet treatments were not applied until after the oviposition dishes were removed, preventing females from adjusting their egg laying in relation to diet quality. After application of the diet treatment, oviposition dishes were individually relocated to separate 250 ml mason jars with 10 g of dry coco peat layering the base and a mesh cap. These were incubated as described above for the stock population.
(iii) Field relocation and observation
On May 28th, 2013, all nine larval blocks were relocated to the Wildlife Research Station, Algonquin Provincial Park, Ontario, Canada. All containers sat on a bench in an uninsulated wood cabin with no environmental controls, and hence individuals were exposed to variable temperature, humidity and photoperiod, similar to what would be experienced in the wild. Emerging males were removed daily and individually held in a vial to allow their cuticles to sclerotize. Each male was placed in a holding chamber [48] and photographed in dorsal view using a Canon A640 PowerShot digital camera mounted on a dissecting microscope with an ocular micrometer. From these images, wing length was measured from the tegula to the distal tip of the M vein using ImageJ v1.47 [49]. In this species, wing length is positively correlated with thorax length (Figure S1; Pearson correlation, r = 0.645; p < 0.001) and this measurement is highly repeatable (R = 0.99; [47]). An individual numeric code was painted on each male’s thorax using enamel paint (The Testor Corporation, USA) and a paintbrush with a trimmed tip [48]. Males were immediately released within 1 m of one of two discarded moose antlers (A and B) that were set up on separate 0.8 m high wooden stands in the forest and separated by approximately 50 m distance. Antlers can only support flies for a few years after they are dropped, so supply is limited
and subsequent monitoring is also labor-intensive; two antlers was therefore the most that was feasible. We released 179 males on the larger antler A and 41 males on the smaller antler B (Table S1). Dispersal among antlers is generally low in this species [50], and only 12 individuals were detected to have moved between antlers during the course of the study. Fewer than ten marked males dispersed to a third antler within 50 m, monitored as part of a separate study, and these were returned to antler A or B.
Antlers were surveyed every two hours from 09:00 to 19:00 for 42 consecutive days starting June 11th, 2013. Only the 11:00 observation on July 3rd was missed. During each observation, the identity and mating status (i.e. mating or not) of all marked males was recorded on each antler. The total number of flies and total number of mating pairs (involving marked and/or unmarked males) was also recorded at each observation. Individuals were excluded from the analysis if they failed to survive at least two days after marking, as they may have been injured during the measuring and marking process [43]. Our analyses included 161 males tracked over 251 observation periods (7.04 ± 7.12 SD observations per male on average).
(b) Statistical analyses
All analyses were performed in R v 3.6.3 [51].
(i) Effect of diet on development time and wing length
We first assessed the impact of our diet treatment on egg-to-adult development time and adult body size. To test for the effect of larval diet on development time, we used a linear model (LM) that included effects of diet treatment and larval block as categorical variables. To test for the effects of larval diet treatment on wing length (our proxy for body size), we used a LM that included diet
treatment and larval block, as well as a second LM containing diet treatment, development time (a continuous variable), their interaction, and larval block. We performed type III F-tests using the R package car [52].
(ii) Adult performance and senescence
Development time (number of days between egg laying and adult emergence) varied among diet treatments (see Results), but there was also substantial independent variation within treatment levels such that we were able to discriminate the respective effects of diet and development time on male performance and actuarial and reproductive senescence. These analyses included additional
confounding variables that could potentially affect male survival and mating success (see below for details). Continuous variables were scaled to mean of zero and standard deviation of one prior to analysis [53]. Model selection was carried out using a backward and forward stepwise likelihood ratio test (LRT) procedure, in which a global model was simplified (or a minimal model was complexified) until the model was not significantly improved by removing (or adding) any further terms, based on LRT [54]. If the two selected models differed, a LRT was used to compare them, and the significance of all terms was assessed using LRTs relative to the final model (i.e., the minimal adequate model, including block).
(iii) Actuarial senescence
The effects of diet treatment, development time, and body size on male actuarial senescence were analyzed using parametric survival models, implemented in the R packages survival [55] and flexsurv [56]. We chose this approach over semi-parametric Cox proportional hazards regression because Cox
models only test for differences in overall mortality rate, but cannot detect differences in aging rates among groups. We used an interval-censored survival model [57] in which we assumed death occurred between the age of last observation and the following day. To account for potential confounding effects, our model also included antler (coded as a continuous variable representing the proportion of observations for a given individual that occurred on antler A relative to antler B, to account for males that moved between antlers), average population density, average sex ratio, and average mating rate (all as experienced over the lifetime of a given individual) as covariates. A fixed effect of larval block was included in all models (i.e., was not allowed to drop during model selection). To avoid overfitting given the modest size of this dataset (n = 33-47 individuals in each diet treatment), we did not test
interactions.
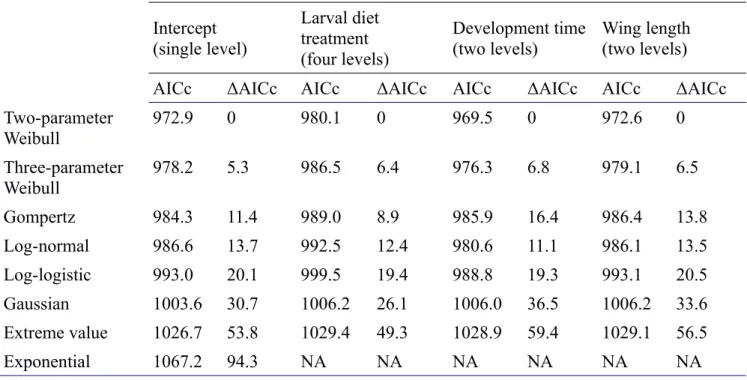
We performed survival model selection in three sequential steps. First, we used the R package MuMIn [58] to select the survival distribution that best fit the data based on the corrected Akaike Information Criterion (AICc; [59]). Second, we performed LRT model selection on the shape parameter, and then third we performed stepwise LRT model selection on the scale parameter. For distribution selection (i.e. step 1), we used the survival package to fit models with exponential, Weibull, Gaussian, logistic, log-normal, log-logistic, and extreme value distributions, and used the flexsurv package to fit the two-parameter Gompertz and three-parameter Weibull models (see Supporting Information). The Weibull distribution consistently provided the best fit to our data independent of effects on shape (Table S2). The scale parameter (λ) of the Weibull model represents the time at which ~63% of the individuals are dead, while the shape (α) describes the change in the age-specific mortality rate, which can remain constant (α = 1) or can increase (α > 1) or decrease (α < 1) with age [60].
Next, we performed LRT model selection on the Weibull shape parameter (i.e. step 2). The survival package allows only a single factor to be fit to the shape parameter, and any number of factors and covariates to be fit to the scale parameter of the Weibull regression. Therefore, development time and wing length, being continuous variables of particular interest, were each binned into two levels corresponding to individuals above vs. below the median value across the whole dataset, allowing us to test their effects, alongside diet treatment, as potential predictors of the shape of actuarial senescence. We then compared models that included either diet, binned development time, binned wing length effects, or a single intercept (i.e. no effect), on the shape parameter (α) using LRT. Models included all single term effects described above (without interactions) on scale. As development time caused the greatest improvement in the model (see Results), we allowed shape values to vary between levels of binned development time for subsequent analyses. Finally, we performed forward and backward stepwise model selection on the scale parameter, considering all variables described above (i.e. step 3). Both selection processes converged on the same minimal adequate model.
(iv) Mating rate and reproductive senescence
To test whether larval diet treatment affected male mating rate and/or reproductive senescence, we used generalized linear mixed-effects models (GLMM) using the R package lme4 [61]. Mating rate,
quantified as the probability of observing a male mating during an observation period, was analyzed using a binomial error distribution with a logit link function. Mating in antler flies lasts 137 ± 52 min [62], and a given male was never observed mating in two consecutive observations (separated by 2 h). We tested for the effects of diet, development time, and wing length on mating rate, as well as the effect of age and its interaction with each of these variables to test for effects on senescence. We also included
potential confounding variables in all our models. Lifespan, antler fly density, and sex ratio (the latter two estimated at the time of observation) were included as covariates, while antler, hour of day, and larval block were included as categorical fixed effects (block was included in all models and not permitted to drop during model selection). We included observation (nested within day) and male identity as random effects in all models to account for non-independence among males during a particular observation and for repeated measures of the same male across observations respectively. Observation periods with zero flies present on an antler were excluded from the analysis, as sex ratio cannot be calculated for these periods, but results were qualitatively similar when they were included (Table S10, S11). The initial model for backward selection contained all terms listed above. Forward selection from an initial model containing the two random effects (observation and male identity) and a fixed effect of block, converged on the same minimal adequate model.
(v) Lifetime mating success
Because males are generally mate-limited, lifetime mating success (LMS) is a major component of male fitness. LMS depends both on an individual’s longevity and their mating rate throughout life. To investigate the effects of diet, development time, and body size on male LMS (the total number of matings observed for each male), we used a generalized linear model with a negative binomial distribution and a log link function, implemented with the “glm.nb” function in the R package MASS [51].The initial model for backward selection contained the following terms: diet treatment,
development time, wing length, antler, lifetime average density, and lifetime average sex ratio, and larval block (as above, block was not permitted to drop during model selection). Forward selection
from an initial model containing only a fixed effect of block converged on the same minimal adequate model.
(vi) Analyses of residual development time and residual wing length
Given collinearity among diet treatment, development time, and wing length (see Results), we performed additional analyses using residual values as a conservative approach to inferring
independent effects [63]. We calculated residual development time from a one-way ANOVA among diets—thereby representing only within-diet treatment variation in development time—and residual wing length from a regression against development time—representing the effect of body size independent of development time. We then performed model selection for survival, mating rate, and LMS as above, using residual development time and residual wing length instead of the ‘raw’ variables. An effect of residual development time and/or residual wing length would infer the importance of that variable even when diet or development time respectively is allowed to account for all shared variation.
3. Results
(a) Effect of diet on development time and wing length
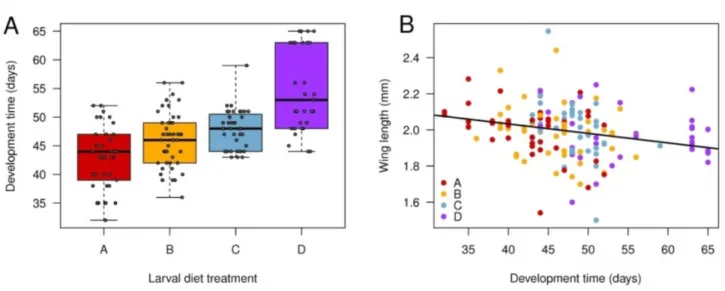
Egg-to-adult development time increased with decreasing diet quality (F3,149 = 23.0, p < 0.001, Fig. 1a), with a 28% increase in mean time between highest- and lowest-quality diets, but there was also
substantial variation within each diet. Larval diet treatment did not significantly influence male wing length when considered alone (F3,149 = 0.431, p = 0.731). When considering development time and diet treatment together, wing length was negatively related to development time (F1,145 = 13.4, p < 0.001;
Fig. 1b), diet quality still did not affect wing length (F3,145 = 1.26, p = 0.289), and there was no interaction between diet and development time on wing length (F3,145 = 1.52, p = 0.212).
Fig. 1. Variation in egg-to-adult development time and wing length within and among larval diet treatments. A, boxplot of development time in each diet. Thick horizontal lines denote the median, boxes demarcate the first and third quartiles and whiskers indicate the minimum and maximum values. B, wing size as a function of developmental time across all larval diet treatments. The regression was fit on the pooled data set (F1,159 = 9.39, p = 0.003 for this simplified regression), as there was no significant difference in intercept or slope among diets. Diet treatments: A (100% ground beef); B (9:1 ratio of ground beef:fibre); C (8:1 ratio of ground beef:fibre); D (7:1 ratio of ground beef:fibre).
(b) Actuarial senescence
A Weibull survival distribution was a consistently best fit to the data (Table S2) and an effect of binned development time on the Weibull shape parameter (α) significantly improved the fit compared to an intercept-only model (LRT: χ21 = 6.01, p = 0.014). Effects on the shape parameter of diet (LRT: χ23 = 0.733, p = 0.865) and wing length (LRT: χ21 = 2.92, p = 0.087) did not improve fit (see also AICc values in Table S2). We therefore included an effect of binned development time on shape in subsequent analyses of scale.
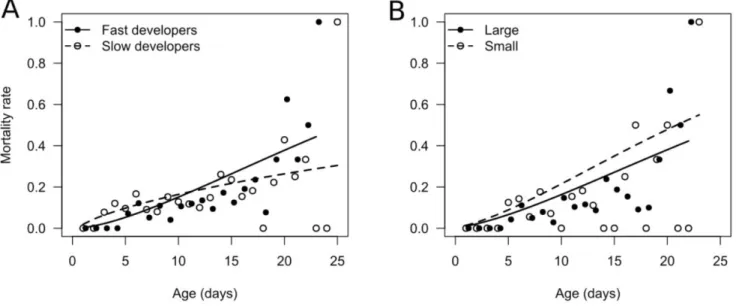
For the scale parameter (λ), both forward and backward model selection converged on a common model that included significant effects on scale of development time (LRT: χ21 = 11.5, p < 0.001) and wing length (LRT: χ21 = 3.85, p = 0.0498), but did not include diet treatment (LRT: χ23 = 3.71, p = 0.294). There was also no significant effect of antler, sex ratio, density, or average mating rate on the scale of actuarial senescence (Table S3a). The development time effects reflected a higher initial mortality rate of slow compared to fast developers, and a steady increase in mortality rate with age for fast developers compared to a convex, decelerating mortality curve in slow developers (Fig. 2a; Table S4; shape parameter α = 2.47 vs. 1.75 for males with a development time below or above the median, respectively). The net outcome of these contrasting effects on shape and scale is that fast developing males tended to live longer (median lifespan, pooling across diets: 11 days [95% CI: 4.0–20.3]) than slow developers (8 days [95% CI: 2.0–20.8]). There was also a small, but significant, trend for larger flies to experience lower mortality and increased lifespan (Fig. 2b).
Fig. 2. The effect of A, egg-to-adult development time and B, wing length (body size) on actuarial senescence (daily mortality rate) in male P. litigata. The effect of development time and wing length on the scale parameter were analyzed as continuous variables, but are plotted as mortality curves for males above or below the median trait value. Symbols are observed daily mortality rates for the two groups, while the lines represent fitted mortality curves based on the best supported Weibull survival model (weighted means across blocks). Due to the shape effect of development time, panel B shows mortality rates for fast developers only.
(c) Mating rate and reproductive senescence
Males that developed more slowly had significantly higher mating rates (LRT: χ21 = 11.5, p < 0.001; Fig. 3; Table S5), but diet treatment did not significantly affect average mating rates (LRT: χ23 = 2.65, p = 0.449) when accounting for the effect of development time. In addition, mating rate was higher at high density and on antler B, but there was no significant relationship between mating rate and wing
length, longevity, hour of day, or block (Table S3b). Mating rate was not affected by age (LRT: χ21 = 1.74, p = 0.187), nor did age interact with either diet treatment, development time, or wing length (all p > 0.05). Therefore, we do not detect reproductive senescence in our data. If an age term is added to the minimal adequate GLMM, the estimate of its effect on mating success is negative, as would be
expected for reproductive senescence, but it is non-significant (minimal adequate model + age: β [logit scale] = -0.112 ± 0.086 SE).
Fig. 3. Relationship between egg-to-adult development time and average mating rate in male antler flies. Points represent lifetime average mating rate for each male and the line represents predicted values from the minimal adequate GLMM (weighted mean across antlers and blocks).
(d) Lifetime mating success
Diet treatment did not affect LMS, nor did development time or wing length (all p > 0.05; Table S3c). LMS was significantly affected by the average fly density (LRT: χ21 = 7.11, p = 0.008) and the average sex ratio experienced over a male’s life (LRT: χ21 = 19.6, p < 0.001), such that males that experienced higher density and less male-biased sex ratios tended to have higher LMS (Table S6). LMS did not differ among blocks or between antlers (Table S3c).
(e) Analyses of residual development time and residual wing length
Our supplementary analysis using residual development time and residual wing length allowed diet treatment to account for all shared variation with development time. Consequently, residual
development time represented only development time variation within diet treatment levels, and residual wing length reflected only size variation that was independent of development time. As
expected, the previously non-significant effect of larval diet became significant when it was allowed to explain all shared variation with development time, with decreasing nutrient concentration being associated with both higher mortality (Table S7a; Table S8) and greater average mating rate (Table S7b; Table S9). However, the previously significant effects of development time persisted such that males with shorter residual development time had reduced mortality (Table S8) and had lower average mating rates (Table S9), consistent with the main analyses. Also consistent with the main analyses, residual wing length had a small effect on survival (Table S7a; Table S8), but not mating success (Table S7b; Table S9). There was again no effect of diet treatment on the shape of actuarial senescence; unlike in the main analysis, however, the effect of residual development time on shape was no longer significant,
although it approached so (p = 0.07; Table S7a). Again, none of the variables of interest influenced LMS (Table S7c).
5. Discussion
In this study, we manipulated diet quality of larval antler flies, Protopiophila litigata, to investigate whether adult performance and lifespan would be improved by high larval diet quality under natural conditions, consistent with the silver spoon hypothesis [3,4], or whether they would decline due to trade-offs with increased allocation toward growth, development rate, or reproduction. Our results revealed complex effects of larval diet: males experiencing a richer diet developed faster, and fast-developing males tended to reach greater adult sizes and lived longer. However, fast developers also tended to have a lower average mating rate than slow developers such that the lifetime mating success of slow vs. fast developers did not differ significantly. When accounting for the effect of development time, larval diet itself did not explain significant variation in adult body size, survival, or mating rate. Furthermore, after accounting for development time, we found no significant effects of body size on mating rate, nor significant trade-offs between mating rate and longevity.
Early-life diet did not have a consistent “silver spoon” effect on all adult traits in male antler flies: fast development, caused at least in part by variation in diet quality among (and/or within) treatments, was associated with extended adult lifespan and larger size, but also more intense
senescence and lower average mating rate. As a result, fast-developing males had similar LMS to slow developers, although they may ultimately have had somewhat higher fitness due to potential differences in postcopulatory performance (see below). Other studies have similarly reported complex phenotypic effects of early life environmental quality: rich larval diets can lead to increased reproductive effort and
a shortened lifespan and/or accelerated senescence [17,20,21,23], although we observed the opposite effect on lifespan and reproduction as previous studies. Given the complex influence of early-life conditions reported in this and other studies, it is not surprising that two recent meta-analyses failed to detect consistent silver spoon effects on lifespan or actuarial senescence in laboratory or wild
populations [31,32].
We did not detect strong evidence of trade-offs between early and late life performance in our antler flies. Fast development was associated with longer lifespan, not shorter, and there was no significant relationship between longevity and average mating rate. Furthermore, body size, which depends on allocation toward growth in the larval stage, was not significantly associated with survival, mating success, or senescence rate. This positive correlation of life-history traits suggests high
variation in resource acquisition and/or genetic quality among individuals [30]. Nevertheless,
development time had opposing effects on average mating rate and survival, which could arise from an underlying survival–reproduction trade-off. This would be consistent with a previous study of this species that reported a significantly higher average mating rate in short-lived males [43]. Although it can be difficult to detect trade-offs in nature, studies of wild vertebrates have often identified trade-offs between early and late life [38]. However, wild field crickets (Gryllus campestris) experience no apparent trade-offs between early reproduction and survival, and only a modest effect of early reproduction on senescence in calling activity [18].
Decreasing diet quality tended to increase development time and decrease body size, but there was substantial variation in development time within each diet treatment, and in body size for a given development time, allowing the effects of these variables to be partitioned. Nevertheless, to ensure that the effect of development time in our analyses did not simply represent differences among diets, we
also performed an alternative analysis using residual development time and residual wing length, representing the effects of these variables independent of larval diet and development time, respectively. Using this more conservative approach, development time remained a significant predictor of the scale of actuarial senescence, and of average mating rate, alongside larval diet which was now, unsurprisingly, also significant (Table S7a-b). Taken together, these results suggest that not only does intrinsic variation in development time covary with adult life history traits, development time also mediates the plastic effects of larval diet quality on adult performance and ageing. Alternatively, an unmeasured variable highly correlated with development time could mediate the relationship between diet and life history traits across life stages. Regardless, we find that development time is closely linked to variation in adult performance.
Development time had a complex effect on actuarial senescence. Rapid larval development was associated with a higher Weibull scale parameter, reflecting a lower initial mortality rate (Fig. 2; Table S4). However, as indicated by their higher Weibull shape parameter, males that developed quickly also senesced more rapidly, while the age-specific mortality of slow developers plateaued at later ages (Fig. 2; Table S4). The co-occurrence of rapid development and rapid aging is consistent with physiological trade-offs between early- and late-life performance [24,25,28]. However, this did not translate into a survival cost, as the median lifespan of fast developers was greater than that of slow developers. Furthermore, only 37% of males survived beyond 12 days, the point at which age-specific mortality for fast developers exceeded that of slow developers (Fig. 2). Accordingly, the majority of fast-developing males never experienced senescence-related mortality costs, and most that did were at higher risk of death for only a small a portion of their lives. These results highlight the distinction between lifespan and senescence per se. All else being equal, faster senescing individuals will have a shorter lifespan on
average, but longevity is also influenced by the baseline mortality rate and timing of onset of senescence. Therefore, variation in lifespan among groups may not simply reflect variation in senescence rate, and can differ in direction, as in our study. Researchers wanting to make inferences about senescence must be sure to measure changes in performance through time, rather than relying on lifespan (and vice versa).
Slow-developing male antler flies had a higher average mating rate than fast developers (Fig. 3). This result is surprising, especially since slow developers were smaller on average and large male antler flies are more successful in territorial combat [45] and are preferred by females [64].
Furthermore, a previous study of male mating success in antler flies found that larger males had a high daily mating rate [43]. Notably, since slow developers also lived shorter on average, there was no net effect of development time on LMS. The high average mating rate of these slower developing, males may represent an alternative mating strategy which either compensates for, or contributes to, their short lifespan. In yellow dung flies, for example, small males which cannot compete on dung successfully mate on patches of apple pomace where male–male combat is low [65]. Small male antler flies may similarly localize to areas of the antler where males do not defend territories, such as the underside (whichever side of the antler happens to face the ground) [45]. They may also be more willing to accept matings from less fecund females that high-quality males would reject [64].
Despite their high average mating rate, slow-developing males may not have achieved equal fitness as their peers. We only recorded mating success, which does not take into account variation in female fecundity or postcopulatory effects including sperm viability, sperm competition, and female choice [66]. These males might be more susceptible to copulatory take-overs by rivals [62], be willing to accept less fecund females [64], lose paternity due to sperm expulsion by females [62], or produce
semen with a reduced stimulatory effect on egg production (see ref. [67]). If these mechanisms of postcopulatory selection act against slow-developing males, their siring success could be lower than other males, despite similar LMS.
Our detection of actuarial senescence in male antler flies in the wild is consistent with multiple previous studies and further reinforces the existence of senescence in a short-lived insect in nature [39,43,46]. Previous studies have also reported reproductive senescence in this species [39,43,46], but we did not find a significant decline in male mating rate with age, although the trend was negative. Reproductive declines may simply be difficult to detect at smaller sample sizes, as Mautz et al. [39] detected clear reproductive senescence in male antler flies in one year (n = 432 males), but found only low support in the other (n = 219) in which sample size was similar to the current study.
Wing length had a small effect on male actuarial senescence (Weibull scale) and no effect on average mating rate in our results. In our study, large males tended to live longer. Similarly,
Bonduriansky and Brassil [43] found that larger male size was associated with greater longevity and mating success, but faster reproductive senescence in antler flies. Interestingly, Mautz et al. [39] reported differing effects of body size between years: large males experienced substantially higher mortality in one year, but slightly lower mortality in the other, and slightly higher mating rate in both years. However, none of these past studies measured development time, so they could not partition the effects of development time and body size, which are correlated in antler flies (Fig. 1B; [68]). Thus, the significant effects of body size on lifespan, mating success, and senescence reported by Bonduriansky and Brassil [43] may in fact be consistent with the effects of development time reported here.
This is the first study, to our knowledge, to experimentally test for silver-spoon effects in an insect in nature [42] and one of the first to investigate early–late life trade-offs in wild insects (but see
ref. [18]). Overall, our findings suggest that development time is an important contributor to adult life-history traits and senescence, and that this depends on early life environmental quality. However, the phenotypic consequences of variation in development time were mixed and were consistent with a silver spoon effect on some adult traits, but not others. More research is required to elucidate the mechanism behind the paradoxical high average mating rate of otherwise apparently low-quality males and to determine whether their postcopulatory performance is similarly high. Due to the antler flies’ complex phenotypic response, larval diet will likely affect fitness differently as environmental and social conditions vary through time and space. For example, living longer could be critical if female encounter rates are reduced in a particular year or location (e.g. because of bad weather). Much work remains to be done to characterize factors that influence the life-history traits and fitness of insects in nature.
Acknowledgements
We thank two anonymous reviewers and the associate editor whose comments substantially improved this manuscript. This research was supported by a grant from the Natural Sciences and Engineering Research Committee of Canada to Howard Rundle, an Australian Research Council Discovery Grant to Russell Bonduriansky (DP170102449), and a grant from the CeMEB LabEx/University of Montpellier (ANR-10-LABX-04-01) to Nicolas Rode.
MJO and HDR conceived the study design with input from RB. MJO and BSM performed the experiment and collected data. CSA and NOR performed data analysis. CSA and MJO drafted the manuscript. All authors contributed to interpretation and manuscript revisions.
References
1. Gurney WSC, Jones W, Veitch AR, Nisbet RM. 2003 Resource allocation, hyperphagia, and compensatory growth in juveniles. Ecology 84, 2777–2787. (doi:10.1890/02-0536)
2. Dmitriew CM. 2011 The evolution of growth trajectories: what limits growth rate? Biol. Rev. 86, 97–116. (doi:10.1111/j.1469-185X.2010.00136.x)
3. Lindström J. 1999 Early development and fitness in birds and mammals. Trends Ecol. Evol. 14, 343–348. (doi:10.1016/S0169-5347(99)01639-0)
4. Grafen A. 1988 On the uses of data on lifetime reproductive success. In Reproductive success: studies of individual variation in contrasting breeding systems (ed TH Clutton-Brock), pp. 454– 471. Chicago: University of Chicago Press.
5. Kelly CD, Neyer AA, Gress BE. 2014 Sex-specific life history responses to nymphal diet quality and immune status in a field cricket. J. Evol. Biol. 27, 381–390. (doi:10.1111/jeb.12304)
6. Griffin RM, Hayward AD, Bolund E, Maklakov AA, Lummaa V. 2018 Sex differences in adult mortality rate mediated by early-life environmental conditions. Ecol. Lett. 21, 235–242.
(doi:10.1111/ele.12888)
7. Haywood S, Perrins CM. 1992 Is clutch size in birds affected by environmental conditions during growth? Proc. R. Soc. Lond. B Biol. Sci. 249, 195–197. (doi:10.1098/rspb.1992.0103)
8. Tigreros N. 2013 Linking nutrition and sexual selection across life stages in a model butterfly system. Funct. Ecol. 27, 145–154. (doi:10.1111/1365-2435.12006)
9. Kleinteich A, Wilder SM, Schneider JM. 2015 Contributions of juvenile and adult diet to the lifetime reproductive success and lifespan of a spider. Oikos 124, 130–138. (doi:10.1111/oik.01421) 10. Plesnar-Bielak A et al. 2017 Larval and adult nutrition effects on reproductive traits in the red flour
beetle. J. Zool. 302, 79–87. (doi:10.1111/jzo.12440)
11. Vega-Trejo R, Jennions MD, Head ML. 2016 Are sexually selected traits affected by a poor environment early in life? BMC Evol. Biol. 16, 263. (doi:10.1186/s12862-016-0838-2)
12. Macartney EL, Crean AJ, Bonduriansky R. 2018 Epigenetic paternal effects as costly, condition-dependent traits. Heredity (doi:10.1038/s41437-018-0096-8)
13. Birkhead TR, Fletcher F, Pellatt EJ. 1999 Nestling diet, secondary sexual traits and fitness in the zebra finch. Proc. R. Soc. Lond. B Biol. Sci. 266, 385–390. (doi:10.1098/rspb.1999.0649)
14. Peters A, Delhey K, Nakagawa S, Aulsebrook A, Verhulst S. 2019 Immunosenescence in wild animals: meta‐analysis and outlook. Ecol. Lett. 22, 1709–1722. (doi:10.1111/ele.13343)
15. Robinson MR, Pilkington JG, Clutton-Brock TH, Pemberton JM, Kruuk LEB, Snook R. 2006 Live fast, die young: trade-offs between fitness components and sexually antagonistic selection on weaponry in soay sheep. Evolution 60, 2168–2181. (doi:10.1554/06-128.1)
16. Travers LM, Garcia-Gonzalez F, Simmons LW. 2015 Live fast die young life history in females: evolutionary trade-off between early life mating and lifespan in female Drosophila melanogaster. Sci. Rep. 5, 15469. (doi:10.1038/srep15469)
17. Adler MI, Telford M, Bonduriansky R. 2016 Phenotypes optimized for early-life reproduction exhibit faster somatic deterioration with age, revealing a latent cost of high condition. J. Evol. Biol.
29, 2436–2446. (doi:10.1111/jeb.12968)
18. Rodríguez‐Muñoz R, Boonekamp JJ, Liu XP, Skicko I, Fisher DN, Hopwood P, Tregenza T. 2019 Testing the effect of early-life reproductive effort on age-related decline in a wild insect. Evolution
73, 317–328. (doi:10.1111/evo.13679)
19. Lemaître J-F, Gaillard J-M, Pemberton JM, Clutton-Brock TH, Nussey DH. 2014 Early life
expenditure in sexual competition is associated with increased reproductive senescence in male red deer. Proc. R. Soc. Lond. B Biol. Sci. 281, 20140792. (doi:10.1098/rspb.2014.0792)
20. Hunt J, Brooks R, Jennions MD, Smith MJ, Bentson CL, Bussiere LF. 2004 High-quality male field crickets invest heavily in sexual display but die young. Nature 432, 1024–1027.
21. Hooper AK, Spagopoulou F, Wylde Z, Maklakov AA, Bonduriansky R. 2017 Ontogenetic timing as a condition-dependent life history trait: high-condition males develop quickly, peak early, and age fast. Evolution 71, 671–685. (doi:10.1111/evo.13172)
22. Hooper AK, Lehtonen J, Schwanz LE, Bonduriansky R. 2018 Sexual competition and the evolution of condition-dependent ageing. Evol. Lett. 2, 37–48. (doi:10.1002/evl3.36)
23. Spagopoulou F, Teplitsky C, Lind MI, Chantepie S, Gustafsson L, Maklakov AA. 2020 Silver-spoon upbringing improves early-life fitness but promotes reproductive ageing in a wild bird. Ecol. Lett. 23, 994–1002. (doi:10.1111/ele.13501)
24. Pearl R. 1928 The Rate of Living. New York: Alfred A. Knopf Inc.
25. Williams GC. 1957 Pleiotropy, natural selection, and the evolution of senescence. Evolution 11, 398–411. (doi:10.2307/2406060)
26. Monaghan P, Metcalfe NB, Torres R. 2009 Oxidative stress as a mediator of life history trade-offs: mechanisms, measurements and interpretation. Ecol. Lett. 12, 75–92.
(doi:10.1111/j.1461-0248.2008.01258.x)
27. Lee W-S, Metcalfe NB, Monaghan P, Mangel M. 2011 A Comparison of Dynamic-State-Dependent Models of the Trade-Off Between Growth, Damage, and Reproduction. Am. Nat. 178, 774–786. (doi:10.1086/662671)
28. Lind MI, Chen H, Meurling S, Guevara Gil AC, Carlsson H, Zwoinska MK, Andersson J, Larva T, Maklakov AA. 2017 Slow development as an evolutionary cost of long life. Funct. Ecol. 31, 1252– 1261. (doi:10.1111/1365-2435.12840)
29. Pijpe J, Fischer K, Brakefield PM, Zwaan BJ. 2006 Consequences of artificial selection on pre-adult development for pre-adult lifespan under benign conditions in the butterfly Bicyclus anynana. Mech. Ageing Dev. 127, 802–807. (doi:10.1016/j.mad.2006.07.006)
30. van Noordwijk AJ, de Jong G. 1986 Acquisition and allocation of resources: their influence on variation in life history tactics. Am. Nat. 128, 137–142. (doi:10.1086/284547)
31. English S, Uller T. 2016 Does early-life diet affect longevity? A meta-analysis across experimental studies. Biol. Lett. 12, 20160291. (doi:10.1098/rsbl.2016.0291)
32. Cooper EB, Kruuk LEB. 2018 Ageing with a silver-spoon: a meta-analysis of the effect of developmental environment on senescence. Evol. Lett. 2, 460–471. (doi:10.1002/evl3.79)
33. Nussey DH, Kruuk LEB, Morris A, Clutton-Brock TH. 2007 Environmental conditions in early life influence ageing rates in a wild population of red deer. Curr. Biol. 17, R1000–R1001. (doi:10.1016/ j.cub.2007.10.005)
34. Moore PJ, Moore AJ. 2001 Reproductive aging and mating: the ticking of the biological clock in female cockroaches. Proc. Natl. Acad. Sci. U. S. A. 98, 9171–9176.
35. Zajitschek F, Hunt J, Jennions MD, Hall MD, Brooks RC. 2009 Effects of juvenile and adult diet on ageing and reproductive effort of male and female black field crickets, Teleogryllus commodus. Funct. Ecol. 23, 602–611. (doi:10.1111/j.1365-2435.2008.01520.x)
36. Stearns SC, Ackermann M, Doebeli M, Kaiser M. 2000 Experimental evolution of aging, growth, and reproduction in fruitflies. Proc. Natl. Acad. Sci. 97, 3309–3313. (doi:10.1073/pnas.97.7.3309) 37. Lemaître J-F, Gaillard J-M. 2017 Reproductive senescence: new perspectives in the wild. Biol. Rev.
38. Lemaître J-F, Berger V, Bonenfant C, Douhard M, Gamelon M, Plard F, Gaillard J-M. 2015 Early-late life trade-offs and the evolution of ageing in the wild. Proc R Soc B 282, 20150209.
(doi:10.1098/rspb.2015.0209)
39. Mautz B S, Rode NO, Bonduriansky R, Rundle HD. 2019 Comparing ageing and the effects of diet supplementation in wild vs. captive antler flies, Protopiophila litigata. J. Anim. Ecol. 88, 1913– 1924. (doi:10.1111/1365-2656.13079)
40. Hämäläinen A, Dammhahn M, Aujard F, Eberle M, Hardy I, Kappeler PM, Perret M, Schliehe-Diecks S, Kraus C. 2014 Senescence or selective disappearance? Age trajectories of body mass in wild and captive populations of a small-bodied primate. Proc. R. Soc. B Biol. Sci. 281, 20140830. (doi:10.1098/rspb.2014.0830)
41. Kawasaki N, Brassil CE, Brooks RC, Bonduriansky R. 2008 Environmental effects on the expression of life span and aging: an extreme contrast between wild and captive cohorts of Telostylinus angusticollis (Diptera: Neriidae). Am. Nat. 172, 346–357. (doi:10.1086/589519) 42. Zajitschek F, Zajitschek S, Bonduriansky R. 2020 Senescence in wild insects: key questions and
challenges. Funct. Ecol. 34, 26–37. (doi:10.1111/1365-2435.13399)
43. Bonduriansky R, Brassil CE. 2005 Reproductive ageing and sexual selection on male body size in a wild population of antler flies (Protopiophila litigata). J. Evol. Biol. 18, 1332–1340.
(doi:10.1111/j.1420-9101.2005.00957.x)
44. Bonduriansky R. 1995 A new Nearctic species of Protopiophila Duda (Diptera: Piophilidae), with notes on its behaviour and comparison with P. latipes (Meigen). Can. Entomol. 127, 859–863. (doi:10.4039/Ent127859-6)
45. Bonduriansky R, Brooks RJ. 1999 Why do male antler flies (Protopiophila litigata) fight? The role of male combat in the structure of mating aggregations on moose antlers. Ethol. Ecol. Evol. 11, 287–301. (doi:10.1080/08927014.1999.9522829)
46. Bonduriansky R, Brassil CE. 2002 Rapid and costly ageing in wild male flies. Nature 420, 377– 377. (doi:10.1038/420377a)
47. Oudin MJ, Bonduriansky R, Rundle HD. 2015 Experimental evidence of condition-dependent sexual dimorphism in the weakly dimorphic antler fly Protopiophila litigata (Diptera: Piophilidae). Biol. J. Linn. Soc. 116, 211–220. (doi:10.1111/bij.12549)
48. Bonduriansky R, Brooks RJ. 1997 A technique for measuring and marking live flies. Can. Entomol.
129, 827–830. (doi:10.4039/Ent129827-5)
49. Schneider CA, Rasband WS, Eliceiri KW. 2012 NIH Image to ImageJ: 25 years of image analysis. Nat. Methods 9, 671. (doi:10.1038/nmeth.2089)
50. Bonduriansky R. 1996 Effects of body size on mate choice and fecundity in the antler fly, Protopiophila litigata (Diptera: Piophilidae). MSc Thesis, University of Guelph.
51. R Core Team. 2020 R: A Language and Environment for Statistical Computing. Vienna, Austria: R Foundation for Statistical Computing. See https://www.R-project.org/.
52. Fox J, Weisberg S. 2011 An R Companion to Applied Regression. Second. Thousand Oaks CA: Sage. See http://socserv.socsci.mcmaster.ca/jfox/Books/Companion.
53. Schielzeth H. 2010 Simple means to improve the interpretability of regression coefficients. Methods Ecol. Evol. 1, 103–113. (doi:10.1111/j.2041-210X.2010.00012.x)
54. Crawley MJ. 2013 The R book. Second Edition. Chichester, West Sussex: Wiley, A John Wiley & Sons Ltd, Publicaton.
55. Therneau TM. 2015 A Package for Survival Analysis in S. See https://CRAN.R-project.org/package=survival.
56. Jackson C. 2016 flexsurv : A platform for parametric survival modeling in R. J. Stat. Softw. 70. (doi:10.18637/jss.v070.i08)
57. Gómez G, Calle M, Oller R, Langohr K. 2009 Tutorial on methods for interval-censored data and their implementation in R. Stat. Model. 9, 259–297. (doi:10.1177/1471082X0900900402)
58. Bartoń K. 2016 MuMIn: Multi-Model Inference. See https://CRAN.R-project.org/package=MuMIn.
59. Hurvich CM, Tsai C-L. 1989 Regression and time series model selection in small samples. Biometrika 76, 297–307. (doi:10.1093/biomet/76.2.297)
60. Crawley MJ. 1993 GLIM for ecologists. Boston: Blackwell Scientific Publications.
61. Bates D, Mächler M, Bolker B, Walker S. 2015 Fitting linear mixed-effects models using lme4. J. Stat. Softw. 67, 1–48. (doi:10.18637/jss.v067.i01)
62. Bonduriansky R, Brooks RJ. 1998 Copulation and oviposition behavior of Protopiophila litigata (Diptera: Piophilidae). Can. Entomol. 130, 399–405. (doi:10.4039/Ent130399-4)
63. Graham MH. 2003 Confronting multicollinearity in ecological multiple regression. Ecology 84, 2809–2815. (doi:10.1890/02-3114)
64. Bonduriansky R, Brooks RJ. 1998 Male antler flies (Protopiophila litigata; Diptera: Piophilidae) are more selective than females in mate choice. Can. J. Zool. 76, 1277–1285. (doi:10.1139/z98-069)
65. Pitnick S, Henn KRH, Maheux SD, Higginson DM, Hurtado-Gonzales JL, Manier MK, Berben KS, Guptill C, Uy JAC. 2009 Size-dependent alternative male mating tactics in the yellow dung fly, Scathophaga stercoraria. Proc. R. Soc. Lond. B Biol. Sci. 276, 3229–3237.
(doi:10.1098/rspb.2009.0632)
66. Eberhard WG. 2009 Postcopulatory sexual selection: Darwin’s omission and its consequences. Proc. Natl. Acad. Sci. 106, 10025–10032. (doi:10.1073/pnas.0901217106)
67. Bonduriansky R, Wheeler J, Rowe L. 2005 Ejaculate feeding and female fitness in the sexually dimorphic fly Prochyliza xanthostoma (Diptera: Piophilidae). Anim. Behav. 69, 489–497. (doi:10.1016/j.anbehav.2004.03.018)
68. Angell CS, Cook O. 2019 Natural variation in the growth and development of Protopiophila litigata (Diptera: Piophilidae) developing in three moose (Artiodactyla: Cervidae) antlers. Can. Entomol. 151, 531–536. (doi:10.4039/tce.2019.32)
Electronic Supplementary Material
for
Development time mediates the effect of larval diet on ageing and mating success of male antler flies in the wild
Christopher S. Angell, Mathieu J. Oudin, Nicolas O. Rode, Brian S. Mautz, Russell Bonduriansky, and Howard D. Rundle
Proceedings of the Royal Society B: Biological Sciences doi: 10.1098/rspb.2020.1876
Survival distribution selection
As the first step of our actuarial senescence analysis, we tested which of the survival distributions supported by the R packages survival [1] and flexsurv [2] provided the best fit to our data. We tested the exponential, two-parameter Weibull, Gaussian, logistic, log-logistic, log-normal, and extreme value distributions in survival and we tested Gompertz and three-parameter Weibull distributions in flexsurv. The survival package allows fitting only a single factor to the shape parameter of the two- or three-parameter distributions (i.e. all except exponential), and any number of continuous and/or categorical variables to the scale parameter. Development time and wing length, being continuous variables of particular interest, were therefore each binned into two levels corresponding to individuals above vs. below the median value across the whole dataset, allowing us to test their effects, alongside diet treatment, as potential predictors of the shape of actuarial senescence.
We compared the various survival distributions with AICc [3] using the R package MuMIn [4], considering models with ΔAICc < 2 to be equally well supported [5]. For each distribution, we fit a full model including the effects of all our variables (without interactions) on the scale parameter. We also included the effects of either diet, development time, or wing length on the shape parameter of two- and three-parameter distributions. The two-parameter Weibull distribution provided the best fit to our data regardless of the shape variable (ΔAICc > 5; Table S2) and was therefore used in subsequent model selection.
References
1. Therneau TM. 2015 A Package for Survival Analysis in S. See https://CRAN.R-project.org/package=survival.
2. Jackson C. 2016 flexsurv : A platform for parametric survival modeling in R. Journal of Statistical Software 70. (doi:10.18637/jss.v070.i08)
3. Hurvich CM, Tsai C-L. 1989 Regression and time series model selection in small samples. Biometrika 76, 297–307. (doi:10.1093/biomet/76.2.297)
4. Bartoń K. 2016 MuMIn: Multi-Model Inference. See https://CRAN.R-project.org/package=MuMIn. 5. Burnham KP, Anderson DR. 2002 Model selection and multimodel inference: a practical
Fig. S1. Relationship between wing length (mm) and thorax length (mm) in male antler flies across four larval diet treatments (colors). Treatments did not differ significantly in slope or intercept, so the overall reduced major axis fit is represented by the black line (r = 0.645, p < 0.001).
Table S1. Number of males from each treatment released on antlers A and B in each block. Antler A Antler B Treatment Block Flies Released Total (Treatment) Total
(Antler) Treatment Block Flies Released Total (Treatment) Total (Antler) A 1 1 49 179 A 1 0 11 41 2 3 2 0 3 12 3 1 4 5 4 0 5 13 5 4 6 4 6 4 7 4 7 2 8 0 8 0 9 7 9 0 B 1 13 48 B 1 0 10 2 2 2 0 3 10 3 0 4 6 4 0 5 6 5 5 6 6 6 0 7 3 7 5 8 1 8 0 9 1 9 0 C 1 7 42 C 1 0 10 2 11 2 0 3 3 3 0 4 4 4 8 5 1 5 0 6 0 6 0 7 8 7 2 8 7 8 0 9 1 9 0 D 1 0 40 D 1 0 10 2 10 2 0 3 0 3 0 4 20 4 8 5 4 5 0 6 1 6 0 7 5 7 2 8 0 8 0 9 0 9 0
Table S2. Survival distribution selection using AICc. ΔAICc values were calculated relative to the Weibull model with the same factor on the shape parameter. All models contained the following variables on the scale parameter: larval diet treatment, development time, wing length, average population density, average sex ratio, antler, average mating rate, and block. Regardless of shape variable, the two-parameter Weibull distribution provided the best fit to the data.
Shape parameter Intercept (single level) Larval diet treatment (four levels) Development time (two levels) Wing length (two levels)
AICc ΔAICc AICc ΔAICc AICc ΔAICc AICc ΔAICc
Two-parameter Weibull 972.9 0 980.1 0 969.5 0 972.6 0 Three-parameter Weibull 978.2 5.3 986.5 6.4 976.3 6.8 979.1 6.5 Gompertz 984.3 11.4 989.0 8.9 985.9 16.4 986.4 13.8 Log-normal 986.6 13.7 992.5 12.4 980.6 11.1 986.1 13.5 Log-logistic 993.0 20.1 999.5 19.4 988.8 19.3 993.1 20.5 Gaussian 1003.6 30.7 1006.2 26.1 1006.0 36.5 1006.2 33.6 Extreme value 1026.7 53.8 1029.4 49.3 1028.9 59.4 1029.1 56.5 Exponential 1067.2 94.3 NA NA NA NA NA NA
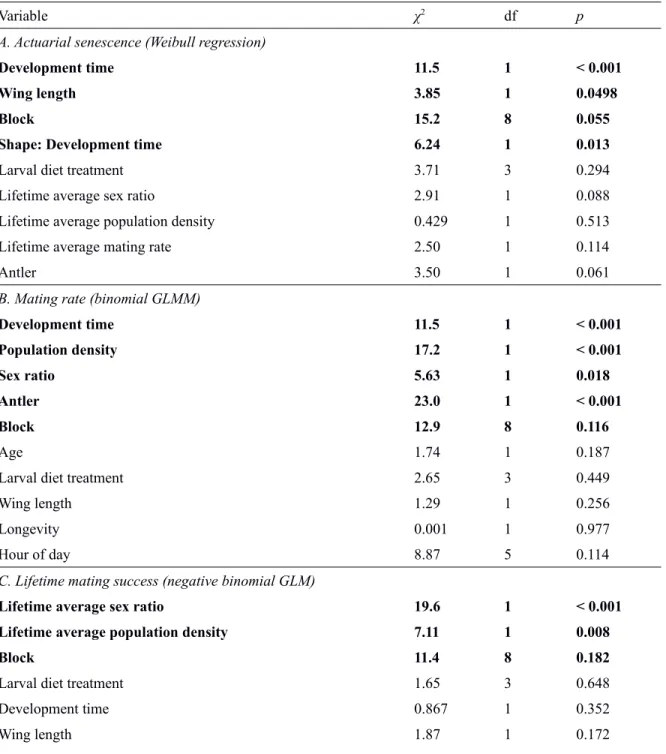
Table S3. Significance of all fixed effects in the main (i.e. non-residual) model selection, based on LRT relative to the final (i.e. best fit) model, or for terms present in the minimal adequate model, relative to a model lacking this term. Terms in bold were present in the minimal adequate model.
Variable χ2 df p
A. Actuarial senescence (Weibull regression)
Development time 11.5 1 < 0.001
Wing length 3.85 1 0.0498
Block 15.2 8 0.055
Shape: Development time 6.24 1 0.013
Larval diet treatment 3.71 3 0.294
Lifetime average sex ratio 2.91 1 0.088
Lifetime average population density 0.429 1 0.513
Lifetime average mating rate 2.50 1 0.114
Antler 3.50 1 0.061
B. Mating rate (binomial GLMM)
Development time 11.5 1 < 0.001 Population density 17.2 1 < 0.001 Sex ratio 5.63 1 0.018 Antler 23.0 1 < 0.001 Block 12.9 8 0.116 Age 1.74 1 0.187
Larval diet treatment 2.65 3 0.449
Wing length 1.29 1 0.256
Longevity 0.001 1 0.977
Hour of day 8.87 5 0.114
C. Lifetime mating success (negative binomial GLM)
Lifetime average sex ratio 19.6 1 < 0.001
Lifetime average population density 7.11 1 0.008
Block 11.4 8 0.182
Larval diet treatment 1.65 3 0.648
Development time 0.867 1 0.352
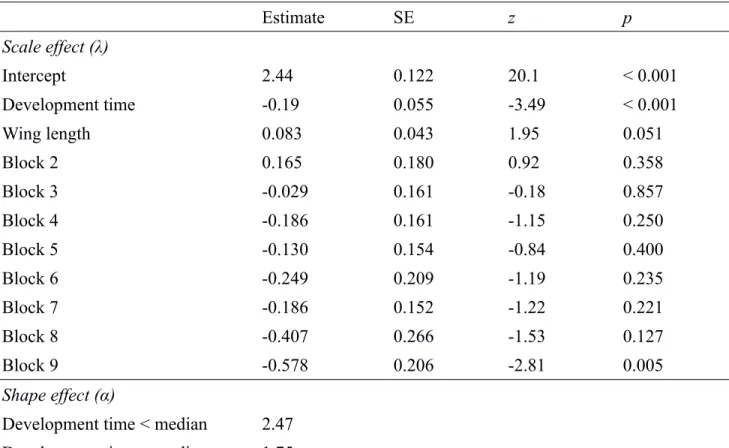
Table S4. Parameter estimates from the final parametric Weibull survival model. Estimates for the scale parameter are on a log scale, and covariates were standardized to a mean of zero and a standard
deviation of one. The reference level for “Block” was block 1.
Estimate SE z p Scale effect (λ) Intercept 2.44 0.122 20.1 < 0.001 Development time -0.19 0.055 -3.49 < 0.001 Wing length 0.083 0.043 1.95 0.051 Block 2 0.165 0.180 0.92 0.358 Block 3 -0.029 0.161 -0.18 0.857 Block 4 -0.186 0.161 -1.15 0.250 Block 5 -0.130 0.154 -0.84 0.400 Block 6 -0.249 0.209 -1.19 0.235 Block 7 -0.186 0.152 -1.22 0.221 Block 8 -0.407 0.266 -1.53 0.127 Block 9 -0.578 0.206 -2.81 0.005 Shape effect (α)
Development time < median 2.47 Development time ≥ median 1.75
Table S5. Parameter estimates from the final mating rate binomial GLMM. Estimates are on a logit scale, and covariates were standardized to a mean of zero and a standard deviation of one. The reference level for “Antler” is antler A, and for “Block” is block 1.
Fixed effect Estimate SE z p
Intercept -4.32 0.320 -13.5 < 0.001
Development time 0.342 0.099 3.46 < 0.001
Sex ratio (proportion male) -0.263 0.111 -2.37 0.018
Population density (flies/antler) 0.450 0.109 4.21 < 0.001
Antler B 1.31 0.285 4.60 < 0.001 Block 2 0.035 0.382 0.09 0.928 Block 3 0.384 0.384 1.00 0.317 Block 4 -0.203 0.385 -0.53 0.598 Block 5 -0.174 0.386 -0.45 0.653 Block 6 -0.555 0.520 -1.07 0.286 Block 7 -0.498 0.401 -1.24 0.214 Block 8 -0.795 0.698 -1.14 0.255 Block 9 0.779 0.515 1.51 0.130
Random effect Variance SD
Male identity 0.228 0.477
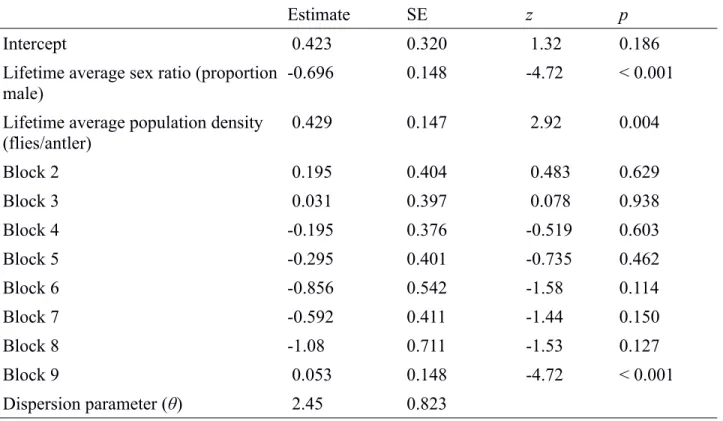
Table S6. Parameter estimates from the final LMS negative-binomial GLM. Estimates are on a log scale, and covariates were standardized to a mean of zero and a standard deviation of one. The reference level for “Block” is block 1.
Estimate SE z p
Intercept 0.423 0.320 1.32 0.186
Lifetime average sex ratio (proportion male)
-0.696 0.148 -4.72 < 0.001
Lifetime average population density (flies/antler) 0.429 0.147 2.92 0.004 Block 2 0.195 0.404 0.483 0.629 Block 3 0.031 0.397 0.078 0.938 Block 4 -0.195 0.376 -0.519 0.603 Block 5 -0.295 0.401 -0.735 0.462 Block 6 -0.856 0.542 -1.58 0.114 Block 7 -0.592 0.411 -1.44 0.150 Block 8 -1.08 0.711 -1.53 0.127 Block 9 0.053 0.148 -4.72 < 0.001 Dispersion parameter (θ) 2.45 0.823
Table S7. Significance of all fixed effects in the residual model selection, based on LRT relative to the minimal adequate model (or to a model lacking the given term). Terms in bold are included in the minimal adequate model.
Variable χ2 df p
A. Actuarial senescence (Weibull regression)
Larval diet treatment 12.0 3 0.007
Residual development time 13.6 1 < 0.001
Residual wing length 3.88 1 0.049
Block 16.2 8 0.040
Lifetime average sex ratio 2.36 1 0.125
Lifetime average population density 0.457 1 0.499
Lifetime average mating rate 2.34 1 0.126
Antler 3.17 1 0.075
Shape: Larval diet treatment 1.66 3 0.647
Shape: Residual development time 3.28 1 0.070
Shape: Residual wing length 2.04 1 0.153
B. Mating rate (binomial GLMM)
Larval diet treatment 9.01 3 0.029
Residual development time 8.28 1 0.004
Population density 17.7 1 < 0.001
Sex ratio 5.63 1 0.018
Antler 24.1 1 < 0.001
Block 11.5 8 0.175
Age 1.54 1 0.215
Residual wing length 0.090 1 0.342
Longevity 0.061 1 0.805
Hour of day 8.75 5 0.119
C. Lifetime mating success (negative binomial GLM)
Lifetime average sex ratio 19.6 1 < 0.001
Lifetime average population density 7.11 1 0.008
Block 11.4 8 0.182
Residual development time 0.357 1 0.550
Residual wing length 2.56 1 0.110
Table S8. Parameter estimates from the final parametric Weibull survival model after model selection using residual development time and residual wing length. Estimates for the scale parameter are on a log scale, and covariates were standardized to a mean of zero and a standard deviation of one. The reference level for “Larval diet treatment” was treatment A (100% beef), and for “Block” was block 1.
Estimate SE z p
Scale effect (λ)
Intercept 2.50 0.161 15.5 < 0.001
Larval diet treatment B 0.009 0.116 0.08 0.935
Larval diet treatment C 0.027 0.147 0.18 0.855
Larval diet treatment D -0.410 0.160 -2.56 0.011
Residual development time -0.170 0.044 -3.84 < 0.001
Residual wing length 0.084 0.043 1.97 0.048
Block 2 0.205 0.201 1.02 0.308 Block 3 -0.019 0.180 -0.11 0.916 Block 4 -0.083 0.185 -0.45 0.654 Block 5 -0.127 0.173 -0.73 0.463 Block 6 -0.163 0.213 -0.77 0.443 Block 7 -0.286 0.180 -1.58 0.114 Block 8 -0.457 0.255 -1.79 0.073 Block 9 -0.505 0.259 -1.95 0.051 Shape effect (α) Intercept 2.04
Table S9. Parameter estimates from the final mating rate binomial GLMM after model selection using residual development time and residual wing length. Estimates are on a logit scale, and covariates were standardized to a mean of zero and a standard deviation of one. The reference level for “Larval diet treatment” is treatment A (100% beef), “Antler” is antler A, and for “Block” is block 1.
Fixed effect Estimate SE z p
Intercept -4.31 0.382 -11.3 < 0.001
Larval diet treatment B -0.113 0.254 -0.444 0.657
Larval diet treatment C 0.109 0.301 0.363 0.716
Larval diet treatment D 0.761 0.329 2.31 0.028
Residual development time 0.261 0.089 2.92 0.004
Sex ratio (proportion male) -0.263 0.111 -2.37 0.018
Population density (flies/antler) 0.468 0.109 4.28 < 0.001
Antler B 1.34 0.285 4.71 < 0.001 Block 2 -0.131 0.414 -0.317 0.751 Block 3 0.271 0.389 0.696 0.486 Block 4 -0.418 0.426 -0.980 0.327 Block 5 -0.316 0.396 -0.798 0.425 Block 6 -0.660 0.529 -1.25 0.213 Block 7 -0.628 0.418 -1.50 0.133 Block 8 -0.834 0.714 -1.17 0.243 Block 9 0.528 0.549 0.961 0.337
Random effect Variance SD
Male identity 0.208 0.457
Table S10. Results of mating rate GLMM model selection when including observation periods with an undefined sex ratio (see Methods). Significance of all fixed effects are based on LRT relative to the best fit model (or to a model lacking the given term). Terms in bold are included in the minimal adequate model. Variable χ2 df p Development time 12.0 1 < 0.001 Population density 12.6 1 < 0.001 Antler 39.1 1 < 0.001 Block 12.7 8 0.123 Age 1.27 1 0.260 Wing length 1.34 1 0.246 Longevity 0.022 1 0.882 Hour of day 7.67 5 0.176
Table S11. Parameter estimates from the final mating rate binomial GLMM after model selection, including observations with an undefined sex ratio. Estimates are on a logit scale, and covariates were standardized to a mean of zero and a standard deviation of one. The reference level for “Antler” is antler A, and for “Block” is block 1.
Fixed effect Estimate SE z p
Intercept -4.38 0.321 -13.7 < 0.001
Development time 0.351 0.991 3.54 < 0.001
Population density (flies/antler) 0.372 0.103 3.59 < 0.001
Antler B 1.58 0.265 5.96 < 0.001 Block 2 0.338 0.383 0.088 0.930 Block 3 0.395 0.395 1.03 0.305 Block 4 -0.185 0.386 -0.479 0.632 Block 5 -0.156 0.387 -0.404 0.687 Block 6 -0.532 0.521 -1.02 0.307 Block 7 -0.474 0.403 -1.18 0.239 Block 8 -0.775 0.699 -1.11 0.268 Block 9 0.818 0.518 1.58 0.114
Random effect Variance SD
Male identity 0.233 0.483