HAL Id: hal-02344713
https://hal.sorbonne-universite.fr/hal-02344713
Submitted on 4 Nov 2019
HAL is a multi-disciplinary open access archive for the deposit and dissemination of sci-entific research documents, whether they are pub-lished or not. The documents may come from teaching and research institutions in France or abroad, or from public or private research centers.
L’archive ouverte pluridisciplinaire HAL, est destinée au dépôt et à la diffusion de documents scientifiques de niveau recherche, publiés ou non, émanant des établissements d’enseignement et de recherche français ou étrangers, des laboratoires publics ou privés.
of hemorrhagic fever with renal syndrome caused by
Seoul hantavirus
Yidan Li, Bernard Cazelles, Guoqing Yang, Marko Laine, Zheng Huang, Jun
Caiid, Hua Tan, Nils Chr. Stenseth, Huaiyu Tianid
To cite this version:
Yidan Li, Bernard Cazelles, Guoqing Yang, Marko Laine, Zheng Huang, et al.. Intrinsic and ex-trinsic drivers of transmission dynamics of hemorrhagic fever with renal syndrome caused by Seoul hantavirus. PLoS Neglected Tropical Diseases, Public Library of Science, 2019, 13 (9), pp.e0007757. �10.1371/journal.pntd.0007757�. �hal-02344713�
Intrinsic and extrinsic drivers of transmission
dynamics of hemorrhagic fever with renal
syndrome caused by Seoul hantavirus
Yidan Li1☯, Bernard Cazelles2,3☯, Guoqing Yang4, Marko LaineID5, Zheng X. Y. Huang6, Jun CaiID7, Hua Tan8, Nils Chr. Stenseth9,10*, Huaiyu TianID1*
1 State Key Laboratory of Remote Sensing Science, College of Global Change and Earth System Science, Beijing Normal University, Beijing, China, 2 IBENS, UMR 8197 CNRS-ENS Ecole Normale Supe´ rieure, Paris, France, 3 International Center for Mathematical and Computational Modeling of Complex Systems (UMMISCO), IRD-Sorbonne Universite´ , Bondy, France, 4 Huludao Municipal Center for Disease Control and Prevention, Huludao, Liaoning, China, 5 Finnish Meteorological Institute, Helsinki, Finland, 6 College of Life Sciences, Nanjing Normal University, Nanjing, China, 7 Ministry of Education Key Laboratory for Earth System Modelling, Department of Earth System Science, Tsinghua University, Beijing, China, 8 School of Biomedical Informatics, the University of Texas Health Science Center at Houston, Houston, Texas, United States of America, 9 Centre for Ecological and Evolutionary Synthesis (CEES), Department of Biosciences, University of Oslo, Blindern, Oslo, Norway, 10 Ministry of Education Key Laboratory for Earth System Modeling, Department of Earth System Science, Tsinghua University, Beijing, China
☯These authors contributed equally to this work.
*n.c.stenseth@ibv.uio.no(NCS);tianhuaiyu@gmail.com(HT)
Abstract
Seoul hantavirus (SEOV) has recently raised concern by causing geographic range expan-sion of hemorrhagic fever with renal syndrome (HFRS). SEOV infections in humans are sig-nificantly underestimated worldwide and epidemic dynamics of SEOV-related HFRS are poorly understood because of a lack of field data and empirically validated models. Here, we use mathematical models to examine both intrinsic and extrinsic drivers of disease transmis-sion from animal (the Norway rat) to humans in a SEOV-endemic area in China. We found that rat eradication schemes and vaccination campaigns, but below the local elimination threshold, could diminish the amplitude of the HFRS epidemic but did not modify its season-ality. Models demonstrate population dynamics of the rodent host were insensitive to climate variations in urban settings, while relative humidity had a negative effect on the seasonality in transmission. Our study contributes to a better understanding of the epidemiology of SEOV-related HFRS, demonstrates asynchronies between rodent population dynamics and transmission rate, and identifies potential drivers of the SEOV seasonality.
Author summary
Seoul hantavirus (SEOV) infections are common in Europe and Asia where a consider-ably high seroprevalence among the population is found. However, only relatively few hemorrhagic fever with renal syndrome (HFRS) cases are reported. Comprehensive epi-demiological data is necessary to study the patterns and drivers of this underestimated
a1111111111 a1111111111 a1111111111 a1111111111 a1111111111 OPEN ACCESS
Citation: Li Y, Cazelles B, Yang G, Laine M, Huang
ZXY, Cai J, et al. (2019) Intrinsic and extrinsic drivers of transmission dynamics of hemorrhagic fever with renal syndrome caused by Seoul hantavirus. PLoS Negl Trop Dis 13(9): e0007757.
https://doi.org/10.1371/journal.pntd.0007757
Editor: Rhoel Ramos Dinglasan, University of
Florida, UNITED STATES
Received: April 18, 2019 Accepted: September 6, 2019 Published: September 23, 2019
Copyright:© 2019 Li et al. This is an open access article distributed under the terms of theCreative Commons Attribution License, which permits unrestricted use, distribution, and reproduction in any medium, provided the original author and source are credited.
Data Availability Statement: All relevant data are
within the manuscript and its Supporting Information files.
Funding: Funding has been provided by the Beijing
Natural Science Foundation (JQ18025), (http://kw. beijing.gov.cn/jjb/); Beijing Advanced Innovation Program for Land Surface Science, (jw.beijing.gov. cn); National Natural Science Foundation of China (81673234, 31870400), (http://www.nsfc.gov.cn/); the National Key Research and Development Program of China (2016YFA0600104),
disease. Here, we analyzed rodent host surveillance and seroprevalence data from 1998 to 2015 for disease outbreaks in Huludao City, one of the typical SEOV-endemic areas for HFRS in China. Our mathematical models quantified the drivers on HFRS transmission and estimated the epidemiological parameters. Our study provides an understanding of its ecological process between intrinsic and extrinsic factors, human-rodent interface and disease dynamics.
Introduction
There are 60,000–100,000 cases of hemorrhagic fever with renal syndrome (HFRS), a rodent-borne zoonosis, reported annually, globally [1,2]. HFRS is caused by subtypes of hantavirus, each of which is associated with a distinct rodent species [3]. Humans are usually infected by inhaling air contaminated with saliva, feces, or urine from infected rodents [4]. China is the main epidemic region for HFRS, and accounts for 90% of cases, globally [1]. The two predomi-nant hantavirus strains circulating in endemic areas of China are Hantaan virus (HTNV), which is carried by striped field mice (Apodemus agrarius), and Seoul virus (SEOV), which is
carried by Norway rat (Rattus norvegicus) [5].
HFRS epidemics vary significantly across seasons and are influenced by extrinsic factors across regions, like climate [6–10]. Following the Hantavirus Pulmonary Syndrome out-breaks that occurred in the Four Corners region of the southwestern United States in 1993, the correlation between hantavirus infections and climatic conditions was described using a cascade hypothesis [11]. The hypothesis posited that favorable climate conditions would lead to more available food, and to greater rodent population sizes, thereby enhancing the risk of hantavirus infections. Similarly, the 2007 HFRS outbreak in temperate southern Europe may have been caused by increased population density of the bank vole, the vector of Puumala virus (PUUV), which, in turn, may have resulted from abundant food due to preceding warmer than usual autumn and winter weather [12,13]. In central China, higher tempera-ture and precipitation in the previous summer led to favorable food conditions for the striped field mouse, the rodent host of HTNV, which led to an autumn peak in incidence of HFRS [14].
Hantaviruses carried by species of wild rodents, such as HTNV and PUUV, have been extensively studied, but SEOV is vectored by the Norway rat, a domestic rodent that is found in urban environments and is associated with humans [15–17]. SEOV infections, have milder symptoms and lower fatality rates (1–2% vs. 5–10%) than HTNV infections, so less attention is focused on SEOV [16,17]. Besides, SEOV infections have a higher asymptomatic infection rate of 8–20%, compared with HTNV at 1–4% [18]. In the past two decades, SEOV-related HFRS cases have been reported in the United Kingdom (2012) [19], France (2014) [20], the United States, and Canada (2017) [21] and most provinces of China [22–26]. It has been esti-mated that more than 25% of hantavirus infections in South Korea and China are caused by SEOV [27,28]. To better control the potential threat, it is important to understand how critical factors impact SEOV-related HFRS transmission dynamics.
Here, we explore the roles of related intrinsic and extrinsic factors in transmission dynamics of HFRS caused by SEOV in the pre-vaccination era. Intrinsic factors refer mainly to herd immunity or host population dynamics, and extrinsic factors include exter-nal forces such as climatic or environmental factors. We collected detailed epidemiological and rodent trapping data from a typical SEOV-endemic area of China, Huludao City, where the Norway rat is the dominant rodent species in residential areas [29]. Additionally, we
(http://www.most.gov.cn/); Young Elite Scientist Sponsorship Program by CAST (YESS) (2018QNRC001) (http://www.cast.org.cn/), the Fundamental Research Funds for the Central Universities (http://www.moe.edu.cn/) and Academician Xu Jian-guo Work Station (2018IC155). H.T. acknowledges support from the Oxford Martin School. The funders had no role in study design, data collection and analysis, decision to publish, or preparation of the manuscript.
Competing interests: The authors have declared
investigated potential causal relationships among the environmental variables, the popula-tion dynamics of the rodent reservoir, and the incidence of HFRS. We subsequently con-structed a mathematical model to quantify intrinsic transmission dynamics and extrinsic effects.
Materials and methods
Data
Huludao City (40˚560N, 120˚280E) in the Liaoning Province of China (S1 Fig) has a temperate
monsoon climate with a hot and rainy summer (mean temperature, 23 ˚C; mean monthly pre-cipitation, 123 mm) and a cold and rainless winter (mean temperature, -5.7 ˚C; mean monthly precipitation, 2 mm). The city covers 10,434 square km and has a population of 2.6 million people. HFRS has always posed a severe threat to human health in Huludao City since 1984 [30]. To control HFRS transmission, mass vaccination campaigns against hantavirus were con-ducted beginning in 2005, and combined with rat extermination programs during 2005 and 2012 [31].
Local demographic data were collected from the Liaoning Statistical Yearbooks. Land cover changes from 1998 to 2015 in Huludao City were derived from the annual European Space Agency (ESA) Climate Change Initiative (CCI) land cover maps, with a 300 m spatial resolu-tion. Meteorological data for Huludao City from 1998 to 2015 were obtained from the Chinese Bureau of Meteorology, and then processed into monthly climate data, including monthly mean maximum temperature, mean temperature, mean minimum temperature, cumulative precipitation, relative humidity, and absolute humidity. Absolute humidity is calculated from temperature and relative humidity [32].
Data of human HFRS cases in Huludao City from 1998 to 2015, were obtained from the Huludao City Center for Disease Control and Prevention, China. All HFRS cases were con-firmed according to the standard diagnosis set out by the Ministry of Health of the People’s Republic of China, and by detecting antibodies against hantavirus in serum samples. Serum samples were tested for immunoglobulin (Ig) G and IgM antibodies against HTNV and SEOV by indirect immunofluorescent assay (IFA) [33]. Serum-epidemiological surveys on human hantavirus infection were conducted annually between 1998 and 2015. Anonymous (non-per-sonal) information was used.
Rodent population density was investigated indoors and outdoors by the powder-trace method on a monthly basis, obtained from the historical literature [34]. According to the crite-ria, 400 powdered panels are placed in the special sites for spot checks across the city every month, of which 240 panels are set in restaurant, hotel, station and other public places where rodents are commonly found, and 160 panels are set in general household. Two powdered panels were placed in each room (about 15 m2) in selected spots. Outdoors, each panel was placed along a wall at 5–10 m intervals. All panels were set at night and recovered before sun-rise. Rodent population density was calculated as the number of positive powdered panels (with footprints or tail tracks from rodents) divided by the number of effective powdered pan-els used.
Ethics statement
The study protocol was reviewed by the institutional review board of the Huludao Municipal CDC and ethics approval was not required. We have received consent from home/land owners to collect rodent data on private land and in private homes. The Animal Ethics Committee of the Huludao Municipal CDC also waived approval for this study.
Wavelet analysis
Wavelet analysis is widely used in ecology and epidemiology studies to explore the variety in the periodicity of a time series through its decomposition properties [35]. Here, the Morlet wavelet was used to detect the non-stationary characteristics of the incidence of HFRS fluctua-tions over time, and the bootstrapping method [36] was performed to test the statistical significance of the results. In the significance test, 1000 surrogate datasets were simulated by bootstrapping to test the null hypothesis, where aP value of < 0.05 was considered to be
statis-tically significant.
Convergent cross mapping
Convergent cross mapping (CCM) is used to detect nonlinear causal relationships between time series of HFRS incidence (Y) and environmental factors (X), which is designed to mea-sure causality in nonlinear dynamical systems. CCM can help to identify bidirectional causality (i.e. X and Y are mutually coupled) or unidirectional causality (e.g., X time series variable in a system has a causal influence on Y, but not vice versa) [37,38]. In this study, CCM was used to identify time-delayed effects of a causal interaction between time series of environmental vari-ability, the population dynamics of rodent hosts, and HFRS incidence based on nonlinear state space reconstruction [39]. In a system wherex causes y, Sugihara et al. purposed that the state
ofx(t) can be estimated from the reconstruction of y(t) using the nearest-neighbor forecasting
method, also called cross mapping [40]. Pearson’s correlation between the estimatedx(t) and
observedx(t) reflects the causal effect of x on y, called “cross map skill” [39]. In analysis, the embedding dimension (E) were set according to the simplex projection results [40]. Time-delayed effect (tp) were set as 0–6 months for detecting the time lags [41].
Given the seasonality of HFRS incidence, climate variables, and rodent population density, the seasonal component and the response of HFRS risk and rodent population density to the anomalies of other variables were examined to avoid spurious correlations. For each variable, 1500 surrogate time series having the same degree of shared seasonality, but with randomized anomalies, were generated for seasonal surrogate test. For a specific variable, the month of year average (seasonal cycle) was calculated first, and the seasonal anomaly was represented by the difference between the observed value and the seasonal cycle. Then the random shuffling of the time series data of seasonal anomalies was added back to the season average [42]. The above analysis was implemented in the “rEDM” package in R.
The SEOV-related HFRS transmission model
We estimated the epidemiological parameters for HFRS epidemics in Huludao City by fitting the time series from the observed monthly incidence and rodent population density to a dis-crete-time susceptible-infection model in the Bayesian framework (Table 1) [43].
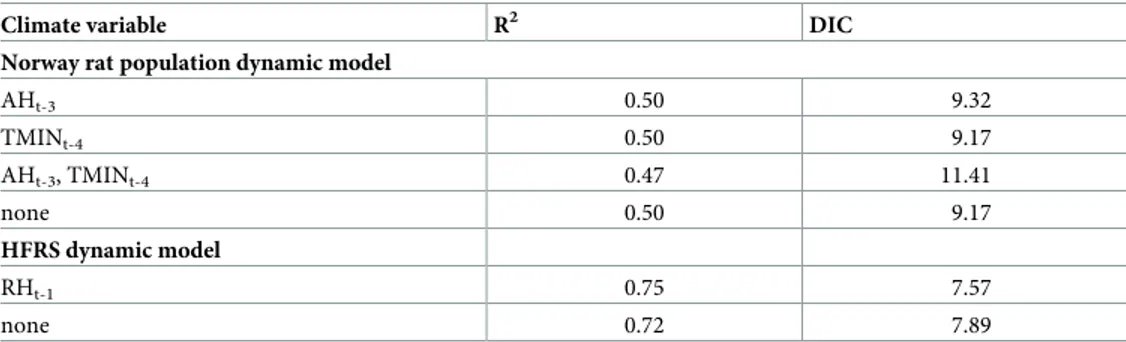
Table 1. The goodness of fit for the candidate models for Norway rat population and HFRS dynamics.
Climate variable R2 DIC
Norway rat population dynamic model
AHt-3 0.50 9.32 TMINt-4 0.50 9.17 AHt-3, TMINt-4 0.47 11.41 none 0.50 9.17 HFRS dynamic model RHt-1 0.75 7.57 none 0.72 7.89 https://doi.org/10.1371/journal.pntd.0007757.t001
Norway rat population dynamic model. First, we modelled the Norway rat population
dynamic model based on Verhulst-Pearl logistic growth model [44], without consideration of SEOV infection, and identified the effect of climate on population fluctuation. Population fluctuations are regulated by an identical seasonal birth rate(b), natural mortality (m),
envi-ronmental carrying capacity(K), and potential extrinsic effect (θr) inEq (1). There is no
significant sex difference in the Norway rat population in our study area [45]. To reduce the dimensionality of the model, age classes were omitted.
RN;tþ1¼RN;tþbRN;t ðmþyrþ
RN;t
K ÞRN;t ð1Þ
Here, 1 month is used as the time interval in the time-discrete model;b represents an array
consisting of 12 values, representing the reproduction rates of the rodent population over 12 months. As Norway rat breeds throughout the year in the regions studied [45], all of the repro-duction rates were set at >0.m denotes the natural mortality of the Norway rat population,
whose mean life span is generally not more than 1 year [46].K represents the environmental
carrying capacity and is used to model the environmental pressure from intraspecific competi-tion for food availability or other resources. For identifying the extrinsic effect on Norway rat population fluctuation, we constructedθrto reflect the potential climate effect. Based on the
results of the correlation analyses and CCM, minimum temperature and absolute humidity were potential drivers for rodent population dynamics. We constructed equationθr= δ1TMINt-4+δ2AHt-3+ε, where TMIN and AH refer to monthly mean minimum temperature
and absolute humidity, respectively, and the parametersδ1andδ2quantify the degree of
cli-mate effect andε is an intercept.
Integrated SEOV-related HFRS transmission model. The mathematical model for host
rodent population outlined inEq (1)can be extended to incorporate rodent-human SEOV transmission. SEOV infections were modeled as occurring among rodents and from rodents to humans in Eqs(2)–(4). The rodent host population (RN) was divided into two classes:
sus-ceptible (RS) and infected (RI). A susceptible rodent could be infected when bitten by an
infec-tious rodent or by inhaling air contaminated with SEOV in the excrement from infecinfec-tious rodents [47].
RS;tþ1¼RS;tþbRN;t ðmþyrþ
RN;t
K ÞRS;t RS;tbRRI;t ð2Þ
RI;tþ1¼RI;tþRS;tbRRI;t ðm þ yrþ
RN;t K ÞRI;t ð3Þ HI;tþ1¼ rHS;tbt ðRI;tþ tÞ a HN;t ð4Þ
In the above equations, all newborn rats were regarded as being susceptible to infection because there is no vertical transmission of SEOV [47]. Given that there is evidence that SEOV infection has no evident impact on death and fertility in Norway rat [48], we did not differenti-ate mortality (m) and birthrate (b) between RSandRI.βRis the transmission rate between
rodents andα allows for non-linear contacts from rodents to humans. HNrepresents the
whole human population andHSrepresents susceptible human population. Observed cases YIare assumed to be correlated to the unobserved number of cases according to a binomial
observation process with constant observation rateρ, due to non-reporting from mild
ρ (0.006, 0.002–0.009) was assessed from our epidemiological survey. βtrepresents SEOV
transmission, which contains seasonal contact rates between rodents and humansβseaand
cli-mate-driven transmission potentialβcli,βt=βseaβcli. Based on the results of the correlation
analyses and CCM, a causal relationship between relative humidity and HFRS incidence was detected. Therefore, we constructed thatβcli=δ3RH γ t-1, where RHt-1was relative humidity
with 1-month lag, andδ3was used to quantify the effect of relative humidity on HFRS
trans-mission dynamics andγ allowed for the non-linearity of the effect. The results of the estima-tion forγ and δ3were the mainly focused where the direction of the climate effect depends on
whetherγ (δ3>0) is positive or negative. All parameter settings are shown inTable 2.
The Markov chain Monte Carlo (MCMC) sampling method was used for parameter esti-mation with the MATLAB toolbox delayed rejection adaptive metropolis algorithm [49]. The values of the parameters were estimated by sampling from the convergent posterior distribu-tions of the Markov chains. Gelman-Rubin-Brooks MCMC convergence diagnostic was used to test convergence by identifying whether the series came from a stable distribution or not [50]. Prior distributions of the parameters were mainly set according to scientific literature and values of biological relevance, but those parameters that lacked prior information were set to a large variance (100) with no boundaries (Table 2). The chains were set to perform 1 mil-lion iterations with burn-in of 20,000. Deviance information criterion (DIC) was used to mea-sure the goodness of fit for the models with various framework, and a difference value >10 was regarded to be significant. R2was used to measure the interpretability of the model for the observed data.
Results
HFRS epidemics in Huludao City
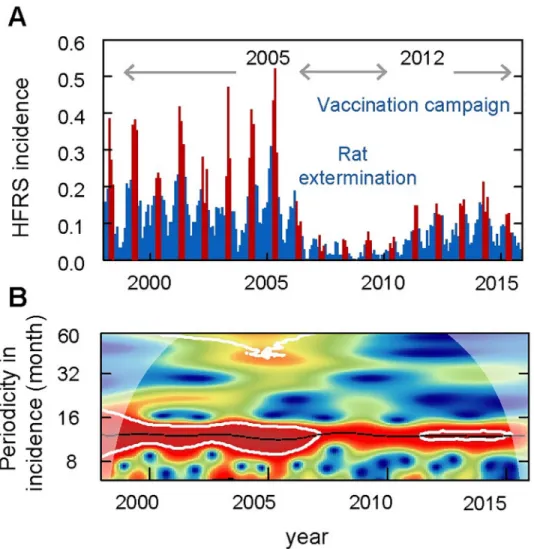
During 1998 to 2015, 6796 HFRS cases were reported in Huludao City, with an annual inci-dence from 2.50 (1/100,000, minimum in 2008) to 26.99 (1/100,000, maximum in 2005). The pattern of HFRS incidence showed a significant seasonality with an annual peak in spring from March to May (Fig 1,S2 Fig). The epidemic variability could be divided into three peri-ods: period I (1998–2004), characterized by a high-level of HFRS incidence of over 17.6 (1/ 100,000) and a stable periodicity without limited intervention; period II (2005–2012), vaccina-tion campaign and rat exterminavaccina-tion program were implemented simultaneously and the local HFRS incidence decreased dramatically to a relatively low level at 10.0 (1/100,000); period III (2013–2015), the incidence of HFRS gradually rebounded. By using wavelet analysis, we found changes in endemic periodicity after 2006 (Fig 1B), possibly due to the rat extermination program and mass vaccination campaign that were conducted beginning in 2005. Here, to reduce the effect of human interventions on disease dynamics, we focused our analysis on the study period between 1998 and 2004 (period I). In period I, a total of 3914 HFRS cases were reported. The local rodent community mainly comprised Norway rat and the house mouse, with the former accounting for 94.52% of the total. The population density of the rodents ran-ged from 4.89% to 7.28%, with two relatively low values in January of 1998 and 1999.
Causal relationships between environmental factors, Norway rat
population density and HFRS transmission risk
We first examined the impact of land use and land cover changes on HFRS transmission. Land use changed very slightly in period I (S3 Fig), so the effect of habitat and land use change on rodent hosts and disease transmission were minimal during this time period. We then con-ducted a cross-correlation analysis of the climate variables, rodent population density, and
HFRS incidence. The Norway rat population was found to be positively correlated with mean temperature (Pearson’sr = 0.23, P < 0.05), maximum temperature (r = 0.25, P < 0.05),
mini-mum temperature (r = 0.23, P < 0.05), cumulative precipitation (r = 0.28, P < 0.05), and
abso-lute humidity (r = 0.24, P < 0.05), with the maximum correlation coefficients occurring at 3, 3,
4, 4, and 4-month time lags, respectively (S4A Fig). HFRS incidence was strongly correlated with the climate variables. All the tested climate variables showed significant negative correla-tions with HFRS incidence, and maximum cross-correlacorrela-tions between temperature and HFRS incidence occurred at a lag of 3 months and other climate variables at a lag of 2 months
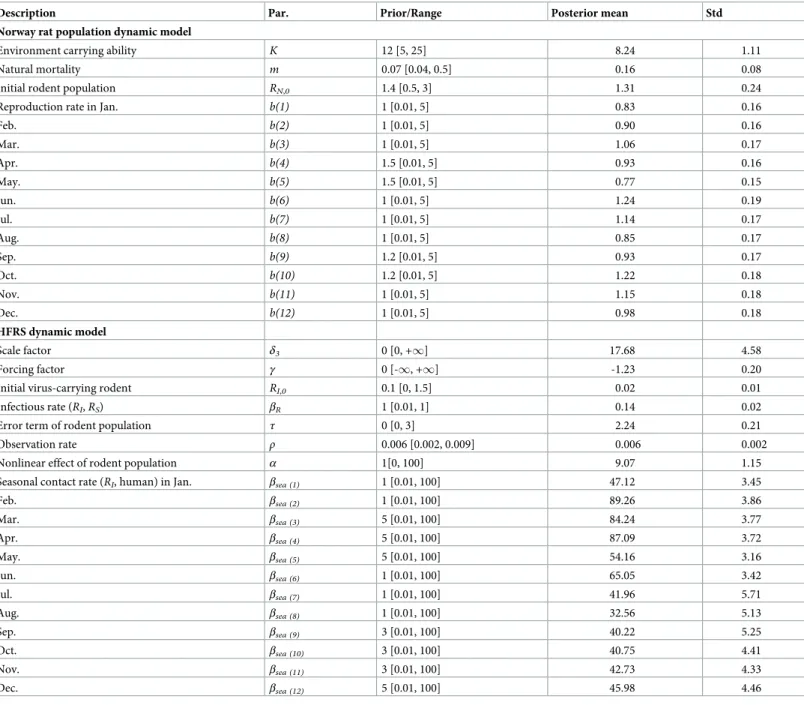
Table 2. The prior setting and posterior probability for parameters in the optimal model.
Description Par. Prior/Range Posterior mean Std
Norway rat population dynamic model
Environment carrying ability K 12 [5, 25] 8.24 1.11
Natural mortality m 0.07 [0.04, 0.5] 0.16 0.08
Initial rodent population RN,0 1.4 [0.5, 3] 1.31 0.24
Reproduction rate in Jan. b(1) 1 [0.01, 5] 0.83 0.16
Feb. b(2) 1 [0.01, 5] 0.90 0.16 Mar. b(3) 1 [0.01, 5] 1.06 0.17 Apr. b(4) 1.5 [0.01, 5] 0.93 0.16 May. b(5) 1.5 [0.01, 5] 0.77 0.15 Jun. b(6) 1 [0.01, 5] 1.24 0.19 Jul. b(7) 1 [0.01, 5] 1.14 0.17 Aug. b(8) 1 [0.01, 5] 0.85 0.17 Sep. b(9) 1.2 [0.01, 5] 0.93 0.17 Oct. b(10) 1.2 [0.01, 5] 1.22 0.18 Nov. b(11) 1 [0.01, 5] 1.15 0.18 Dec. b(12) 1 [0.01, 5] 0.98 0.18 HFRS dynamic model Scale factor δ3 0 [0, +1] 17.68 4.58 Forcing factor γ 0 [-1, +1] -1.23 0.20
Initial virus-carrying rodent RI,0 0.1 [0, 1.5] 0.02 0.01
Infectious rate (RI,RS) βR 1 [0.01, 1] 0.14 0.02
Error term of rodent population τ 0 [0, 3] 2.24 0.21
Observation rate ρ 0.006 [0.002, 0.009] 0.006 0.002
Nonlinear effect of rodent population α 1[0, 100] 9.07 1.15
Seasonal contact rate (RI, human) in Jan. βsea (1) 1 [0.01, 100] 47.12 3.45
Feb. βsea (2) 1 [0.01, 100] 89.26 3.86 Mar. βsea (3) 5 [0.01, 100] 84.24 3.77 Apr. βsea (4) 5 [0.01, 100] 87.09 3.72 May. βsea (5) 5 [0.01, 100] 54.16 3.16 Jun. βsea (6) 1 [0.01, 100] 65.05 3.42 Jul. βsea (7) 1 [0.01, 100] 41.96 5.71 Aug. βsea (8) 1 [0.01, 100] 32.56 5.13 Sep. βsea (9) 3 [0.01, 100] 40.22 5.25 Oct. βsea (10) 3 [0.01, 100] 40.75 4.41 Nov. βsea (11) 3 [0.01, 100] 42.73 4.33 Dec. βsea (12) 5 [0.01, 100] 45.98 4.46
Std, standard deviation of the sample mean.
(S4B Fig). Given the survival time of hantavirus outside the host and the incubation period for HFRS [51,52], the longest time lag was set as 6 months.
Convergent cross mapping (CCM) was used to detect causality between these time series. However, rodent data had weak cross mapping skills for the climate variables. Only a margin-ally significant, weak causal effect was found between minimum temperature (with a 4-month lag, tp = -4) and absolute humidity (with a 3-month lag, tp = -3) on rodent population density, with cross map skills of 0.18 and 0.12, respectively (S5 Fig). To test the non-stationary (tran-sient) correlation between Norway rat and climate variation, we conducted a further test of wavelet coherence analysis. The results showed scattered and small-sized distribution of signif-icant areas with inconsistent phase differences (S6 Fig). In all, the combined results indicate that there might be a weak causal relationship between Norway rat and climate variables. Only relative humidity with a 1-month lag was identified as a significant causal factor for HFRS transmission (cross map skill, 0.86) by the CCM method (S7 Fig). The significance test distin-guished anomalies of climate effects from shared seasonal cycle effects (S7B Fig).
Fig 1. Seasonality and periodicity of hemorrhagic fever with renal syndrome (HFRS) incidence in Huludao City, 1998 to 2015. (A) HFRS incidence per month. Red bars represent disease incidence in spring (March to May), while
blue bars represent the other months. (B) Periodic variety of HFRS incidence. Colors indicate the power of the wavelet, where red to blue represent strong to weak power and the black line indicates the maximum power. The white line represents statistical significance (P < 0.05).
Model validation
To quantify the effect of climatic factors on rodent population density, we tested the models (seeMaterials and methodsfor details) withθrcontaining (i) minimum temperature, (ii)
abso-lute humidity, (iii) both variables, and (iv) none of these climate variables. The goodness of fit
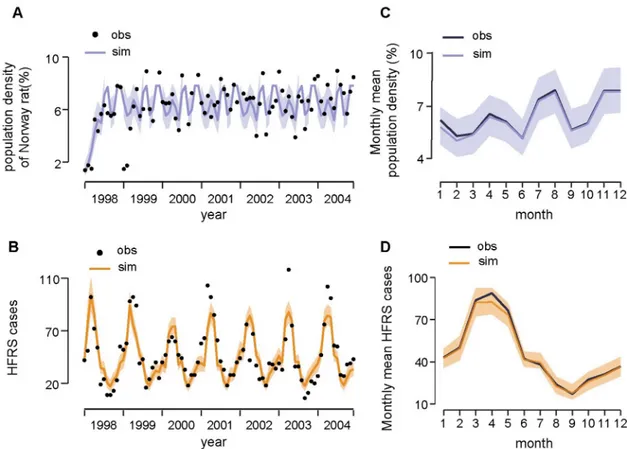
for all the candidate models is provided inTable 1. The model without the climate influence was regarded as optimal to infer the population dynamics of Norway rat in a local urban set-ting (DIC = 9.17, R2= 0.50,Fig 2A). The reproduction rates of the local Norway rat popula-tion, as estimated by our model, peaked in June, July, and October, and reached the lowest level in May and August (Table 2). The average life span of the Norway rat is estimated to be about 6 months, and the local environmental carrying capacity is estimated to be 8.24. The trace plot of Markov chains and the posterior distribution for the parameters in the optimal rodent model is shown inS8 Fig. All the parameter traces have passed the convergence test. Based on the causal relationship tested by CCM, we constructed a HFRS dynamic model containing the infected rodent population and seasonal contact rate to quantify the specific effect of relative humidity on risk of HFRS (seeMaterials and methodsfor details). We con-structed two models: one containing relative humidity and the other without. The model with relative humidity had a slightly better fit when the simulated HFRS cases correlated well with the observations and 75% of the variance was explained (R2= 0.75, DIC = 5.57) (Fig 2B), rela-tive to the model without relarela-tive humidity (R2= 0.72, DIC = 7.89). The optimal models also
Fig 2. Fitting results of the dynamic model. (A) Time series of Norway rat population density and (B) HFRS cases. Black points
indicate the real observations (obs) and lines indicate the simulated (sim) time series. Shaded areas indicate the 95% credible interval. (C) The season pattern of Norway rat population density and (D) HFRS cases. The 5% and 95% of simulated data are shown in shaded area.
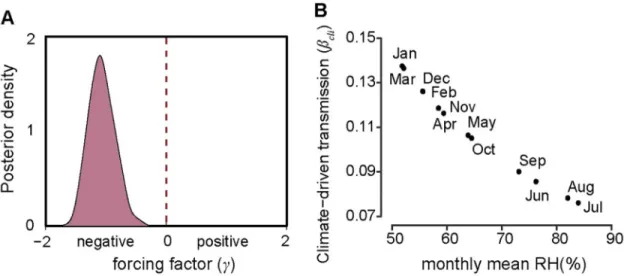
captured the main seasonal patterns of both the rodent population density and reported cases (Fig 2C and 2D). The parameterγ in βcli=δ3RH γ t-1, was estimated to be −1.23 (95% CI,
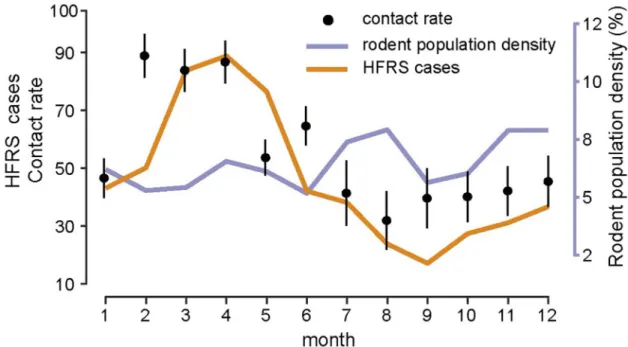
-1.62– -0.83) (Fig 3A), indicating that relative humidity had a negative impact on HFRS trans-mission (Fig 3B). Additionally, during winter–spring, the estimated seasonal contact rates peaked from February to April (Fig 4), which may result from the behaviors of human and rodent. Most of the patients are farmers (77%) and it’s the slack time of winter-spring when people stay at home. Besides, due to the severe weather outside during that time, Norway rats would live and feed in closer proximity to human residence for favorable living conditions and available food, which could be a reason for the high contact rate. The trace plot of Markov chains and the posterior distribution for the parameters used in the optimal HFRS transmis-sion model are shown inS9 Fig.
Discussion
We used a mathematical model to quantify the impact of intrinsic and extrinsic factors on risk of HFRS, and to test the mechanistic understanding of HFRS transmission dynamics in a SEOV endemic area of China. By analyzing time-series data of Norway rat populations and SEOV infections, we found that the population dynamics of Norway rat in urban settings were relatively well-predicted by a simple model which excluded climatic conditions. Unusually, we demonstrated that a potential biotic driver (relative humidity) could enhance predictive ability of the HFRS transmission analysis.
Our results highlight the crucial role of mass immunization campaigns and rat extermina-tion program in HFRS transmission control. It should be noted that SEOV infecextermina-tions began to rise again after 2013 in the post-vaccination era. In HFRS endemic areas where hosts are mainly wild rodents, fluctuations in the population density of wild rodents, such as striped field mouse or bank vole, are influenced by climatic factors and can mediate the effect of mate on the risk of HFRS transmission, mainly because of the close association between cli-mate and host food supply [53]. However, in the SEOV-endemic area, the CCM results showed that the change in population density of the Norway rat was insensitive to climate
Fig 3. Force of infection and transmission rate of the seasonality of HFRS risk. (A) Posterior distribution of climate-driven
transmission potential (βcli), represented by forcing factor (γ). The power function with negative exponent (γ) means a negative
relationship between transmission and relative humidity. (B) The effect of seasonal changes in relative humidity on climate-driven transmission potential estimated fromEq (4).
variability. Our results differed from those of a previous study which found a relationship among the virus-carrying index, climate variables, and HFRS incidence by using structural equation modeling (SEM). This study reported that the Norway rat served as an important mediator of disease transmission when climate variability was found to influence the risk of HFRS [54]. This inconsistency may be due to a difference in sampling frequency as we sur-veyed on a monthly basis, while Guan et al. (2009) sampled quarterly. Additionally, the SEM analysis used a latent variable to account for measurement error but did not evaluate the con-tribution of specific variables to the transmission dynamics.
Norway rat is a domestic rodent whose lifestyle differs greatly from those of wild rodents. Norway rat lives in residential areas and feeds on various food items from humans instead of field crops [55]. Food resources and habitats are relatively stable and change only slightly with climate variability. Additionally, Norway rats breed throughout the year in Huludao City, where the winter temperatures rarely drop below−10 ˚C and residential areas have warmer conditions because of the winter heating policy in China. Winter breeding of wild rodents is limited because of low temperatures [56].
Our findings indicated that an abiotic factor, relative humidity, was a critical indicator of HFRS risk in the SEOV-endemic area of Huludao City, which is consistent with previous stud-ies in which SEOV was the main virus type [57,58]. We assumed that relative humidity may be associated with the survival or infectivity of SEOV in the environment, the activity of the rodent, and human hosts or the transmission process, although the underlying mechanism is not clear. We do not know of any relevant experiments on how environmental conditions affect survival of SEOV outside the host, while PUUV and HTNV have been confirmed to have longer infective periods at low temperatures and high humidities in experimental envi-ronments [59]. In our model, interannual variation in SEOV infections was partly explained by changes in relative humidity. A less intense outbreak in 2000 might be associated with a lower relative humidity-driven transmission potential (Fig 2B).
Fig 4. Season epidemics, rodent population dynamics and estimated contact rate. Error bars show the 95% credible intervals.
Some limitations in our study should be mentioned. First, rodent population density was extremely low in the springs of 1998 and 1999, which reduced the overall explanatory ability of our model. Second, prevalence of SEOV infection in Norway rats was assessed by mathemati-cal model due to lack of available data. Third, to ameliorate the influence of vaccination cam-paign and other interventions, only the selected time range of data was used to detect the relationship between intrinsic/extrinsic drivers and SEOV transmission. Further efforts should be made to improve model reliability through efforts such as addition of data to the available dataset. More attention should be paid to the association between economic development, such as infrastructure improvement, the spatial distribution of Norway rat, and induced SEOV infections across districts in subsequent studies.
The SEOV-related HFRS is posing a health threat to an increasing number of people. Although the Norway rat is found everywhere, SEOV cases are not. We suspect this may mainly be due to increased surveillance and attention focused on this pathogen, as SEOV pre-viously caused many asymptomatic human infections prepre-viously. In conclusion, based on the longitudinal and complete dataset, our study yielded a proper framework for understanding the intrinsic transmission dynamics and extrinsic effects on HFRS risk caused by SEOV, espe-cially at the human-animal-environment interface. The framework can be flexibly adjusted when more information is available. Furthermore, we provided clues to potential environmen-tal drivers on SEOV transmission dynamics, which would be useful for further research related to public health issues.
Supporting information
S1 Fig. The geographical location of Huludao City. (A) Huludao City (orange) is located in
northwest of Liaoning Province, adjacent to the Bohai sea. (B) Liaoning Province is highlighted in red in China map.
(TIF)
S2 Fig. Seasonal distribution of HFRS cases over three periods.
(TIF)
S3 Fig. Land cover composition in Huludao City from 1998 to 2015. The land cover
classifi-cation is according to IPCC land categories. Other includes shrubland, sparse vegetation, bare area and water.
(TIF)
S4 Fig. The relationship between hemorrhagic fever with renal syndrome (HFRS) inci-dence, Norway rat population density and environmental variables with time lags. (A)
Cross-correlations between the population density of Norway rats and the climate variables. (B) Cross-correlations between HFRS and climate variables. TM, monthly mean temperature; TMAX, monthly mean maximum temperature; TMIN, monthly mean minimum temperature; PREC, monthly cumulative precipitation; RH, monthly mean relative humidity; AH, monthly mean absolutely humidity; RN.(t), Norway rat population density at time t; IN.(t), HFRS inci-dence at time t.
(TIF)
S5 Fig. The causal relationship between climate variables and rodent host population, and between climate variables and HFRS incidence. (A) The convergent cross mapping results
for Norway rat population density and climate variables with time lags (tp) and for HFRS inci-dence (B). The causal relationship was regarded as significant (P < 0.05) when the solid line (cross map skill of the observed data) exceeded the dashed line (surrogate data). TM, monthly
mean temperature; TMAX, monthly mean maximum temperature; TMIN, monthly mean minimum temperature; PREC, monthly cumulative precipitation; RH, monthly mean relative humidity; AH, monthly mean absolutely humidity.
(TIF)
S6 Fig. Wavelet coherence between Norway rat population density and climate variables from 1998 to 2004. Arrows showed phase differences between Norway rat population density
and climate variables. The straight down represents climate variables lead Norway rat popula-tion density 1/4 period. Legend is wavelet coherence level. The parts inside white contour shows a significant relationship. The parts outside the transparent cone have affected by edge effect. TM, monthly mean temperature; TMAX, monthly mean maximum temperature; TMIN, monthly mean minimum temperature; PREC, monthly cumulative precipitation; RH, monthly mean relative humidity; AH, monthly mean absolutely humidity; RN, Norway rat population density.
(TIF)
S7 Fig. Detecting cross-map causality beyond shared seasonality of environmental drivers on hemorrhagic fever with renal syndrome. (A) Time series of hemorrhagic fever with renal
syndrome (HFRS) incidence (orange) and relative humidity (green). (B) The convergent cross mapping results at different time series length for HFRS incidence and relative humidity (RH) and surrogate RH (surr_RH) with 1-month lag (tp = -1). The causal relationship was regarded as significant (P < 0.05) when the solid line (cross map skill of the observed data) exceeded the dashed line (surrogate data).
(TIF)
S8 Fig. Estimated parameters in Norway rat population dynamic model. (A) The trace plot
of markov chains of the parameters after 1 million burn-in. (B) The posterior distribution of the parameters after 1 million burn-in. All the estimations have passed the Gelman-Rubin-Brooks MCMC convergence diagnostic.
(TIF)
S9 Fig. Estimated parameters in HFRS transmission dynamic model. (A) The trace plot of
markov chains of the parameters after 1 million burn-in. (B) The posterior distribution of the parameters after 1 million burn-in. All the estimations have passed the Gelman-Rubin-Brooks MCMC convergence diagnostic.
(TIF)
Author Contributions
Conceptualization: Huaiyu Tian. Data curation: Guoqing Yang. Formal analysis: Yidan Li, Jun Cai.Methodology: Bernard Cazelles, Marko Laine, Zheng X. Y. Huang.
Writing – original draft: Yidan Li, Hua Tan, Nils Chr. Stenseth, Huaiyu Tian.
References
1. Kariwa H, Yoshimatsu K, Arikawa J. Hantavirus infection in east Asia. Comp Immunol Microbiol Infect Dis. 2007; 30(5–6): 341–56.https://doi.org/10.1016/j.cimid.2007.05.011PMID:17655929
2. Zhang Y-Z, Zou Y, Fu ZF, Plyusnin A. Hantavirus infections in humans and animals, China. Emerg Infect Dis. 2010; 16(8): 1195.https://doi.org/10.3201/eid1608.090470PMID:20678311
3. Plyusnin A, Vapalahti O, Vaheri A. Hantaviruses: genome structure, expression and evolution. J Gen Virol. 1996; 77(11): 2677–87.https://doi.org/10.1099/0022-1317-77-11-2677PMID:8922460
4. Plyusnin A, Morzunov S. Virus evolution and genetic diversity of hantaviruses and their rodent hosts. Hantaviruses: Springer Berlin Heidelberg; 2001. pp. 47–75.
5. Tian H, Hu S, Cazelles B, Chowell G, Gao L, Laine M, et al. Urbanization prolongs hantavirus epidemics in cities. Proc Natl Acad Sci USA. 2018; 115(18): 4707–12.https://doi.org/10.1073/pnas.1712767115
PMID:29666240
6. Metcalf CJE, Walter KS, Wesolowski A, Buckee CO, Shevliakova E, Tatem AJ, et al. Identifying climate drivers of infectious disease dynamics: recent advances and challenges ahead. Proc Biol Sci. 2017; 284(1860).https://doi.org/10.1098/rspb.2017.0901PMID:28814655
7. Roda Gracia J, Schumann B, Seidler A. Climate Variability and the Occurrence of Human Puumala Hantavirus Infections in Europe: A Systematic Review. Zoonoses Public Health. 2015; 62(6): 465–78.
https://doi.org/10.1111/zph.12175PMID:25557350
8. Tian H, Stenseth NC. The ecological dynamics of hantavirus diseases: From environmental variability to disease prevention largely based on data from China. PLoS Negl Trop Dis. 2019; 13(2): e0006901.
https://doi.org/10.1371/journal.pntd.0006901PMID:30789905
9. Tian HY, Yu PB, Luis AD, Bi P, Cazelles B, Laine M, et al. Changes in rodent abundance and weather conditions potentially drive hemorrhagic fever with renal syndrome outbreaks in Xi’an, China, 2005– 2012. PLoS Negl Trop Dis. 2015; 9(3): e0003530.https://doi.org/10.1371/journal.pntd.0003530PMID:
25822936
10. Clement J, Maes P, Van Ypersele de Strihou C, van der Groen G, Barrios JM, Verstraeten WW, et al. Beechnuts and outbreaks of nephropathia epidemica (NE): of mast, mice and men. Nephrol Dial Trans-plant. 2010; 25(6): 1740–6.https://doi.org/10.1093/ndt/gfq122PMID:20237057
11. Yates TL, Mills JN, Parmenter CA, Ksiazek TG, Parmenter RR, Vande Castle JR, et al. The ecology and evolutionary history of an emergent disease: hantavirus pulmonary syndrome: evidence from two El Niño episodes in the American southwest suggests that El Niño–driven precipitation, the initial cata-lyst of a trophic cascade that results in a delayed density-dependent rodent response, is sufficient to predict heightened risk for human contraction of hantavirus pulmonary syndrome. Biosci. 2002; 52(11): 989–98.
12. Clement J, Vercauteren J, Verstraeten WW, Ducoffre G, Barrios JM, Vandamme AM, et al. Relating increasing hantavirus incidences to the changing climate: the mast connection. Int J Health Geogr. 2009; 8(1): 1.https://doi.org/10.1186/1476-072x-8-1PMID:19149870
13. Piechotowski I, Brockmann SO, Schwarz C, Winter CH, Ranft U, Pfaff G. Emergence of hantavirus in South Germany: rodents, climate and human infections. Parasitol Res. 2008; 103 Suppl 1: S131–7.
https://doi.org/10.1007/s00436-008-1055-8PMID:19030895
14. Tian H, Yu P, Cazelles B, Xu L, Tan H, Yang J, et al. Interannual cycles of Hantaan virus outbreaks at the human-animal interface in Central China are controlled by temperature and rainfall. Proc Natl Acad Sci USA. 2017; 114(30): 8041–6.https://doi.org/10.1073/pnas.1701777114PMID:28696305
15. Himsworth CG, Parsons KL, Jardine C, Patrick DM. Rats, cities, people, and pathogens: a systematic review and narrative synthesis of literature regarding the ecology of rat-associated zoonoses in urban centers. Vector Borne Zoonotic Dis. 2013; 13(6): 349–59.https://doi.org/10.1089/vbz.2012.1195PMID:
23590323
16. Clement J, LeDuc JW, Lloyd G, Reynes J-M, McElhinney L, Van Ranst M, et al. Wild Rats, Laboratory Rats, Pet Rats: Global Seoul Hantavirus Disease Revisited. Viruses. 2019; 11(7): 652.https://doi.org/ 10.3390/v11070652PMID:31319534
17. Costa F, Porter FH, Rodrigues G, Farias H, de Faria MT, Wunder EA, et al. Infections by Leptospira interrogans, Seoul virus, and Bartonella spp. among Norway rats (Rattus norvegicus) from the urban slum environment in Brazil. Vector Borne Zoonotic Dis. 2014; 14(1): 33–40.https://doi.org/10.1089/vbz. 2013.1378PMID:24359425
18. Song G. Epidemiological progresses of hemorrhagic fever with renal syndrome in China. Chin Med J (Engl). 1999; 112(5): 472–7.
19. Jameson L, Logue C, Atkinson B, Baker N, Galbraith S, Carroll M, et al. The continued emergence of hantaviruses: isolation of a Seoul virus implicated in human disease, United Kingdom, October 2012. Euro Surveill. 2013; 18(1): 20344. PMID:23305714
20. Heyman P, Plyusnina A, Berny P, Cochez C, Artois M, Zizi M, et al. Seoul hantavirus in Europe: first demonstration of the virus genome in wild Rattus norvegicus captured in France. Eur J Clin Microbiol Infect Dis. 2004; 23(9): 711–7.https://doi.org/10.1007/s10096-004-1196-3PMID:15322934
21. Kerins JL, Koske SE, Kazmierczak J, Austin C, Gowdy K, Dibernardo A. Outbreak of Seoul virus among rats and rat owners—United States and Canada, 2017. Canada communicable disease report = Releve des maladies transmissibles au Canada. 2018; 44(2): 71–4.https://doi.org/10.14745/ccdr. v44i02a07PMID:29770103
22. Wang H, Yoshimatsu K, Ebihara H, Ogino M, Araki K, Kariwa H, et al. Genetic diversity of hantaviruses isolated in China and characterization of novel hantaviruses isolated from Niviventer confucianus and Rattus rattus. Virology. 2000; 278(2): 332–45.https://doi.org/10.1006/viro.2000.0630PMID:11118357
23. Zhang YZ, Zou Y, Fu ZF, Plyusnin A. Hantavirus infections in humans and animals, China. Emerg Infect Dis. 2010; 16(8): 1195.https://doi.org/10.3201/eid1608.090470PMID:20678311
24. Zhang YZ, Zhang FX, Gao N, Wang JB, Zhao ZW, Li MH, et al. Hantaviruses in rodents and humans, inner Mongolia Autonomous region, China. Emerg Infect Dis. 2009; 15(6): 885.https://doi.org/10.3201/ eid1506.081126PMID:19523286
25. Lin XD, Guo WP, Wang W, Zou Y, Hao ZY, Zhou DJ, et al. Migration of Norway rats resulted in the worldwide distribution of Seoul hantavirus today. J Virol. 2012; 86(2): 972–81.https://doi.org/10.1128/ JVI.00725-11PMID:22090114
26. Yan L, Fang L-Q, Huang H-G, Zhang L-Q, Feng D, Zhao W-J, et al. Landscape elements and Hantaan virus–related hemorrhagic fever with renal syndrome, People’s Republic of China. Emerg Infect Dis. 2007; 13(9): 1301.https://doi.org/10.3201/eid1309.061481PMID:18252099
27. Kim WK, No JS, Lee SH, Song DH, Lee D, Kim JA, et al. Multiplex PCR-based next-generation sequencing and global diversity of seoul virus in humans and rats. Emerg Infect Dis. 2018; 24(2): 249.
https://doi.org/10.3201/eid2402.171216PMID:29350137
28. Clement J, LeDuc JW, McElhinney LM, Reynes J-M, Van Ranst M, Calisher CH. Clinical characteristics of ratborne seoul hantavirus disease. Emerg Infect Dis. 2019; 25(2): 387.https://doi.org/10.3201/ eid2502.181643PMID:30666956
29. Lixin Chen. Epidemiological survey of hemorrhagic fever with renal syndrome in Huludao City from 1992 to 2001. Chinese Journal of Vector Biology and Control. 2004; 15(6): 465–6.
30. WR G, TF s. Epidemiological analysis of Hemorrhagic with Renal Syndrome in Huludao city from 1997– 2001. China J Vector Biology & control. 2003; 14: 145–6.
31. Lei C, Hongbo Y, Ping W. Effect evaluation of intervention measures for hemorrhagic fever with renal syndrome in Shenyang. Strait Journal of Preventive Medicine. 2014; 3: 34–5.
32. Xiao H, Tian HY, Cazelles B, Li XJ, Tong SL, Gao LD, et al. Atmospheric moisture variability and transmission of hemorrhagic fever with renal syndrome in Changsha City, Mainland China, 1991– 2010. PLoS Negl Trop Dis. 2013; 7(6): 2260.https://doi.org/10.1371/journal.pntd.0002260PMID:
23755316
33. Zhang YZ, Dong X, Li X, Ma C, Xiong HP, Yan GJ, et al. Seoul virus and hantavirus disease, Shenyang, People’s Republic of China. Emerg Infect Dis. 2009; 15(2): 200–6.https://doi.org/10.3201/eid1502. 080291PMID:19193263
34. Zhang X, Guo YP, B L. Surveillance on mice in HFRS epidemic focus, Huludao city. China J Vector Biol-ogy & control. 2006; 17: 142–3.
35. Cazelles B, Chavez M, Berteaux D, Menard F, Vik JO, Jenouvrier S, et al. Wavelet analysis of ecologi-cal time series. Oecologia. 2008; 156(2): 287–304.https://doi.org/10.1007/s00442-008-0993-2PMID:
18322705
36. Cazelles B. Symbolic dynamics for identifying similarity between rhythms of ecological time series. Ecol Lett. 2004; 7(9): 755–63.https://doi.org/10.1111/j.1461-0248.2004.00629.x
37. Sugihara G. Nonlinear forecasting for the classification of natural time series. Philosophical Transac-tions of the Royal Society of London Series A: Physical and Engineering Sciences. 1994; 348(1688): 477–95.
38. Sugihara G, May RM. Nonlinear forecasting as a way of distinguishing chaos from measurement error in time series. Nature. 1990; 344(6268): 734.https://doi.org/10.1038/344734a0PMID:2330029
39. Sugihara G, May R, Ye H, Hsieh C-h, Deyle E, Fogarty M, et al. Detecting causality in complex ecosys-tems. science. 2012; 338(6106): 496–500.https://doi.org/10.1126/science.1227079PMID:22997134
40. Sugihara G, May RM. Nonlinear forecasting as a way of distinguishing chaos from measurement error in time series. Nature. 1990; 344(6268): 734–41.https://doi.org/10.1038/344734a0PMID:2330029
41. Ye H, Deyle ER, Gilarranz LJ, Sugihara G. Distinguishing time-delayed causal interactions using con-vergent cross mapping. Sci Rep. 2015; 5: 14750.https://doi.org/10.1038/srep14750PMID:26435402
42. Deyle ER, Maher MC, Hernandez RD, Basu S, Sugihara G. Global environmental drivers of influenza. Proc Natl Acad Sci U S A. 2016; 113(46): 13081–6.https://doi.org/10.1073/pnas.1607747113PMID:
43. Zhou J, Hethcote HW. Population size dependent incidence in models for diseases without immunity. J Math Biol. 1994; 32(8): 809–34.https://doi.org/10.1007/bf00168799PMID:7814995
44. Verhulst P-F. Notice sur la loi que la population suit dans son accroissement. Corresp Math Phys. 1838; 10: 113–26.
45. Decai Y. Analysis on the fecundity of the populations of brown rat and small rat in Dalian port. Chinese Journal of Pest Control. 1991; 7(4): 272–4.
46. Davis DE. The characteristics of rat populations. Q Rev Biol. 1953; 28(4): 373–401.https://doi.org/10. 1086/399860PMID:13121239
47. Glass GE, Childs JE, Korch GW, LeDuc JW. Association of intraspecific wounding with hantaviral infec-tion in wild rats (Rattus norvegicus). Epidemiol Infect. 1988; 101(2): 459–72.https://doi.org/10.1017/ s0950268800054418PMID:3141203
48. Childs JE, Glass GE, Korch GW, LeDuc JW. Effects of hantaviral infection on survival, growth and fertil-ity in wild rat (Rattus norvegicus) populations of Baltimore, Maryland. Journal of Wildlife Diseases. 1989; 25(4): 469–76.https://doi.org/10.7589/0090-3558-25.4.469PMID:2572705
49. Haario H, Laine M, Mira A, Saksman E. DRAM: efficient adaptive MCMC. Stat comput. 2006; 16(4): 339–54.https://doi.org/10.1007/s11222-006-9438-0
50. Cowles MK, Carlin BP. Markov chain Monte Carlo convergence diagnostics: a comparative review. J Am Stat Assoc. 1996; 91(434): 883–904.https://doi.org/10.2307/2291683
51. Hardestam J, Simon M, Hedlund K, Vaheri A, Klingstro¨m J, LundkvistÅ. Ex vivo stability of the rodent-borne Hantaan virus in comparison to that of arthropod-rodent-borne members of the Bunyaviridae family. Appl Environ Microbiol. 2007; 73(8): 2547–51.https://doi.org/10.1128/AEM.02869-06PMID:17337567
52. Young JC, Hansen GR, Graves TK, Deasy MP, Humphreys JG, Fritz CL, et al. The incubation period of hantavirus pulmonary syndrome. Am J Trop Med Hyg. 2000; 62(6): 714–7.https://doi.org/10.4269/ ajtmh.2000.62.714PMID:11304061
53. Makary P, Kanerva M, Ollgren J, Virtanen MJ, Vapalahti O, Lyytikainen O. Disease burden of Puumala virus infections, 1995–2008. Epidemiol Infect. 2010; 138(10): 1484–92.https://doi.org/10.1017/ S0950268810000087PMID:20109263
54. Guan P, Huang D, He M, Shen T, Guo J, Zhou B. Investigating the effects of climatic variables and res-ervoir on the incidence of hemorrhagic fever with renal syndrome in Huludao City, China: a 17-year data analysis based on structure equation model. BMC Infect Dis. 2009; 9(1): 109.https://doi.org/10.1186/ 1471-2334-9-109PMID:19583875
55. Feng AY, Himsworth CG. The secret life of the city rat: a review of the ecology of urban Norway and black rats (Rattus norvegicus and Rattus rattus). Urban Ecosystems. 2014; 17(1): 149–62.https://doi. org/10.1007/s11252-013-0305-4
56. Smyth M. Winter breeding in woodland mice, Apodemus sylvaticus, and voles, Clethrionomys glareolus and Microtus agrestis, near Oxford. J Anim Ecol. 1966; 35(3): 471–85.https://doi.org/10.2307/2486
57. Liu X, Jiang B, Gu W, Liu Q. Temporal trend and climate factors of hemorrhagic fever with renal syn-drome epidemic in Shenyang City, China. BMC Infect Dis. 2011; 11(1): 331.https://doi.org/10.1186/ 1471-2334-11-331PMID:22133347
58. Fang LQ, Wang XJ, Liang S, Li YL, Song SX, Zhang WY, et al. Spatiotemporal trends and climatic fac-tors of hemorrhagic fever with renal syndrome epidemic in Shandong Province, China. PLoS Negl Trop Dis. 2010; 4(8): e789.https://doi.org/10.1371/journal.pntd.0000789PMID:20706629
59. Kallio ER, Klingstrom J, Gustafsson E, Manni T, Vaheri A, Henttonen H, et al. Prolonged survival of Puumala hantavirus outside the host: evidence for indirect transmission via the environment. J Gen Virol. 2006; 87(8): 2127–34.https://doi.org/10.1099/vir.0.81643-0