HAL Id: hal-00789087
https://hal.univ-brest.fr/hal-00789087
Submitted on 15 Feb 2013
HAL is a multi-disciplinary open access
archive for the deposit and dissemination of
sci-entific research documents, whether they are
pub-lished or not. The documents may come from
teaching and research institutions in France or
abroad, or from public or private research centers.
L’archive ouverte pluridisciplinaire HAL, est
destinée au dépôt et à la diffusion de documents
scientifiques de niveau recherche, publiés ou non,
émanant des établissements d’enseignement et de
recherche français ou étrangers, des laboratoires
publics ou privés.
Description of the biogeochemical features of the
subtropical southeastern Atlantic and the Southern
Ocean south of South Africa during the austral summer
of the International Polar Year
F.A Le Moigne, Marie Boye, A. Masson, Rudolph Corvaisier, E. Grossteffan,
A. Gueneugues, Philippe Pondaven
To cite this version:
F.A Le Moigne, Marie Boye, A. Masson, Rudolph Corvaisier, E. Grossteffan, et al.. Description of
the biogeochemical features of the subtropical southeastern Atlantic and the Southern Ocean south
of South Africa during the austral summer of the International Polar Year. Biogeosciences, European
Geosciences Union, 2013, 10, pp.281-295. �10.5194/bg-10-281-2013�. �hal-00789087�
www.biogeosciences.net/10/281/2013/ doi:10.5194/bg-10-281-2013
© Author(s) 2013. CC Attribution 3.0 License.
Biogeosciences
Description of the biogeochemical features of the subtropical
southeastern Atlantic and the Southern Ocean south of South Africa
during the austral summer of the International Polar Year
F. A. C. Le Moigne1,3, M. Boye1, A. Masson1, R. Corvaisier1, E. Grossteffan2, A. Gu´eneugues1, and P. Pondaven1 1Institut Universitaire Europ´een de la Mer (IUEM) UMS3113, Laboratoire des Sciences de l’Environnement Marin
UMR6539, Technopˆole Brest Iroise, 29280 Plouzan´e, France
2Unit´e Mixte de Services (UMS3113), Institut Universitaire Europ´een de la Mer, Technopole Brest-Iroise,
29280 Plouzane, France
3present address: Ocean Biogeochemistry and Ecosystem, National Oceanography Centre, European Way, Southampton
SO14 3ZH, UK
Correspondence to: F. A. C. Le Moigne (f.lemoigne@noc.soton.ac.uk)
Received: 19 January 2012 – Published in Biogeosciences Discuss.: 25 April 2012 Revised: 13 October 2012 – Accepted: 4 December 2012 – Published: 18 January 2013
Abstract. Meridional and vertical distributions of several
biogeochemical parameters were studied along a section in the southeastern Atlantic and the Southern Ocean south of South Africa during the austral summer 2008 of the In-ternational Polar Year to characterize the biogeochemical provinces and to assess the seasonal net diatom production. Based on analyses of macro-nutrients, ammonium (NH4),
chlorophyll a, (Chl a), phaeopigments, biogenic silica (BSi), particulate inorganic carbon (PIC), and particulate organic carbon and nitrogen (POC and PON, respectively), four bio-geochemical domains were distinguished along the section: the subtropical Atlantic, the confluence zone of the sub-tropical and subantarctic domains, the Polar Frontal Zone (PFZ) in the Antarctic Circumpolar Current (ACC), and the north-eastern branch of the Weddell Gyre. The subtropical region displayed extremely low nutrient concentrations fea-turing oligotrophic conditions, and sub-surface maxima of Chl a and phaeopigments never exceeded 0.5 µg L−1 and 0.25 µg L−1, respectively. The anticyclonic and cyclonic ed-dies crossed in the Cape Basin were characterized by a deep-ening and a rise, respectively, of the nutrients isoclines. The confluence zone of the subtropical domain and the northern side of the ACC within the subantarctic domain displayed remnant nitrate and phosphate levels, whereas silicate con-centrations kept to extremely low levels. In this area, Chl a level of 0.4–0.5 µg L−1distributed homogenously within the
mixed layer, and POC and PON accumulated to values up to 10 µM and 1.5 µM, respectively, indicative of biomass ac-cumulation along the confluence zone during the late pro-ductive period. In the ACC domain, the Polar Frontal Zone was marked by a post-bloom of diatoms that extended be-yond the Polar Front (PF) during this late summer condi-tion, as primarily evidenced by the massive depletion of sili-cic acid in the surface waters. The accumulation of NH4to
values up to 1.25 µM at 100 m depth centred on the PF and the accumulation of BSi up to 0.5 µM in the surface waters of the central part of the PFZ also featured a late stage of the seasonal diatom bloom. The silica daily net production rate based on the seasonal depletion of silicic acid was esti-mated to be 11.9 ± 6.5 mmol m−2d−1in the domain of the vast diatom post-bloom, agreeing well with the previously recorded values in this province. The Weddell Gyre occa-sionally displayed relative surface depletion of silicic acid, suggesting a late stage of a relatively minor diatom bloom possibly driven by iceberg drifting releases of iron. In this do-main the estimated range of silica daily net production rate (e.g. 21.1 ± 8.8 mmol m−2d−1)is consistent with previous
studies, but was not significantly higher than that in the Polar Front region.
1 Introduction
The Southern Ocean is deemed to play an important role in the global carbon cycle due to unique features involving both physical circulation and biological processes. In partic-ular, the outcropping of deep water masses allows for the ex-change of gases such as carbon dioxide (CO2)between the
deep sea and the atmosphere, while the incomplete utilisa-tion of nutrients by the marine phytoplankton in this high-nutrient, low-chlorophyll (HNLC) area of the world ocean allows the concentration of CO2 in the atmosphere to be
substantially greater than would be the case if nitrate was used efficiently. Furthermore, the polar–extrapolar communi-cation of heat, freshwater and CO2helps to close the
hydro-logical cycle through the production of Antarctic Intermedi-ate WIntermedi-ater (AAIW) and Subantarctic Mode WIntermedi-ater (SAMW). These water masses transport nutrients northward within the thermocline; by vertical mixing and advection, nutrients can sustain a large part of the primary and export productions at the low latitudes (Sarmiento et al., 2004). The formation of AAIW, SAMW and Antarctic Bottom Water (AABW) can also provide a mechanism for uptake and transport of an-thropogenic CO2 (Caldeira and Duffy, 2000). Models
indi-cate that the response of the Southern Ocean to the global warming will be a critical factor determining the future up-take of anthropogenic CO2by the ocean (Sarmiento and
Tog-gweiler, 1984). However, the Southern Ocean is not a sin-gle vast biogeochemical system. For instance, biogeochemi-cal features separate the Antarctic domain where the air–sea balance of CO2can be mainly controlled by the biological
pump and circulation in the Antarctic deep-waters formation region, from the Subantarctic province where the global ex-port production can be driven by the biological pump and the circulation in the region of the formation of AAIW and SAMW (Marinov et al., 2006). This dividing of the Southern Ocean has evolved into several complex sub-systems, some of which are highly productive whilst others remain biologi-cally poor all year long (Tr´eguer and Jacques, 1992).
At first glance the development and accumulation of phy-toplankton biomass in the Southern Ocean are mainly con-trolled by the light intensity (Nelson and Smith, 1991), the availability of trace elements, especially iron (Martin, 1990), and grazing pressure (Buma et al., 1991; Frost, 1996). How-ever, in the beginning of the productive period, biomass maxima concentrate along the Polar Front (Qu´eguiner et al., 1997), and at the confluence zone of the Subantarctic Front (SAF) and the Subtropical Front (STF) (Banse, 1991), benefiting from favourable and seasonal growth conditions in those regions. The bloom of large, heavily-silicified diatoms developing in late spring in the Polar Front region (Bath-mann et al., 1997) leads to a massive depletion in silicate (Qu´eguiner et al., 1997), and to biogenic silica burial, espe-cially just south of the Polar Front (DeMaster, 1981). The export production in the spring bloom and the burial of bio-genic silica in the Antarctic deep sea occur with very little
co-existing organic matter (DeMaster et al., 1991; Ragueneau et al., 2002). Annual production should be limited to that which can be supported by the annual supply of inorganic nutrients and trace elements to the euphotic zone.
The subtropical south-eastern Atlantic gyre is deemed to be an intense inter-ocean exchange area (Lutjeharms et al., 2003). Most of the leakage between the Indian Ocean and the South Atlantic indeed takes place within the retroflection of the Agulhas current where large eddies are translated to the Atlantic Ocean (Lutjeharms and Vanballegooyen, 1988; Gladyshev et al., 2008). For instance, north of the Subtrop-ical front, nutrients levels such as silicate, nitrate and phos-phate may be extremely low, typical of an oligotrophic region (Longhurst, 1991). Furthermore, the accumulation of nutri-ents and chlorophyll a (chl a) generally follow the general patterns set by currents and meandering in this region (Lut-jeharms and Vanballegooyen, 1988).
In this work we describe the biogeochemical features of the south-eastern Atlantic Ocean and the Southern Ocean south of South Africa based on the distributions of silicate, nitrate, phosphate, ammonium, chl a, phaeopigments, par-ticulate organic carbon (POC), parpar-ticulate organic nitrogen (PON), particulate inorganic carbon (PIC) and biogenic sil-ica (BSi) along a section from the subtropsil-ical domain to the Weddell Sea Gyre along the Greenwich Meridian during the late austral summer of the 2008 International Polar Year.
2 Sampling and analytical procedures
2.1 Sampling
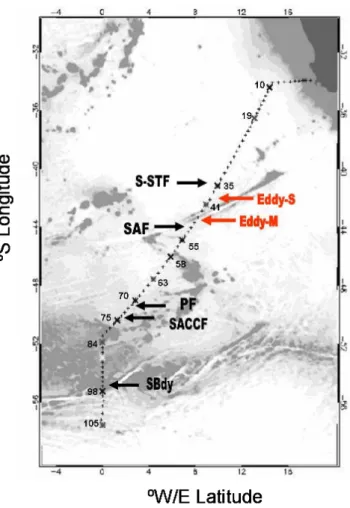
Samples were collected during the multidisciplinary MD166 BONUS-GoodHope cruise that took place during the In-ternational Polar Year in the austral summer 2008 (13 February 2008–24 March 2008) on board the French R/V Marion-Dufresne II sailing from Cape Town, South Africa, to 57◦S along the Greenwich Meridian in the Southern Ocean (Fig. 1). The distribution of silicate, nitrate, phos-phate (Fig. 2), ammonium (Fig. 3), chlorophyll a (Chl a) and phaeopigments (Fig. 4) was studied at 78 stations along the section from surface to 5000 m depth and in the upper 300 m for ammonium, Chl a and phaeopigments. Particulate stocks of organic carbon (POC) and nitrogen (PON), and inorganic carbon (PIC) were sampled at 68 stations in the upper 300 m along the transect, whereas those of biogenic silica (BSi) were sampled at 12 stations (Fig. 5). The distance between consecutive stations varied between 20 and 40 nautical miles. The samples were collected using a CTD-rosette (SBE 32 Seabird) equipped with Niskin bottles. Potential temperature (θ ), salinity (S) and dissolved oxygen (O2)were recorded
us-ing SBE 911+ Seabird probe with SBE3+, SBE4 and SBE43 sensors, respectively (Branellec et al., 2010).
36
Fig. 1. Location of the stations sampled during the MD166
BONUS-GoodHope cruise. Smaller crosses are for the HYDRO sta-tions, grey crosses the LARGE stations and black crosses the SU-PER stations. The positions of fronts are also shown, with the south-ern branch of the Subtropical Front (S-STF; ∼ 42◦2′S), the Sub-Antarctic Front (SAF; 44◦2′S), the Polar Front (PF; 50◦22.4′S), the Southern ACC Front (SACCF; ∼ 51◦52′S) and the Southern Boundary of the ACC (SBdy; ∼ 55◦54.3′S).
2.2 Analytical procedures
2.2.1 Nutrients and ammonium
Silicate, nitrate, phosphate and ammonium concentrations were measured on board the ship. Silicate and nitrate were analysed by standard method with a Bran + Luebbe AAIII auto-analyser as described by Tr´eguer and Le Corre (1979). Samples were run versus daily prepared standards diluted from stock standard solutions in artificial seawater. Phos-phate was determined manually using a spectrophotome-ter (Shimadzu UV 1700) as described by Murphy and Ri-ley (1962). Ammonium was analysed manually by spec-trophotometry method (Shimatzu UV 1700) as described by Koroleff (1969). The detection limit for silicate,
ni-trate, phosphate and ammonium analyses were, respectively, 0.1 µM, 0.04 µM, 0.05 µM and 0.05 µM.
2.2.2 Chl a and phaeopigments
Chl a and phaeopigments were determined after filtration of 1–2 L of seawater on GF/F filters using a vacuum pump. The filters were placed in 90 % (v/v) acetone/water and homoge-nized in a cell for a minimum of 4 h followed by a centrifu-gation. Chl a level was then measured by fluorescence detec-tion using a TURNER Design 10-AN Fluorimeter. Phaeopig-ment concentration was determined in these samples af-ter the addition of 100 µM HCl (1N) (Strickland and Par-sons, 1972). Filters were measured within a few days after their collection on board. Detection limit of the measurement of Chl a and phaeopigment were, respectively, 0.005 µg L−1
and 0.075 µg L−1. Chl a analyses were calibrated versus a
pure Chl a from spinach (Sigma).
2.2.3 Particulate matter
Total particulate carbon (TPC), particulate organic carbon (POC) and particulate organic nitrogen (PON) were anal-ysed from a bulk of 2 L seawater filtered on 4 precombusted glass fiber filters (Whatman GF/F), as two filters were used for duplicate TPC determination and the other two for POC and PON duplicate analyses. The filters were kept frozen (−20◦C) before their analyses in the shore-based laboratory. POC and PON were analysed after fuming of the filter with concentrated HCl for 4 h in a dessicator and drying at 60◦C in an oven (Lorrain et al., 2003). POC and PON were mea-sured using Carlo Erba Analyzer 1500. TPC was analysed using the same protocol and method, but without fuming the filters. The particulate inorganic carbon (PIC) concentrations were estimated from the difference between TPC and POC.
Biogenic silica (BSi) was determined from 1 L seawa-ter samples filseawa-tered onto polycarbonate filseawa-ters (0.6 µm pore-size, diameter 47 mm) and the filters were dried at 60◦C and stored for further analysis. Before analyses the filters were dried at 60◦C for 24 h and then kept at room temper-ature. BSi was analysed after the digestion of the filter with 0.2 M NaOH for 45 min at 100◦C (Ragueneau et al., 2005).
2.3 Daily production rate
In the Southern Ocean, unaltered remnant winter water is observed at the depth of the temperature minimum during summer. Salinity in the remnant winter waters layer is within 0.02 to 0.2 % of that observed at the sea surface during win-ter in the Indian sector of the Southern Ocean (Pondaven et al., 2000), and the silicate and nitrate concentrations in rem-nant winter waters are within 0.7 to 7 % of that at the sea surface (Jacques, 1991; Pondaven et al., 2000). Hence, inte-grated depletions of nitrate and silicate were calculated be-tween the surface and the depth of the remnant winter waters
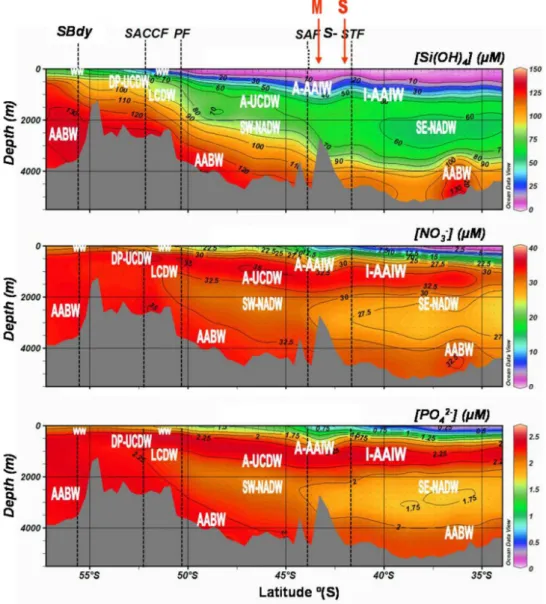
Fig. 2. Contour plots of silicate (Si(OH)−4; µM), nitrate (NO−3; µM), and phosphate (PO2−4 ; µM) concentrations versus depth (m) and latitude along the MD166 BONUS-GoodHope section. The colour mapping extrapolation is based on the sampling resolution along the section of
∼2600 km that was achieved with 79 stations separated by ∼ 15 to 56 km, with a total of 22 sampling depths per station. Figure prepared using Ocean Data View (Schlitzer, 2012).
according to Eq. (1) using the vertical profiles: 1Nuts = ZXminT Zs [(Nut@minT−( Nutzs+NutZs+1 2 )) × (Zs+1−ZS)] , (1)
where 1Nuts is the integrated nutrient depletion (referred to as 1Si for silicate and 1NO−3 for nitrate), Nut@minT is the
nutrient concentration at the depth of the winter waters, Nutzs
at the depth Zs and Nutzs+1at the depth Zs+1(Zs and Zs+1
are inferior or equal to the depth of the winter waters). Estimates of biogenic silica daily production rates (P Si) are derived from integrated silicate depletion (1Si) by as-suming the nutrient depletion by phytoplankton occurs over a period of 90 days in this area, that is, from early Novem-ber to early February (Jacques, 1991; Pondaven et al., 2000).
Then the daily production of biogenic silica (P Si) is theoret-ically calculated according to Eq. (2):
P Si = (1Si + DSi+ASi+RSi)/90 (2)
considering inputs of silicate into the surface layer by vertical diffusion (DSi)and lateral advection (ASi), and the
regener-ation of silicate through dissolution of biogenic silica within the surface mixed layer (RSi). However, none of those later
terms were estimated during the cruise, whereas they can rep-resent 18 to 26 % of 1Si (Pondaven et al., 2000). Our esti-mates are thus underestimations of the biogenic silica daily production rates.
Estimates of daily production rates of particulate organic nitrogen (PN ) are derived from vertically integrated nitrate
37 SBdy
[NH4+] (µM)
S-Latitude º(S)
Fig. 3. Contour plot of ammonium concentrations (NH+4; µM) in the upper 250 m along the MD166 BONUS-GoodHope section. Figure
prepared using Ocean Data View (Schlitzer, 2012).
38
SBdy
S-[Chl a] (µg l-1)
[pheaopigments] (µg l-1)
Latitude º(S)
Fig. 4. Contour plots of Chlorophyll a (Chl a; µg L−1)and phaeopigments (phaeopigments; µg L−1)concentrations in the upper 300 m along the MD166 BONUS-GoodHope section. Figure prepared using Ocean Data View (Schlitzer, 2012).
depletion during the 90 days of the productive season, and are calculated theoretically according to Eq. (3):
PN = ((1NO−3 +DNO3+ANO3+RNO3)/f-ratio)/90 (3)
considering the inputs of nitrate into the surface layer by ver-tical diffusion (DNO3), lateral advection (ANO3), and nitrite
oxidation rate (RNO3). Those later terms were not estimated
during the cruise and not considered in our estimates, but they can represent 40 % of 1NO−3 (Pondaven et al., 2000). The fraction of total nitrogen production sustained by am-monium or urea was deduced from shipboard determination
39
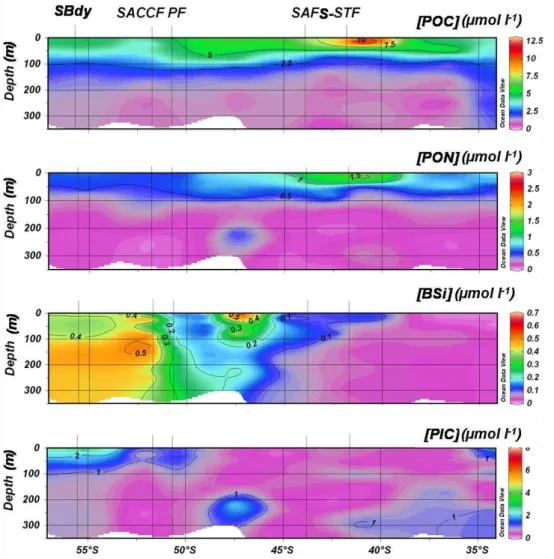
Fig. 5. Contour plots of particulate organic carbon (POC; µmol L−1), particulate organic nitrogen (PON; µmol L−1), biogenic silica (BSi; µmol L−1)and particulate inorganic carbon (PIC; µmol L−1)concentrations in the upper 350 m along the MD166 BONUS-GoodHope section. Figure prepared using Ocean Data View (Schlitzer, 2012).
of f-ratio (Joubert et al., 2011), where mean f-ratio character-izing each domain was used in our calculation.
3 Results
3.1 Hydrography
The section crossed the north of the subtropical domain that extended southward to the southern branch of the Subtropi-cal Front (S-STF) (Gordon et al., 1992) at ∼ 42◦2′S.
South-ward it crossed the Antarctic Circumpolar Current (ACC) bounded in the north by the S-STF and in the south by the Southern Boundary of the ACC (SBdy; Orsi et al., 1995) at
∼55◦54.3′S, and then the region of the Weddell Sea Gyre at the southern end of the section (Fig. 1). Within the ACC, the subantarctic domain is bounded in the south by the Sub-Antarctic Front (SAF; Orsi et al., 1995; Belkin and
Gor-don, 1996), which was located at 44◦2′S; the Polar Frontal Zone (PFZ) is bounded in the south by the Polar Front (PF) at 50◦22.4′S. The Southern ACC Front (SACCF) was located at ∼ 51◦52′S and the Southern Boundary of the ACC (SBdy)
at ∼ 55◦54′S. The mixed layer depth deepened southward
from around 50 m in the subtropical and subantarctic do-mains, to 60 m in the Polar Frontal Zone, to 88 m in the south-ern side of the ACC and down to 90 m in the Weddell Gyre.
The subtropical domain was characterized by a turbulent dynamical regime commonly observed in this region (Glady-shev et al., 2008). Warm and salty anticyclonic eddies com-monly interact with slope waters in the South Atlantic waters (Baker-Yeboah et al., 2010). The anticyclonic eddies are gen-erally referred to as Agulhas rings and are ejected from the western boundary current of the southwest Indian Ocean, the Agulhas Current, at its retroflection (Lutjeharms and Vanbal-legooyen, 1988). During the expedition, two large eddies of subtropical origin were intersected in the subantarctic zone
(Arhan et al., 2011). A cyclonic eddy (S) was crossed just south of the S-STF (at station 39) and was marked by pro-nounced low oxygen and CFCs anomalies revealing an ori-gin at the South Africa continental slope (Arhan et al., 2011). In addition a large and intense anticyclonic eddy (M) that was an Agulhas ring had crossed the Agulhas Ridge and was observed adjacent to the SAF (at station 46; Arhan et al., 2011). In this domain Antarctic Intermediate Waters orig-inated from the Indian Ocean (I-AAIW; Belkin and Gor-don, 1996) were depicted between 800 and 1200 m closer to Africa. Another variety of AAIW was observed to the south featuring the AAIW formed in the subantarctic domain of the southwest Atlantic (A-AAIW; Piola and Gordon, 1989). Deeper, centred at about 2500 m, a diluted variety of North Atlantic Deep Water which had flowed along the southwest African continental shelf (SE-NADW; Arhan et al., 2003) was identified north of S-STF. At the bottom, an old vari-ety of Antarctic Bottom Water (AABW) likely formed in the Weddell Sea (Gladyshev et al., 2008) was observed in the Cape Basin abyssal plain below 3500 m depth, characterized by low salinity and cold temperature.
In the ACC domain, south of the Agulhas Ridge, the sur-face water (SW) was marked by a southward decrease of temperature from 4◦C to 2◦C. Below lays the Atlantic va-riety of AAIW (A-AAIW), which subducts along the SAF. The A-AAIW waters were detected between depths of 300 and 600 m. At greater depths the Upper Circumpolar Deep Water originated from the southwest Atlantic (A-UCDW; Whitworth and Nowlin, 1987) was depicted north of the PF at about 1000–1500 m. North of the PF, the deeper waters (1500–3000 m) exhibited properties of diluted South West NADW (SW-NADW), which flows along the continental slope of South America, down to the Argentinean Basin be-fore being injected into the ACC in the southwestern Atlantic (Whitworth and Nowlin, 1987). At the bottom a variety of fresher and colder bottom water than AABW depicted in the Cape Abyssal plain was found below 3250 m on the northern flank of the Mid-Atlantic Ridge. South of the PF, deep waters exhibited properties of UCDW which had passed through the Drake Passage (DP-UCDW; Whitworth and Nowlin, 1987) between 250 and 700 m, and deeper those of Lower Cir-cumpolar Deep Water (LCDW) with lower salinity than SW-NADW. South of the ACC domain, the whole water column was impacted by waters of the Weddell Gyre; those waters are much colder and those near the bottom were a younger variety of AABW than those observed in the Cape Basin, as they are characterized by higher dissolved O2concentrations.
Winter waters (WW) were detected at depth of the temper-ature minimum in the ACC domain and the Weddell Gyre between 100 and 250 m, with temperature below 1◦C as de-scribed in Bown et al., (2011).
3.2 Nutrients
Nitrate distribution showed a meridional gradient in the sur-face waters with a southward increase from sub-micromolar levels in the subtropical domain up to 30 µM at the Polar Front and beyond (Fig. 2). Phosphate also followed a south-ward increase from sub-micromolar values in the subtropical domain to 1.75 µM at the Polar Front, and up to 2 µM south of 52◦S (Fig. 2). The concentrations of silicate kept to low values (sub-micromolar range) from the subtropical domain towards the southern side of the Polar Front, beyond which they increased up to 75 µM in the southern side of the ACC (Fig. 2). Surface nitrate and phosphate concentrations started to increase southward in the subantarctic domain, while sil-icate concentrations started to increase south of the Polar Front (Fig. 2).
Among other specific features of nutrients distribution, a bowl-shaped feature in the silicate, nitrate and phosphate pro-files that extended down to about 800 m was observed be-tween the S-STF and the SAF at 44◦S south of the Agulhas ridge, corresponding to the core of the anticyclonic eddy-M (Fig. 2). Furthermore, silicate isoclines were deepening northward from the PF (Fig. 2).
Relatively low nutrients concentrations were recorded at depth within the core of the SE-NADW observed from 33◦S to 44◦S between roughly 2000 and 4000 m depth (Fig. 2), with concentrations of 60 µM for silicate, 1.75 µM for phos-phate and 27 µM for nitrate. Silicate concentrations ranged from 10 to 20 µM in the A-AAIW, and nitrate and phosphate were in the range of 10 to 30 µM and 1 to 2 µM, respec-tively. In the WW, nutrients concentrations were similar to those recorded in the A-AAIW. Finally, silicate concentra-tions were relatively high (130 µM) in the core of the “old variety” of AABW depicted at roughly 36◦S below 4000 m depth (Fig. 2).
3.3 Ammonium
Ammonium concentrations were very low in the upper 250 m depth of the subtropical domain, within sub-micromolar range (Fig. 3). Subsurface maximum of about 1.25 µM was observed between 70 and 100 m centred on the Polar Front (Fig. 3). Ammonium concentrations (ranging from 0.25 to 0.75 µM) extended northward of this maximum in the Polar Frontal Zone, and southward in the southern branch of the ACC (Fig. 3).
3.4 Chlorophyll a and phaeopigments
The Chl-a concentrations never exceeded 0.5 µg L−1 in the surface waters along the section (Fig. 4). Sub-surface rela-tive maxima (< 0.4 µg L−1)were shallower southward along the subtropical region (Fig. 4), and Chl a accumulated in the top 50 m with a relative maximum of Chl a (∼ 0.5 µg L−1)
observed at 25 m along the confluence of the subtropical and
40 Figure 6 0 100 200 300 400 500 600 700 800 900 1000 0 20 40 60
station 37 station 39 station 40
0 100 200 300 400 500 600 700 0 5 10 15 20
station 45 station 46 station 47
D e p th ( m ) [Si(OH)4] (µM) [Si(OH)4] (µM) (a) (b)
Fig. 6. Vertical distributions of silicate concentrations (Si(OH)−4; µM), (a) in the core of the cyclonic eddy-S (station 39) and the surrounding stations (stations 37 and 40); and (b) in the core of the anticyclonic eddy-M (station 46) and the surrounding stations (stations 45 and 47).
the subantarctic zones (Fig. 4). In the Polar Frontal Zone, the Chl-a concentration was about 0.3 µM in the upper 70 m (Fig. 4), corresponding to the mixed layer depth. The south-ern side of the ACC (between PF and SBby) was marked by extremely low Chl a concentrations (0.1–0.2 µg L−1), whereas they were slightly higher (0.3 µg L−1)in the Wed-dell Gyre (Fig. 4). The distribution of the phaeopigments that are degradation products of the Chl a also dispatched a subsurface maximum of 0.25 µg L−1 centred at around
25 m depth at the confluence of the subtropical and sub-antarctic domains (Fig. 4). The phaeopigment pattern fol-lowed similar southward trend as the Chl a in these domains, with a subsurface maximum becoming a surface maximum (Fig. 4). In the Polar Frontal Zone, the levels of phaeopig-ments were extremely low, of about 0.1 µg L−1in the upper 70 m (Fig. 4). Phaeopigment concentrations were the low-est in the top 100 m in the southern side of the ACC, while relatively higher levels (0.06 µg L−1)were recorded at about 100 m depth in the Weddell Gyre (Fig. 4).
3.5 Particulate matter
3.5.1 Particulate organic carbon and nitrogen
The particulate organic carbon (POC) and the particulate or-ganic nitrogen (PON) ranged from below detection limit to 15 µM, and below detection limit to 2 µM, respectively, in the mixed layers along the section (Fig. 5). The highest concen-trations of POC and PON were recorded in the upper 50 m at the confluence zone of the subtropical and subantarctic do-mains. POC and PON concentrations were lower south of the PF, of about 2.5–5 µM and 0.5 µM respectively; whereas POC levels were relatively higher at the SBdy and in the PFZ as compared to values recorded at the SACCF (Fig. 5).
3.5.2 Biogenic silica and particulate inorganic carbon
Biogenic silica (BSi) concentrations increased southward in the top 100 m, from below detection limit in the subtropical province to 0.5 µM in the Polar Frontal Zone (Fig. 5). Then the distribution was marked by extremely low concentrations in the top 350 m at the PF and its northern side (< 0.2 µM), while BSi concentrations were slightly higher and fairly ho-mogenous (at around 0.3 µM) in the upper 350 m between PF and SACCF (Fig. 5). Accumulation of BSi (0.55 µM) oc-curred south of the SACCF between 150 and 350 m (Fig. 5). Particulate inorganic carbon (PIC) concentrations gener-ally kept to low values (< 4 µM) along the section. The largest accumulation of PIC (4 µM) was observed in the top 50 m on the southern side of the ACC and in the Weddell Gyre (Fig. 5). Lower relative accumulations were recorded in deeper waters (200–300 m) in the PFZ (2 µM), and in the up-per 50 m (2 µM) and below 300 m depth (1 µM) in the north-ern part of the subtropical domain off the South African shelf.
4 Discussion
4.1 Biogeochemical features of the subtropical domain and its confluence with the subantarctic zone
Silicate, nitrate and phosphate concentrations were ex-tremely low (< sub-micromolar levels) in the upper 200 m of the subtropical region, and kept to low levels in the sub-antarctic domain despite a slight increase of nitrate and phos-phate concentrations (Fig. 2). Such extremely low nutri-ents concentrations compared well with those previously ob-served at the same latitudes slightly earlier in the season (e.g. January) along 45◦E (Table 1; Mohan et al., 2004).
In the subtropical domain, the subsurface relative maxima of Chl a associated with the extremely low concentrations of nutrients (close to detection limit) were typical of olig-otrophic system conditions. It is likely that the ammonium which is kept at low value here was rapidly taken up. Olig-otrophic conditions were further supported by15N incuba-tion experiments which showed that the new producincuba-tion rate was low in this domain, unlike the regenerated production, as exemplified by a f-ratio of 0.24 compared to f-ratios of 0.41–0.49 south of this domain (Joubert et al., 2011). PIC and BSi concentrations were extremely low in this area, indicat-ing that the biomass resulted from non-mineralizindicat-ing phyto-plankton. Furthermore, the radionuclides derived export pro-duction (e.g. 234Th /238U) showed that the transfer rate of carbon to the mesopelagic zone was quite low in this domain (Planchon et al., 2012), consistent with a low new produc-tion (Joubert et al., 2011), and probably leading to the rel-ative accumulation of particulate organic N and C observed in the subtropical region (Fig. 5). These observations all sup-port that waters were strongly oligotrophic in the subtropical
gyre south of South Africa, and production was sustained by recycling processes.
At the confluence zone of the subtropical and subantarctic domains, Chl a and phaeopigments (degradation pigments) displayed their highest levels (Fig. 4), as well as particulate organic C and N (Fig. 5). The accumulation of particulate material can partly result from a low export rate, as evidenced by 234Th /238U measurements (Planchon et al., 2012), the biomass being remineralized or grazed within the mixed layer, as further supported by an ammonium peak in this area (Fig. 3). The transition between the two domains was marked by a slight increase in nitrate and phosphate concentrations southward (Fig. 2). The accumulation of particulate organic material (Figs. 4–5) and the low biominerals concentrations (Fig. 5) also occurred where the highest cell abundance was recorded along the section (Beker and Boye, 2010). Taxon-omy study using an inverted microscope showed that uniden-tified nanoflagellates (< 5 µm) and dinoflagellates (Gymno-dinium spp.) were the most abundant phytoplankton groups in the subtropical domain (Beker and Boye, 2010). Further-more, cyanobacteria are often too small to be recognized clearly in light-microscope studies, but the cyanobacteria Synechococcus sp. and Prochlorococcus sp. often dominate the picophytoplankton assemblage in oligotrophic regions (Partensky et al., 1999; Zhang et al., 2008). At the con-fluence zone of the subtropical and subantarctic domains, the concentrations of dissolved iron (DFe) ranged between 0.098 and 0.179 nM in surface waters (Chever et al., 2010). Cyanobacteria are capable of adapting to such low DFe by activating siderophore-mediated iron transport systems (Wil-helm, 1995). Culture experiments have also shown that the growth of Synechococcus sp. is significantly reduced below 10−14–10−13M of DFe (Timmermans et al., 2005),
suggest-ing that the growth of cyanobacteria was probably not limited at the confluence zone. Additionally, the coastal dinoflagel-lates Gymnodinium chlorophorum have cellular Fe/P quotas of 14.4 mol mol−1(giving a Fe/C quota of 0.13 mol mol−1; Ho et al., 2003; and using a ratio C/P of 106), and the coastal nanoflagellates have Fe/C quotas of 0.10 to 0.12 mol mol−1 (adapted from Ho et al., 2003). Those cellular Fe/C quotas are much higher than that of the oceanic cyanobacteria Syne-chococcus sp. (e.g. Fe/C = 5.8 nmol mol−1; Timmermans et al., 2005), suggesting higher requirement for DFe than the cyanobacteria. However, oceanic species of dino- and nano-flagellates can have lower DFe requirement than their coastal counterparts.
In the subantarctic zone, silicate distribution appeared as upward pointing tongues of high values (and low values for CFCs; Arhan et al., 2011) in the core of the cyclonic eddy (Figs. 2 and 6a). This also appears in nitrate and phosphate distribution (Fig. 2). However, as the tongue-shaped patterns generally cross the density contours, these eddy anomalies were probably more than just an isopycnal uplift of prop-erties, and reflected trapping and transport of distant water by the eddy (Arhan et al., 2011). The nutrients signatures of
the Agulhas anticyclone ring observed adjacent to the SAF were characterized by pronounced low values at the core station down to ∼ 600 m, relative to values at the surround-ing stations (Figs. 2 and 6b) indicative of winter convection. Both eddies were found to transport subtropical water and illustrated the capacity of eddies to transfer subtropical and along-slope water properties, such as nutrients, into the sub-antarctic zone (Arhan et al., 2011).
4.2 Biogeochemical features of the central and southern Antarctic Circumpolar Current domain and the Weddell Gyre
4.2.1 The diatom bloom along the Polar Front
In the surface waters, the nutrients distributions showed meridional gradients with a southward increase, whereas the location of the sharp increase differed for the silicate gradi-ent relative to the nitrate and phosphate (Fig. 2). The high-est gradient of silicate was indeed located southward of the PF in these late summer conditions, while for nitrate and phosphate they were highest at the PF (Fig. 2), consistently with previous observations (Pollard et al., 2002). In the Polar Frontal Zone, silicate concentrations were lower in the late austral summer (this study) compared to spring (e.g. Octo-ber 1992; L¨oscher, 1999), while nitrate and phosphate lev-els were within the same range (Table 1). This suggests that silicate is depleted over the productive season in the PFZ, unlike nitrate and phosphate. Similar southward move of the sharp gradient of silicate across the PF from spring towards late austral summer has already been observed in the Pa-cific sector of the Southern Ocean (Franck et al., 2000; Nel-son et al., 2002). Conversely, the southern side of the ACC was marked by relatively high silicate levels (and high ni-trate and phosphate) in the surface waters, with no seasonal variability (Table 1). The spatial and temporal variability of the silicate gradient in the vicinity of the PF is caused by the migration of the PF, and by the shifts in space and time of the production of the Antarctic diatoms (Bathmann et al., 1997; Pollard et al., 2002). Early spring blooms of large diatoms are indeed reported in the Polar Frontal Zone (Bath-mann, 1998). These blooms cause the depletion of silicate in the Polar Frontal Zone over the productive season, hence re-sulting in the southward migration of the sharp gradient of silicate observed here in late summer. Besides the depletion of silicate (Fig. 2), the extremely low concentrations of Chl a and phaeopigments reported here (Fig. 4) associated with the relative accumulation of ammonium (Fig. 3) further re-flected a post-diatom blooms situation centred on the PF dur-ing the late summer conditions. The flourishdur-ing diatoms are heavy silicified due to iron limitation (De Baar et al., 1997), whereas their biological uptake of nitrate can decrease (De La Rocha et al., 2000). This causes a strong depletion of sili-cate relative to nitrate. In the surface waters of the diatoms post-bloom area, the value of Si∗ (defined as [Si]-[NO3];
40
SBdy
S-Si* (µM)
Latitude º(S)
Fig. 7. Contour plot of Si∗(defined as [Si]-[NO−3] in µM; Sarmiento et al., 2004) in the upper 1500 m along the MD166 BONUS-GoodHope section. Figure prepared using Ocean Data View (Schlitzer, 2012).
Table 1. Surface concentrations of silicate and nitrate (> 200 m) recorded in the several oceanic provinces of the Southern Ocean delimited
by the frontal systems at different seasons
Area Longitude Season [silicate] (µM) [nitrate] (µM) [phosphate] (µM) Reference
North STF 45◦E Jan./Mar. 1–6 0–7 0–1.6 Mohan et al. (2004) 0◦E Feb./Mar. 0–5 0–5 0–1.5 This study
STF-SAF 45◦E Jan./Mar. 2–10 1–23 0–1.5 Mohan et al. (2004) 0◦E Feb./Mar. 0–5 5–20 0.3–1.6 This study
SAF-PF 6◦E Oct. 18–73 24–32 1.2–1.9 L¨oscher et al. (1997) 6◦E Nov. 1–60 23–35 1.1–2.0 L¨oscher et al. (1997) 0◦E Feb./Mar. 0–5 15–30 1.2–2.3 This study
PF-SACCF 6◦E Oct. 28–82 27–36 1.8–2.3 L¨oscher et al. (1997) 6◦E Nov. 27–87 27–35 1.9–2.5 L¨oscher et al. (1997) 0◦E Feb./Mar. 0–41 25–35 1.6–2.5 This study
SACCF-SBdy 6◦E Oct. 28–82 27–36 1.8–2.3 L¨oscher et al. (1997) 6◦E Nov. 27–87 27–35 1.9–2.5 L¨oscher et al. (1997) 0◦E Feb./Mar. 41–72 26–35 1.7–2.4 This study
Sarmiento et al., 2004) was indeed negative (Fig. 7), further suggesting a decoupling between the silicon and nitrogen ex-port in the vicinity of the PF. These blooms generate intense flux of BSi towards the deep ocean. The BSi is remineralized slowly in the deep ocean (Tr´eguer and Jacques, 1992), result-ing in relatively high opal levels in the sediment of the Po-lar Frontal Zone (DeMaster, 1981). Within the PF, the lower BSi concentrations in the upper water column compared to that observed in the central PFZ (Fig. 5) can be due to an in-crease in export of particulate material, as exemplified by the relatively high234Th derived POC export recorded at ∼ 51◦S (Planchon et al., 2012). POC and PON concentrations were also low at the PF (Fig. 5), consistent with an efficient ex-port of particulate material. The exex-port of POC has been estimated between 2.6 and 4.7 mmol C m−2d−1in the PFZ
(Planchon et al., 2012), and the export of BSi to be approxi-mately 3 mmol Si m−2d−1(Fripiat et al., 2011). Using these
estimates, the C/Si ratio in the exported material ranges be-tween 0.9 and 1.6 in the PFZ, a ratio lower than those ex-pected in diatoms (e.g. ∼ 7, Brzezinski, 1985). Production of heavily silicified diatoms due to iron limitation (De La Rocha et al., 2000) may have caused the increase of BSi relative to organic carbon in the exported material within the PFZ and PF. Large Antarctic diatoms such as Chaetoceros bre-vis and Actinocyclus sp. have a higher requirement for DFe than smaller Antarctic diatoms like Chaetoceros dichaeta, with half-saturation constants for DFe of 1.12–1.14 nM and 0.59 pM, respectively, for large and smaller species (Tim-mermans et al., 2001, 2004). Hence, the low DFe concen-trations observed in surface waters around the PF (0.121– 0.249 nM; Chever et al., 2010) would be strongly limiting the growth of the large Antarctic diatoms, and less severally the growth of the smaller species. A recent study suggests, however, that iron limitation in the Southern Ocean can be
Fig. 8. (a) Seasonal net assimilation ratio of silicate and nitrate
(1Si/1NO−3)in the surface waters in the Antarctic Circumpolar Current (ACC) along the MD-166 BONUS-GOODHOPE cruise (see text for calculation method). Front positions are indicated: (b) silica daily net production rate (mmol m−2d−1)and (c) nitrogen daily net production rate (mmol m−2d−1)(see text for calculation methods). All the uncertainties are based on observations that ni-trate and silicate concentrations in the remnant winter waters are within ±7 % of that at the sea surface.
less severe than previously estimated (Strzepek et al., 2011). Furthermore, DFe concentrations recorded during the cruise (Chever et al., 2010) may not reflect the DFe concentrations at the beginning of the productive season, which were likely higher.
The Antarctic Intermediate Water (AAIW) and Subantarc-tic Mode Water (SAMW) transport nutrients within the ther-mocline, which can drive a large part of the primary and export production at low latitudes (Sarmiento et al., 2004). However, the production of SAMW can be insignificant in the Atlantic sector of the Southern Ocean (Whitworth and Nowlin, 1987; McCartney, 1975). The water masses encoun-tered along the section did not reveal the occurrence of SAMW. Contrastingly, the Atlantic variety of AAIW formed in the subantarctic region of the southwest Atlantic (A-AAIW; Piola and Gordon, 1989) was depicted in the ACC south of the Agulhas Ridge, as those waters subduct north-ward along the SAF (Arhan et al., 2011). These waters were also observed in the southern side of the subtropical domain (Arhan et al., 2011). These waters were characterized by neg-ative Si∗ values (< −10 µM; Fig. 7), reflecting the nutrient
depletion of silicate (and to a lesser extent of nitrate) in the PFZ (Fig. 2) generated by the early spring diatom bloom. Ac-cording to the model (Sarmiento et al., 2004), the negative Si* signature of the A-AAIW can lead to a decrease in ex-port production outside the Southern Ocean as these waters likely fuel the low latitudes productivity with nutrients. Fur-thermore, Si∗is deemed to be an indicator of nutrient status related to the requirements of diatoms, provided Si/N ratio of non-starving diatoms (e.g. by light, macro- and micro-nutrients) is close to 1 (Brzezinski, 1985), which requires Si∗≥0 (Sarmiento et al., 2004). Thus, the negative value of Si∗ recorded in the A-AAIW can provide indirect evidence of limiting conditions for diatom growth in the upper layers of the Polar Front region during summer conditions.
Estimations of the seasonal net silicate/nitrate removal ra-tios (1Si/1NO−3) (e.g. biological uptake minus regenera-tion) in the mixed layer of the ACC domain varied from 0.7/1 to 4.8/1 µM µM−1(Fig. 8a). Those estimates were similar to
those previously recorded in the Indian sector of the South-ern Ocean (Le Corre and Minas, 1983) and in the Weddell Sea (Hoppema et al., 2007). Furthermore, the 1Si/1NO−3 ratios estimated in the diatom post-bloom region were above 1 (Fig. 8a), suggesting a lower seasonal net nitrate uptake relative to that of silicate. This is in line with the decrease of nitrate uptake rate and the unaffected silicate uptake rate of diatoms observed in culture experiments under Fe-depleted conditions (De La Rocha et al., 2000). Nevertheless, the seasonal net nitrogen and dissolved silicon removal may be higher than that estimated for nitrate (1NO−3) and sil-icate (1Si) due to the nitrite oxidation and the remineral-isation of BSi, respectively, as neither were considered in our estimations. Another silicate assimilation rate based on a mass balance in the mixed layer was estimated on aver-age at 3.0 ± 0.8 mol Si m−2yr−1south of the PF (Fripiat et al., 2011), which can also be underestimated due to the sup-ply of dissolved silicon to the mixed layer during the stratifi-cation period (Fripiat et al., 2011). Therefore, the seasonal net assimilation ratio 1Si/1NO3 could be actually higher
than our estimates, but still supporting lower seasonal net ni-trate consumption as compared to that of silicate.
The silica daily production rate (P Si) ranged from 1.5 to 55.5 mmol m−2d−1in the ACC domain (Fig. 8b). These val-ues are similar to those reported at these latitudes (Table 2; Pondaven et al., 2000). P Si was slightly higher in the vicinity of the PF (Fig. 8b), in line with the diatom post-bloom con-dition. Iron-limited Antarctic diatom blooms of Fragilariop-sis kerguelenFragilariop-sis reported at these latitudes in spring (Bath-mann et al., 1997; de Baar et al., 1997) accumulate a large amount of silicate to grow, possibly accounting for the rela-tively higher P Si in the vicinity of the PF. Nevertheless, the silica daily production rates could have been underestimated by not taking into account additional Si inputs in the sur-face waters. The nitrogen daily production rate (PN ) spreads from 2.3 to 48.4 mmol m−2d−1in surface waters of the ACC, with no significant meridional trend (Fig. 8c). This range is
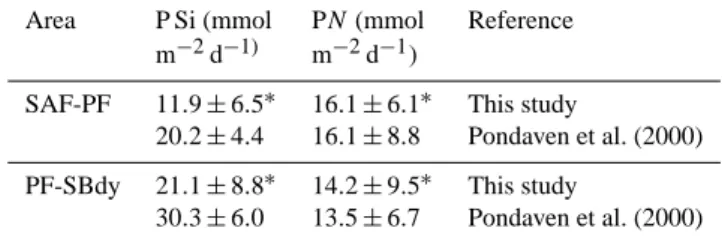
Table 2. Comparison of the estimated daily net production rate of
silica (P Si, mmol m−2d−1) and nitrate (PN , mmol m−2d−1) in the Atlantic sector of the Southern Ocean during summer 2008 (this study) and in 1994 (Pondaven et al., 2000).
Area P Si (mmol PN (mmol Reference m−2d−1) m−2d−1)
SAF-PF 11.9 ± 6.5∗ 16.1 ± 6.1∗ This study
20.2 ± 4.4 16.1 ± 8.8 Pondaven et al. (2000) PF-SBdy 21.1 ± 8.8∗ 14.2 ± 9.5∗ This study
30.3 ± 6.0 13.5 ± 6.7 Pondaven et al. (2000)
∗Uncertainties are calculated from the confidence interval of the mean p<0.05.
similar to those reported at these latitudes (Table 2; Pondaven et al., 2000). As already mentioned, the nitrogen daily pro-duction rates may have been underestimated since the nitrite oxidation rate was ignored here, whereas recent studies about nitrification suggest that the nitrification can be significant in the photic zone (Yool et al., 2007).
4.2.2 The Weddell Gyre
Relatively high levels of BSi persisted in the upper water column (Fig. 5), possibly suggesting a low dissolution rate of BSi leading to an accumulation of BSi. Low tempera-tures are deemed to limit the BSi dissolution rate (Natori et al., 2006). Another interesting feature of the northern branch of the Weddell Gyre is the relatively small depletion of sil-icate (at stations 103–104), associated with a slight increase of Chl a and phaeopigments concentrations (Fig. 4), sug-gesting a late stage of a relatively minor diatom bloom. The diatom-dominated assemblage observed here contained de-graded frustules with small or absent chloroplasts (Beker and Boye, 2010), also suggesting a late stage of a diatom bloom. Such production of diatoms has been already reported south of the SBdy (Arrigo et al., 1999).
In the Weddell Gyre, surface DFe was fairly low although more variable than in the PFZ (e.g. 0.064–0.313 nM; Chever et al., 2010). Such low DFe would strongly limit the growth of the large Antarctic diatoms such as Chaetoceros brevis and Actinocyclus sp. (e.g. half-saturation constant for DFe of 1.12–1.14 nM; Timmermans et al., 2001, 2004). However, it is possible that sea-ice melting stimulated the diatom pro-duction, as recently suggested in the Weddell Sea (Smith et al., 2007), providing sea-ice can be a source of iron to the surrounding waters (Boye et al., 2001; Lannuzel et al., 2008; Klunder et al., 2011; Boyd et al., 2012) that can support lo-cal and episodic diatom production. Despite being late in the season and at northerly latitudes of the Weddell Gyre (55– 57◦S), a large number of drifting icebergs were indeed ob-served there, which can support this hypothesis.
In the Weddell Gyre, P Si and PN were similar compared to the ACC (Fig. 8b–c), suggesting that consumption of Si
and N were comparable in the ACC and in the Weddell Gyre on the seasonal timescale.
5 Conclusions
Comprehensive datasets of several biogeochemical parame-ters were presented in the under-sampled HNLC region of the Southern Ocean during late summer. Different biogeochemi-cal provinces were identified in the southeastern Atlantic and the Southern Ocean based on their previously known bio-geochemical features. The subtropical region was character-ized by oligotrophic conditions with extremely low nutrients concentrations. The confluence zone between the subtropical and the subantarctic domains was characterized by a relative sub-surface maximum of Chl a and by the accumulation of particulate matter due to low export production and signif-icant recycled production. In the ACC, the occurrence of a vast diatom post-bloom was depicted in the vicinity of the Polar Front during the late summer. The preferential removal of silicate by diatoms relative to that of nitrate under iron-limited conditions can lead to the surface depletion of silicate in the post-bloom area and the southward migration of the silicate gradient beyond the Polar Front. Coupled biogenic silica production and accumulation throughout the water col-umn suggest that low dissolution has played a significant role in the silicon cycle in the ACC and the Weddell Gyre.
Acknowledgements. We thank the captain and the crew of the
French research vessel Marion Dufresne II for their wonderful work at sea during the IPY MD166 BONUS-GOODHOPE cruise. The project coordinators and chief scientists of the cruise, S. Speich (LPO, Brest, France) and M. Boye (LEMAR, Brest, France) are gratefully acknowledged. Special thanks also to their collaborators during the cruise, M. Arhan (LPO, Brest, FR) and F. Dehairs (VUB, Brussels, Belgium). We are grateful to the colleagues of the nutrient CTD sampling team, and to Sebastien Aubin (LEMAR) for assisting biogenic silica analyses. This investigation was supported by the French LEFE National Program of INSU at CNRS, the National Agency for Research Funding (ANR−07−BLAN−0146) and the French Polar Institut Paul Emile Victor (IPEV). F. Dehairs is also warmly acknowledged for improving the manuscript. This work was part of the Master degree research of F. A. C. Le Moigne. It is a contribution to the International Polar Year and the International ICED programs.
Edited by: S. Speich
References
Arhan, M., Mercier, H., and Park, Y. H.: On the deep water cir-culation of the eastern south Atlantic ocean, Deep-Sea Re-search Part I-Oceanographic ReRe-search Papers, 50, 889–916, doi:10.1016/s0967-0637(03)00072-4, 2003.
Arhan, M., Speich, S., Messager, C., Dencausse, G., Fine, R. A., and Boye, M.: Anticyclonic and cyclonic eddies of subtropical origin in the subantarctic zone south of Africa, J. Geophys. Res., 116, C11004, doi:10.1029/2011JC007140, 2011.
Arrigo, K. R., Robinson, D. H., Worthen, D. L., Dunbar, R. B., Di-Tullio, G. R., VanWoert, M., and Lizotte, M. P.: Phytoplankton community structure and the drawdown of nutrients and CO2in
the Southern Ocean, Science, 283, 365–367, 1999.
Baker-Yeboah, S., Flierl, G. R., Sutyrin, G. G., and Zhang, Y.: Transformation of an Agulhas eddy near the continental slope, Ocean Sci., 6, 143–159, doi:10.5194/os-6-143-2010, 2010. Banse, K.: Rates of phytoplankton cell-division in the field and
in iron enrichment experiments, Limnol. Oceanogr., 36, 1886– 1898, 1991.
Bathmann, U. V.: Ecology and biogeochemistry in the atlantic sec-tor of the Southern Ocean during austral spring: The first JGOFS expedition aboard R/V Polarstern, J. Marine Syst., 17, 77–85, 1998.
Bathmann, U. V., Scharek, R., Klaas, C., Dubischar, C. D., and Smetacek, V.: Spring development of phytoplankton biomass and composition in major water masses of the Atlantic sector of the Southern Ocean, Deep-Sea Res. Pt. II, 44, 51–67, 1997. Beker, B. and Boye, M.: Phytoplankton assemblages in the
South-ern Ocean during the IntSouth-ernational Polar Year. Ocean Sciences Meeting, 22–26 February 2010, Portland, USA, 2010.
Belkin, I. M. and Gordon, A. L.: Southern Ocean fronts from the Greenwich meridian to Tasmania, J. Geophys. Res.-Oceans, 101, 3675–3696, 1996.
Bown, J., Boye, M., Baker, A., Duvieilbourg, E., Lacan, F., Le Moigne, F., Planchon, F., Speich, S., and Nelson, D. M.: The biogeochemical cycle of dissolved cobalt in the Atlantic and the Southern Ocean south off the coast of south Africa, Mar. Chem., 126, 193–206, 2011.
Boyd, P. W., Arrigo, K. R., Strzepek, R., and van Dijken, G. L.: Mapping phytoplankton iron utilization: Insights into south-ern ocean supply mechanisms, J. Geophys. Res., 117, C06009, doi:10.1029/2011JC007726, 2012.
Boye, M., Van den Berg, C. M. G., De Jong, J. T. M., Leach, H., Croot, P., and de Baar, H. J.: Organic complexation of iron in the Southern Ocean, Deep-Sea Res. Pt. I, 48, 1477–1497, 2001. Branellec, P., Arhan, M., Speich, S.: Projet GoodHope, campagne
BONUS-GoodHope, Rapport de donn´ees CTD-O2, Rapport
in-terne IFREMER, OPS/LPO/10-02, 61 pp., 2010.
Brzezinski, M. A.: The Si/C/N ratio of marine diatoms - interspe-cific variability and the effect of some environmental variables, J. Phycol., 21, 347–357, 1985.
Buma, A. G. J., Debaar, H. J. W., Nolting, R. F., and Vanbennekom, A. J.: Metal enrichment experiments in the WeddellScotia seas -effects of iron and manganese on various plankton communities, Limnol. Oceanogr., 36, 1865–1878, 1991.
Caldeira, K. and Duffy, P. B.: The role of the Southern Ocean in up-take and storage of anthropogenic carbon dioxide, Science, 287, 620–622, 2000.
Chever, F., Bucciarelli, E., Sarthou, G., Speich, S., Arhan, M., Pen-ven, P., and Tagliabue, A.: Physical speciation of iron in the at-lantic sector of the Southern Ocean along a transect from the subtropical domain to the Weddell Sea gyre, J. Geophys. Res., 115, C10059, doi:10.1029/2009JC005880, 2010.
de Baar, H. J. W., VanLeeuwe, M. A., Scharek, R., Goeyens, L., Bakker, K. M. J., and Fritsche, P.: Nutrient anomalies in
Fragilariopsis kerguelensis blooms, iron deficiency and the
ni-trate/phosphate ratio (a.c. Redfield) of the Antarctic Ocean, Deep-Sea Res. Pt. II, 44, 229–260, 1997.
De La Rocha, C. L., Hutchins, D. A., Brzezinski, M. A., and Zhang, Y. H.: Effects of iron and zinc deficiency on elemental composi-tion and silica produccomposi-tion by diatoms, Mar. Ecol.-Prog. Ser., 195, 71–79, 2000.
DeMaster, D. J.: The supply and accumulation of silica in the ma-rine environment, Geochim. Cosmochim. Ac., 45, 1715–1732, 1981.
DeMaster, D. J., Brewster, D. C., McKee, B. A., and Nittrouer, C. A.: Rates of particle scavenging, sediment reworking, and lon-gitudinal ripple formation at the Hebble site based on measure-ments of234Th and210Pb, Mar. Geol., 99, 423–444, 1991. Franck, V. M., Brzezinski, M. A., Coale, K. H., and Nelson, D.
M.: Iron and silicate concentrations regulate Si uptake north and south of the Polar Frontal Zone in the Pacific sector of the South-ern Ocean, Deep-Sea Res. Pt. II, 47, 3315–3338, 2000.
Fripiat, F., Cavagna, A.-J., Dehairs, F., Speich, S., Andr´e, L., and Cardinal, D.: Silicon pool dynamics and biogenic silica export in the Southern Ocean inferred from Si-isotopes, Ocean Sci., 7, 533–547, doi:10.5194/os-7-533-2011, 2011.
Frost, B. W.: Phytoplankton bloom on iron ratios, Nature, 383, 475– 476, 1996.
Gladyshev, S., Arhan, M., Sokov, A., and Speich, S.: A hydro-graphic section from south Africa to the southern limit of the Antarctic Circumpolar Current at the Greenwich meridian, Deep-Sea Res. Pt. I, 55, 1284–1303, doi:10.1016/j.dsr.2008.05.009, 2008.
Gordon, A. L., Weiss, R. F., Smethie, W. M., and Warner, M. J.: Thermocline and intermediate water communication between the south-Atlantic and Indian oceans, J. Geophys. Res.-Oceans, 97, 7223–7240, 1992.
Ho, T. Y., Quigg, A., Finkel, Z. V., Milligan, A. J., Wyman, K., Falkowski, P. G., and Morel, F. M. M.: The elemental composi-tion of some marine phytoplankton, J. Phycol., 39, 1145–1159, 2003.
Hoppema, M., Middag, R., de Baar, H. J. W., Fahrbach, E., van Weerlee, E. M., and Thomas, H.: Whole season net commu-nity production in the Weddell Sea, Polar Biol., 31, 101–111, doi:10.1007/s00300-007-0336-5, 2007.
Joubert, W. R., Thomalla, S. J., Waldron, H. N., Lucas, M. I., Boye, M., Le Moigne, F. A. C., Planchon, F., and Speich, S.: Nitro-gen uptake by phytoplankton in the Atlantic sector of the South-ern Ocean during late austral summer, Biogeosciences, 8, 2947– 2959, doi:10.5194/bg-8-2947-2011, 2011.
Klunder, M. B., Laan, P., Middag, R., de Baar, H. J. W., and van Ooijen, J. C.: Dissolved Fe in the Southern Ocean (Atlantic sector), Deep-Sea Res. Pt. II, 58, 2678–2694, doi:10.1016/j.dsr2.2010.10.042, 2011.
Koroleff, F.: Direct determination of ammonia in natural water as indophenol blue, Information on Techniques and Methods for the
Seawater Analysis, 1969.
Lannuzel, D., Schoemann, V., de Jong, J., Chou, L., Delille, B., Bec-quevort, S., and Tison, J.-L.: Iron study during a time series in the western Weddell pack ice, Mar. Chem., 108, 85–95, 2008. Le Corre, P. and Minas, H. J.: Distribution et ´evolution des ´el´ements
nutritifs dans le secteur indien de l’Oc´ean Antarctique en fin de p´eriode estivale, Oceanol. Acta, 6, 365–381, 1983.
Longhurst, A. R.: Large marine ecosystems – patterns, processes and yields, Mar. Policy, 15, 377–378, 1991.
Lorrain, A., Savoye, N., Chauvaud, L., Paulet, Y. M., and Naulet, N.: Decarbonation and preservation method for the analysis of organic C and N contents and stable isotope ratios of low-carbonated suspended particulate material, Anal. Chim. Acta, 491, 125–133, doi:10.1016/s0003-2670(03)00815-8, 2003. L¨oscher, B. M.: Relationships among Ni, Cu, Zn, and major
nutri-ents in the Southern Ocean, Mar. Chem., 67, 67–102, 1999. Lutjeharms, J. R. E. and Vanballegooyen, R. C.: The retroflection of
the Agulhas current, J. Phys. Oceanogr., 18, 1570–1583, 1988. Lutjeharms, J. R. E., Boebel, O., and Rossby, H. T.: Agulhas
cy-clones, Deep-Sea Res., 50, 13–34, 2003.
Marinov, I., Gnanadesikan, A., Toggweiler, J. R., and Sarmiento, J. L.: The Southern Ocean biogeochemical divides, Nature, 441, 964–967, doi:10.1038/nature04883, 2006.
Martin, J. H.: Glacial-interglacial CO2change: The iron hypothesis,
Paleoceanography, 5, 1–13, 1990.
McCartney, M. S.: Subantarctic Mode Water, EOS T. Am. Geophys. UN, 56, 1011–1011, 1975.
Mohan, R., Mergulhao, L. P., Guptha, M. V. S., Rajakurnar, A., Thamban, M., AnilKurnar, N., Sudhakar, M., and Ravin-dra, R.: Ecology of coccolithophores in the indian sector of the Southern Ocean, Mar. Micropaleontol., 67, 30–45, doi:10.1016/j.marmicro.2007.08.005, 2004.
Murphy, J. and Riley, J. P.: A modified single solution method for the determination of phosphorus in natural waters, Anal. Chim. Acta, 27, 31–36, 1962.
Natori, Y., Haneda, A., Suzuki, Y.: Vertical and seasonal differences in biogenic silica dissolution in natural seawater in Suruga Bay, Japan: Effects of temperature and organic matter, Mar. Chem., 102, 230–241, 2006.
Nelson, D. M. and Smith, W. O.: Sverdrup revisited – critical depths, maximum chlorophyll levels, and the control of southern-ocean productivity by the irradiance-mixing regime, Limnol. Oceanogr., 36, 1650–1661, 1991.
Nelson, D. M., Anderson, R. F., Barber, R. T., Brzezinski, M. A., Buesseler, K. O., Chase, Z., Collier, R. W., Dickson, M. L., Fran-cois, R., Hiscock, M. R., Honjo, S., Marra, J., Martin, W. R., Sambrotto, R. N., Sayles, F. L., and Sigmon, D. E.: Vertical bud-gets for organic carbon and biogenic silica in the pacific sector of the Southern Ocean, 1996–1998, Deep-Sea Res. Pt. II, 49, 1645– 1674, 2002.
Orsi, A. H., Whitworth, T., and Nowlin, W. D.: On the meridional extent and fronts of the Antarctic Circumpolar Current, Deep-Sea Res. Pt. I, 42, 641–673, 1995.
Partensky, F., Hess, W. R., and Vaulot, D.: Prochlorococcus, a ma-rine photosynthetic prokaryote of global significance, Microbiol. Molecular Biol. Rev., 63, 106–127, 1999.
Piola, A. R. and Gordon, A. L.: Intermediate waters in the southwest Atlantic, Deep-Sea Res. A, 36, 1–16, 1989.
Planchon, F., Cavagna, A.-J., Cardinal, D., Andr´e, L., and De-hairs, F.: Late summer particulate organic carbon export and twilight zone remineralisation in the Atlantic sector of the Southern Ocean, Biogeosciences Discuss., 9, 3423–3477, doi:10.5194/bgd-9-3423-2012, 2012.
Pollard, R. T., Lucas, M. I., and Read, J. F.: Physical controls on biogeochemical zonation in the Southern Ocean, Deep-Sea Res. Pt. II, 49, 3289–3305, 2002.
Pondaven, P., Ragueneau, O., Tr´eguer, P., Hauvespre, A., Dezileau, L., and Reyss, J. L.: Resolving the ’opal paradox’ in the Southern Ocean, Nature, 405, 168–172, 2000.
Qu´eguiner, B., Tr´eguer, P., Peeken, I., and Scharek, R.: Biogeo-chemical dynamics and the silicon cycle in the atlantic sector of the Southern Ocean during austral spring 1992, Deep-Sea Res. Pt. II, 44, 69–89, 1997.
Ragueneau, O., Dittert, N., Pondaven, P., Tr´eguer, P., and Corrin, L.: Si/C decoupling in the world ocean: Is the Southern Ocean different?, Deep-Sea Res. Pt. II, 49, 3127–3154, 2002.
Ragueneau, O., Savoye, N., Del Amo, Y., Cotten, J., Tardiveau, B., and Leynaert, A.: A new method for the measurement of biogenic silica in suspended matter of coastal waters: Using Si:Al ratios to correct for the mineral interference, Cont. Shelf Res., 25, 697– 710, doi:10.1016/j.csr.2004.09.017, 2005.
Sarmiento, J. L. and Toggweiler, J. R.: A new model for the role of the oceans in determining atmospheric pCO2, Nature, 308, 621–
624, 1984.
Sarmiento, J. L., Gruber, N., Brzezinski, M. A., and Dunne, J. P.: High-latitude controls of thermocline nutrients and low latitude biological productivity, Nature, 427, 56–60, doi:10.1038/nature02127, 2004.
Schlitzer, R.: Ocean Data View, http://odv.awi.de, 2012.
Smith, K. L., Robison, B. H., Helly, J. J., Kaufmann, R. S., Ruhl, H. A., Shaw, T. J., Twining, B. S., and Vernet, M.: Free-drifting icebergs: Hot spots of chemical and biologi-cal enrichment in the Weddell Sea, Science, 317, 478–482, doi:10.1126/science.1142834, 2007.
Strickland, J. D. H. and Parsons, T. R.: A practical handbook of sea-water analysis, Fisheries Research Board of Canada, 2nd Edn., 1972.
Strzepek, R. F., Maldonado, M. T., Hunter, K. A., Frew, R. D., and Boyd, P. W.: Adaptive stratefies by Southern Ocean phytoplank-ton to lessen iron limitation: Uptake of organically complexed iron and reduced cellular iron requirments, Limnol. Oceanogr., 56, 1983–2002, 2011.
Timmermans, K. R., Gerringa, L. J. A., de Baar, H. J. W. van der Wagt, B., Veldhuis, M. J. W., de Jong J. T. M., Croot, P. T., and Boye, M.: Growth rates of large and small Southern Ocean di-atoms in relation to availability of iron in natural seawater, Lim-nol. Oceanogr., 46, 260–266, 2001.
Timmermans, K. R., van der Wagt, B., and de Baar, H. J. W: Growth rates, half-saturation constants, and silicate, nitrate, and phos-phate depletion in relation to iron availability of four large, open-ocean diatoms from the Southern Ocean, Limnol. Oceanogr., 49, 2141–2151, 2004.
Timmermans, K. R., van der Wagt, B., Veldhuis, M. J. W., Maat-man, A., de Baar, H. J. W.: Physiological responses of three species of marine pico-phytoplankton to ammonium, phosphate, iron and light limitation, J. Sea Res., 53, 109–120, 2005.
Tr´eguer, P. and Le Corre, P.: Ratios of nitrate, phosphate, and sili-cate during uptake and regeneration phases of the Moroccan up-welling regime, Deep-Sea Res. A, 26, 163–184, 1979.
Tr´eguer, P. and Jacques, G.: Dynamics of nutrients and phytoplank-ton, and fluxes of carbon, nitrogen and silicon in the Antarctic Ocean, Polar Biol., 12, 149–162, 1992.
Wilhelm, S.: Ecology of iron-limited cyanobacteria: a review of physiological responses and implications for aquatic systems, Aquat. Microb. Ecol., 9, 295–303, 1995.
Whitworth, T. and Nowlin, W. D.: Water masses and currents of the Southern Ocean at the Greenwich meridian, J. Geophys. Res.-Oceans, 92, 6462–6476, 1987.
Yool, A., Martin, A. P., Fernandez, C., and Clark, D. R.: The signif-icance of nitrification for oceanic new production, Nature, 447, 999–1002, doi:10.1038/nature05885, 2007.
Zhang, Y., Jiao, N. Z., and Hong, N.: Comparative study of picoplankton biomass and community structure in different provinces from subarctic to subtropical oceans, Deep-Sea Res. Pt. II, 55, 1605–1614, 2008.


![Fig. 7. Contour plot of Si ∗ (defined as [Si]-[NO − 3 ] in µM; Sarmiento et al., 2004) in the upper 1500 m along the MD166 BONUS-GoodHope section](https://thumb-eu.123doks.com/thumbv2/123doknet/13779953.439568/11.892.170.718.96.313/fig-contour-defined-sarmiento-upper-bonus-goodhope-section.webp)