3
9080
03149
0581
HB31
.M415
Digitized
by
tine
Internet Arciiive
in
2011
with
funding
from
Boston
Library
Consortium
IVIember
Libraries
HB31
*'^'^
.^
Massachusetts
Institute
of
Technology
Department
of
Economics
Working
Paper
Series
The
Age
of
Reason:
Financial
Decisions
Over
the
Lifecycle
Sumit Agarwal
John DriscoU
Xavier
Gabaix
David
Laibson
Working
Paper
07-March
15
2007
Room
E52-251
50
Memorial
Drive
Cambridge,
MA
02142
This
paper can be
downloaded
withoutcharge from
the SocialScience
Research
Networl<Paper
Collection atThe
Age
of
Reason:
Financial Decisions
Over
the
Lifecycle
Sumit
Agarwal,John
C.Driscoll, Xavier Gabaix,and David
Laibson*CurrentVersion:
March
19,2007
Abstract
Thesophistication of financial decisions varieswithage:middle-agedadultsborrowat lowerinterestratesand payfewerfeescomparedtoboth youngerandolder adults.
We
documentthispatterninten financialmarkets. Themeasuredeffectscan notbe explained by observedriskcharacteristics.Thesophistication of financial choicespeaksatabout age 53inourcross-sectional data. Ourresultsare consistentwiththehypothesisthat financial sophisticationrisesand thenfallswithage,althoughthe patterns thatweobserverepresent
amixofageeff'ectsandcohorteffects. (JEL:Dl, D4, D8, G2,J14).
Keywords: Household finance,behavioralfinance, behavioral industrial organiza-tion,aging, shrouding, autoloans,credit cards,fees,
home
equity,mortgages.*Agarwal: Federal ReserveBankofChicago,sagarwal@frbchi.org. Driscoll: FederalReserve Board, john.c.driscoll@frb.gov. Gabaix: MIT,Princetonand
NBER,
xgabaix@princeton.edu. Laibson: Har-vardUniversityandNBER,
dlaibson@harvard.edu. Gabaix andLaibson acknowledge support fromthe NationalScienceFoundation(Human
andSocialDynamicsprogram). Laibson acknowledgesfinancial supportfromtheNationalInstitute on Aging (ROl-AG-1665). Theviews expressedin thispaperare thoseoftheauthorsand donot represent the policies or positionsoftheBoardofGovernors ofthe Federal ReserveSystem or the FederalReserve BankofChicago.We
thank DavidCutler, Timo-thySalthouse,Fiona Scott-Mortonandparticipants at the InstituteforFiscal StudiesandtheNBER
(Aging group)fortheircomments.1
Introduction
Performance tends torise
and
then fallwithage. Baseball playerspeak in their late20s (Fair 2005b,James
2003). Mathematicians, theoretical physicists,andlyric poetsmake
theirmost
importantcontributions aromid age30 (Simonton 1988). Chess players achieve their highestrankingintheirmid-30s (Charness and Bosnian 1990). AutocraticrulerslikeQueen
ElizabethI aremaximally effective in theirearly 40' (Simonton1988). Authorswritetheir
most
influentialnovelsaroundage 50(Simonton 1988).^The
presentpaperstudiesan activitythatisrelevant totheentire adult population: per-sonalfinancialdecisionmaking.Most
financialproductsare complex anddifficultto under-stand. Fees areshroudedand
the true costs of afinancial servicesarenoteasilycalculated.Making
the bestfinancial choices takesknowledge, intelligence,and
skill.This paper
documents
cross-sectional variationinthe prices that peoplepay forfinancial services.We
find thatyounger adultsand older adultsborrowat higherinterestratesand
pay
more
feesthan middle-agedadults controUingforallobservablecharacteristics, including measuresofrisk.The hump-shaped
patternoffinancialsophisticationispresentinmany
markets.We
study interestratesinsixdifferentmarkets: mortgages,home
equityloans,home
equitycreditlines,auto loans, personal credit cards,
and
small businesscredit cards.We
study the failure to optimally exploit balance transfercreditcard offers. Finally,we
studythreekinds ofcredit cardfees: latepayment
fees, cash advance fees, and over limit fees. All ofthe evidence available to us implies ahump-shaped
patternof financialsophistication, withapeakinthe early50s.Age
effects provideaparsimonious explanationforthehump-shaped
pattern offinancial sophistication.We
hypothesize that financial sophistication depends on a combination of analyticabilityand
experientialknowledge. Researchoncognitiveaging implies that analytic ability follows a declining (weakly) concave trajectory after age 20.We
hypothesize that experientialknowledge follows an increasingconcave trajectory due to diminishingreturns.Adding
together these two factors implies thatfinancial sophistication shouldrise and thenfallwithage.
Cohorteffects
may
alsoexplainsome
oftheeffectsthatwe
observe. Differences in educa-tional levelsmay
explainwhy
older adults arelessfinanciallysophisticatedthan middle-aged adults. Naturally, such educationeffects willnot explainwhy
young
adults (aroundage 30) are lesssophisticatedthan middle-aged adults. Additionalwork
needstobedonetoidentify'Whatabouteconomists?Tothe bestofour knowledge, onlyNobel(Memorial) Prize winnersseemtohave beenstudied.Weinberg andGalenson (2005)findthat "conceptual" laureatespeakatage43,and
therelativecontributions ofageeffects
and
cohorteffects.The
paper hasthe following organization. Section2discussesevidenceoncognitiveperfor-mance
fromthepsychologyliterature. Section 3 describes the basic structuretothe empirical sections.The
next ten sections present results for interest rates onsix different financial products, threedifferentkinds of creditcardfeepayments,and onthe use ofbalancetransfer credit cardoffers. Section 14 usesalltensetsof resultstoestimate the ageofpeak sophistica-tion. Section 15 discusses other findingsontheeffectsofagingand
thedifficulty inseparately identifyingageeffectsand
cohorteffects. Section 16 concludes.2
Aging
and
cognitive
performance: Results
from
medical
and
psychological
research
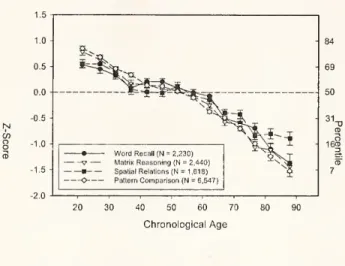
Analytic ability can be measured in
many
different ways, including tasks that measurememory,
reasoning,spatial visualization,and
speed(seeFigure1).Analyticperformance shows a strong age patternincross-sectionaldatasets. Analyticperformanceisnegatively correlated withageinadultpopulations (Salthouse2005and
Salthouse forthcoming): onaverage analytic performance fallsbytwotothreepercentofone standard deviation^ withevery incremental year ofageafterage20. Thisdeclineisremarkablysteadyfromage20 to age 90 (seeFigure2).
The measured
age-related decline in analytic performance results from both age effects and cohort effects, but the panel datathat is available implies thatthedechne is primarily driven by ageeffects (Salthouse, Sclu-oederand
Ferrer2004).'^ Medicalpathologies represent' one importantpathway
for age effects. For instance, dementia isprimarily attributable to Alzheimer's Disease(60%)and
vascular disease (25%).The
prevalence ofdementiadoubles witheveryfive additionalyears oflifecycleage(Fratiglioni,De
Ronchi, Agiiero- Torres, 1999). Age-drivendeclines inanalytic performancearepartially offsetbyage-driven increases in experience. Ifgeneral taskperformanceisa function of both analyticabilityandexperiential knowledge,thengeneraltaskperformanceshouldfirstincreasewithage (aspeopleaccumulatemore
earlylifeexperience),and
thendecline (as experience saturates).'' Figure 3illustrates thismechanism.The
currentpaperteststhehypothesis that general taskperformanceshould followahump-shapedpatternwithage.
We
focusonfinancialdecision-making. Because ourfinancialmarket'Thisisastandard deviation calculatedfromtheentirepopulationof individuals. ''SeeFlynn(1984)fora discussionofcohorteffects.
''
SupposeAnalyticPerformance(AP)
=
a—faxage,andExperience=
c-I-dxage,whiletotalperformanceMemory
study the followingwords andthienwriteas
manyasyoucanremember
Goat Door Fish Desk Rope Lake Boot Frog Soup Mule SpatialVisualization
Select the objecton theright thatcorrespondsto
the patternontheleft
cfa
Q B g
Reasoning
Select thebestcompletion of the missingcell in
the matrix !
n A
D
A
1A
1A
D
O
!Z1A
I—
PerceptualSpeedClassify thepairsassame(S) or different(D)as
quicklyas possible
Figure 1: Four
IQ
testsusedtomeasurecognitiveperformance. Source:Salthouse (forthcom-ing)-dataspana short
number
ofyears,we
areunabletodecompose
the relativecontributions of ageandcohorteffects.3
Overview
We
document
aU-shaped
curveinfinancial "mistakes" over the lifecyclein ten separate contexts:home
equity loansand
linesof credit; autoloans; creditcard interest rates; mort-gages; small business credit cards; creditcard latepayment
fees; creditcard over limit fees;creditcardcashadvancefees;
and
use ofcreditcardbalancetransferoffers.We
diagnose mistakesinthree forms: higherAPRs
(interest rates);higherfeepayments;and
suboptimaluse ofbalancetransferoffers.For eachapplication,
we
conductregression analysisthatidentifiesageeffectsandcontrols for observable factors that mightexplain patterns offeepayments
orAPRs
byage. Thus, unless otherwise noted,ineachcontextwe
estimate a regressionofthe type:(1)
F —
a
+
/3X Spline{Age)+
-yx Controls+
e.Salthouse Studies-MemoryandAnalyticTasks 1.5 1.0 -0.5 -0.0 -0.5 --1.0 --1.5 -2.0 V-
—
MatrixReasoning(N =2.440) SpatialRelations (N =1,611 PatternComparison(N = 6,547) 69 50 CD leS 7 20 30 40 50 60 70 80 CiironologicalAgeFigure2:
Age-normed
resultsfrom fourdifferentcognitivetests.The
Z-score represents the age-contingentmean,measured
inunits ofstandarddeviationrelativeto thepopulationmean.More
precisely, the Z-scoreis (age-contingentmean
minus populationmean)
/ (population standarddeviation). Source: Salthouse (forthcoming).Cognitive capital Task Performance Experiential capital
Performance
Analytic capitalAge
Figure3: Hypothesizedrelationbetweengeneral taskperformanceandage. Analytical capital declines with age and experiential capital increasewith age. Thisgenerates the hypothesis thatgeneral taskperformance (whichusesboth analytical
and
experientialcapital)firstrisesisa vector of control variables intended tocapturealternativeexplanationsineachcontext(for example, measuresofcredit risk),
and
S'pline{Age) is a piecewiselinear function that takesconsumer
age asitsargument(withknotpointsatages30, 40, 50,60and
70).^We
thenplot thefittedvaluesforthe splineonage. Regressions are eitherpooledpanel orcross-sectional, dependingonthe context.Each
sectiondiscussesthenatureofthe mistake,brieflydocuments
the datasets used, and presents the regressionresultsand graphs byage.We
providesummary
statistics forthedata sets intheAppendix.4
Home
Equity
Loans
4.1
Data Summciry
We
use a proprietary panel dataset from a large financial institution that issuedhome
equity loans
and
home
equitylinesofcredit nationally.Between
March and December
2002, the lender offered amenu
ofstandardized contracts forhome
equity credits.Consumers
couldchoose betweenacreditloan
and
line;betweenafirstand
secondlien;and
couldchoose to pledge differentamounts
ofcollateral, withtheamount
of collateral implying a loan-to-value(LTV)
ratio ofless than 80 percent, between 80 and 90 percent,and
between 90 an 100 percent) Ineffect, the lender offered twelvedifferent contractchoices. For 75,000 such contracts,we
observe the contract terms, borrower demographic information (age, years at currentjob,home
tenure),financialinformation (incomeand
debt-to-incomeratio), andrisk characteristics (credit(FICO)
score, andLTV).
We
alsoobserveborrowerestimates oftheir housevaluesand
the loanamount
requested.4.2
Results
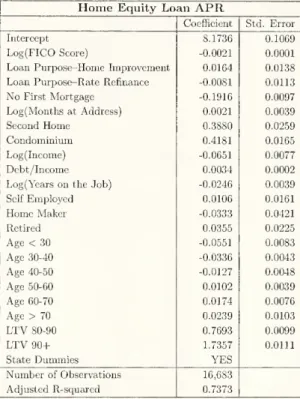
Table1reportstheresultsofestimating regressions of
APRs
(interest rates)onhome
equity loansona splinefor ageandcontrolvariables.As
controls,we
useallvariables observable to thefinancialinstitution thatmightaffect loanpricing, includingcredit risk measures, house andloancharacteristics,and
borrowerfinancialand demographiccharacteristics.The
control variablesall have theexpectedsign,and most
arestatisticallysignificant, althoughsome
ofthem
lackeconomicsignificance,perhapssurprisingly soinsome
cases.The
measureof credit risk, the logoftheFICO
score (lagged threemonths
because it isonly updated quarterly), comes instatistically significant but witha negligiblemagnitude.Our
understanding from discussionswithpeoplewho
work
intheindustryisthatfinancialinstitutionsgenerally use the'""Forinstance, inTable 1, the "Age30-40" splineis: max(30,min(40, /Ige)),the "Age
<
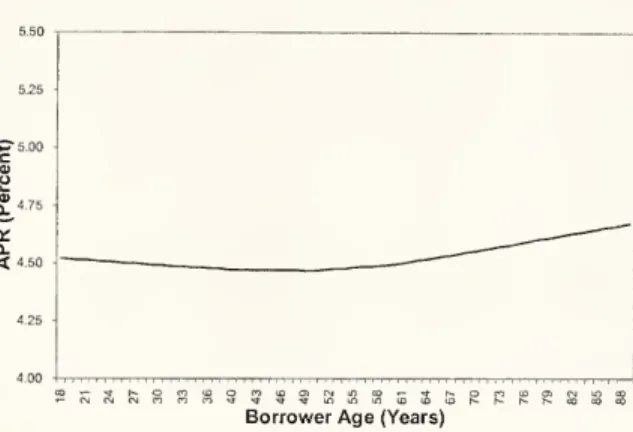
30" spline isHome
EquityLoanAPR
byBorrowerAge
Borrower
Age
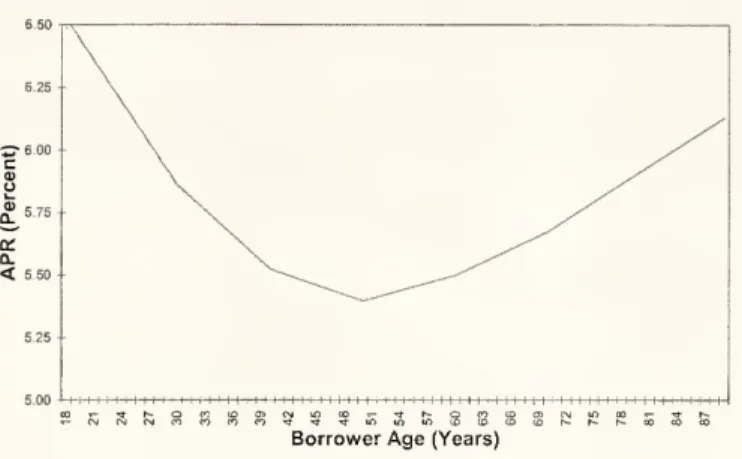
(Years)Figure4:
Home
equityloanAPR
by
borrower age.The
figureplotsthe residualeffectofage, aftercontrollingforother observablecharacteristics,suchaslog(income)and
credit-worthiness.FICO
scoretodetermine whethera loanofferismade, butconditionalontheofferbeingmade, donot use the score to dorisk-based pricing.The
results here, andfor theotherconsumer credit products discussed below, are consistentwiththishypothesis.Loan
APRs
dodepend stronglyontheabsenceofafirstmortgage (reducing theAPR),
and whetherthepropertyisa second
home
ora condominium.The
absenceofafirst mortgagereduces the probability of default andraises theamount
thatmight be recovered conditionalon adefault. Secondhomes
andcondominiums
are perceivedasbeingriskierproperties.Log
incomeandlogyearson
thejobalsohavelargeand
negativeeffectsonAPRs,
asexpected, sincetheyindicatemore
resources available topayofftheloan,
and
perhaps lessrisk inthelatter case.The
largest effects onAPRs
come
fromdummy
variablesforLTV
ratios between80and90 percent and forratiosgreaterthan 90percent. ThisisconsistentwithdifferentLTV
ratioscorresponding todifferentcontract choices.Even
aftercontrollingforthesevariables,we
findthattheagesplineshavestatisticallyand
economicallysignificant effects. Figure 4 plots thefittedvaluesonthe splineforagefor
home
equity loans.
The
linehas apronounced U-shape, withsome
youngerand
olderborrowers paying100 basis pointsmore
than borrowersintheir late fortiesandearlyfifties. Forthisand
the nine otherstudies,
we
presentinsection 14.2a formaltest fortheU-shape,whichthedata willpass.Home
Equity
Loan
APR
Coefficient Std. Error Intercept 8.1736 0.1069
Log(FICO
Score) -0.0021 0.0001LoanPurpose-Home Improvement 0.0164 0.0138 Loan Purpose-RateRefinance -0.0081 0.0113
No
FirstMortgage -0.1916 0.0097 Log(Months atAddress) 0.0021 0.0039 SecondHome
0.3880 0.0259Condominium
0.4181 0.0165 Log(Income) -0.0651 0.0077 Debt/Income 0.0034 0.0002 Log(YearsontheJob) -0.0246 0.0039 SelfEmployed 0.0106 0.0161Home
Maker -0.0333 0.0421 Retired 0.0355 0.0225 Age<
30 -0.0551 0.0083 Age30-40 -0.0336 0.0043 Age40-50 -0.0127 0.0048 Age50-60 0.0102 0.0039 Age60-70 0.0174 0.0076 Age>
70 0.0239 0.0103LTV
80-90 0.7693 0.0099LTV
90-t- 1.7357 0.0111State
Dummies
YES
Number
ofObservations 16,683 Adjusted R-squared 0.7373Table 1:
The
firstcolumn
gives coefficient estimatesfor a regressionoftheAPR
ofahome
equity loanona splinewithage asitsargument,financialcontrol variables
(Log(FICO)
credit risk score,income,and
the debt-to-income-ratio),and
other controls(statedummies,adummy
forloansmade
forhome
improvements,adummy
forloansmade
forrefinancing,adummy
for nofirstmortgageonthe property,months
atthe address, yearsworked onthejob,dummies
for self-emplyed,retiree,orhomemaker
status,and
adummy
ifthepropertyisacondominium).Home
EquityCreditLineAPR
byBorrowerAge
Borrower
Age
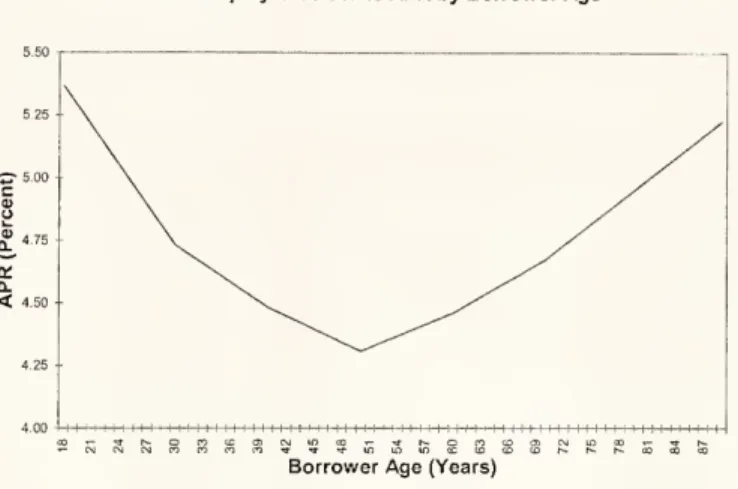
(Years)Figure5:
Home
equity creditlineAPR
by borrower age.^The
figureplots the residualeffect ofage, aftercontrolling for other observablecharacteristics, such aslog(income) and credit-worthiness.5
Home
Equity
Lines of
Credit
5.1
Data
Summary
Data
arethesame
as describedinthe previoussection.5.2
Results
Table2reportstheresultsof estimating regressions of
APRs
on
home
equitylinesof credit on asplineforageand
thesame
control variables usedforthehome
equity loans regression.The
control variableshavesimilareffectsonhome
equitylineAPRs
asthey didforhome
equity loanAPRs.
Fitted valuesontheagesplines,plottedinFigure5,continue tohavethe
same
pronounced U-shape, withsome
youngerand
older borrowers again paj'ing 100 basis pointmore
than borrowersin their late fortiesandearly fifties. , .5.3
One
Mechanism: Borrower
Misestimation
of
Home
Values
The amount
of collateralofferedbytheborrower,asmeasured bythe loan-to- value(LTV)
ratio, is an important determinant ofloan
APRs.
HigherLTVs
imply higherAPRs,
sinceHome
Equity Line
APR
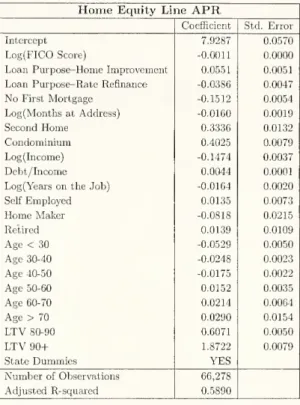
Coefficient Std. Error Intercept 7.9287 0.0570
Log(FICO
Score) -0.0011 0.0000Loan Purpose-Home Improvement 0.0551 0.0051 Loan Purpose-RateRefinance -0.0386 0.0047
No
FirstMortgage -0.1512 0.0054 Log(MonthsatAddress) -0.0160 0.0019 SecondHome
0.3336 0.0132Condominium
0.4025 0.0079 Log(Income) -0.1474 0.0037 Debt/Income 0.0044 0.0001 Log(YearsontheJob) -0.0164 0.0020 SelfEmployed 0.0135 0.0073Home
Maker -0.0818 0.0215 Retired 0.0139 0.0109Age
<
30 -0.0529 0.0050 Age30-40 -0.0248 0.0023 Age40-50 -0.0175 0.0022 Age50-60 0.0152 0.0035 Age60-70 0.0214 0.0064 Age>
70 0.0290 0.0154LTV
80-90 0.6071 0.0050LTV
90+
1.8722 0.0079 StateDummies
YES
Number
ofObservations 66,278 Adjusted R-squared 0.5890Table2: Tliefirst
column
givescoefficientestimatesfora regression of theAPR
ofahome
eq-uitylinesofcrediton a sphne withage asitsargument,financialcontrol variables(Log(FICO)
credit risk score, income,
and
the debt-to-income-ratio),and
other controls (statedummies,
a
dummy
forloansmade
forhome
improvements, adummy
forloansmade
for refinancing,adummy
fornofirstmortgage onthe property,months
atthe address, yearsworked onthejob,dummies
forself-employed, retiree, orhomemaker
status,and
adummy
iftheproperty is acondominium)
.
the fraction ofcollateralislower. Atthisffnancial institution,borrowersestimatetheir
home
values,
and
askfora creditloan orhnefallingintooneofthree categoriesdepending onthe impliedLTV.
The
categoriescorrespond toLTVs
of80percent orless;LTVs
ofbetween80and
90 percent;and
LTVs
of90percent orgreater.The
financialinstitutionseparatelyverifies thehousevalueusinganindustry-standard methodology.Loan
pricingdependson
theLTV
category theborrower falls into, and noton thespecific valuewithin that category; that is,
aloanwithan
LTV
of60has thesame
interest rateas a loanwith anLTV
of70, holding borrowercharacteristicsfixed.^
Iftheborrowerhasoverestimatedthe value of the house, so that the
LTV
isin facthigher thanoriginallyestimated, thefinancialinstitutionwilldirectthebuyertoadifferentloanwith a higherinterestratecorrespondingtothehigherLTV.
Insuchcircumstances, the loanofficeris alsogiven
some
discretionto departfromthefinancial institution'snormalpricingschedule to offer a higher interest rate than he or she would haveto aborrowerwho
had
correctly estimated theLTV.
Iftheborrower has underestimatedthevalue of the house,however, the financialinstitutionneednotdirectthebuyertoaloanwitha lowerinterestratecorresponding to the actual lowerLTV;
itmay
simply choose toofferthe same, higherinterest rate, for a lower-riskloan.'^Since the
APR
paiddepends on the category theLTV
falls in, andnot theLTV,
home
value misestimation only leadsto higher interestrate
payments
if itcausesLTVs
tochange in such away
that the loanmoves
intoa differentcategory. If, incontrast, theborrower's estimatedLTV
wereequal to 60,butthe trueLTV
were70, theborrowerwouldstillqualify for the highest quality loan categoryand
wouldnotsufferan interestratepenalty.We
define a RateChanging
Mistake(RCM)
tohave occurredwhen
a borrower'smisestimationofhouse value causes achangeinLTV
categoryand
potentiallyachange ininterestrate paid.^We
find that, on average,making
anRCM
increasestheAPR
by 125 basis points forloansand 150 basis pointsforlines (controllingforothervariables,butnotage).Ifthe probability of
making
a rate-changingmistakeisU-shaped withage,thena regression ofAPR
onage conditioningonnothaving anRCM
shouldshow
a nearlyflatpattern.^We
haveverified thispracticein our datasctbyregressing theAPR
on boththe leveloftheLTV
anddummy
variables forwhethertheLTV
falls intooneofthe threecategories. Onlythecoefficients onthedummy
variableswerestatisticallyandeconomicallysignificant."^Notethatevenifthefinancial institution'sestimateofthe truehouse valueisinaccurate,that misestimation
willnotmatterfortheborroweraslongasotherinstitutionsusethesamemethodology.
*Specifically,
RCMs
occurwhentheborrower's estimationof hisorherhouse valueissuch that theLTV
is lessthan80,whilethe trueLTV
isbetween80and90; ortheestimatedLTV
islessthan 80andthe trueLTV
isgreaterthan90;ortheestimated
LTV
isbetween80and90,but the trueislessthan80; ortheestimatedLTV
isbetween80and90,but the trueLTV
isgreaterthan90; orthe estimatedLTV
isgreaterthan90,but the trueLTV
islessthan80; ortheestimatedLTV
isgreaterthan90,but the trueLTV
isbetween80and90. ^Bucksand Pence (2006) present evidence that borrowersdonot generally have accurate estimatesof theirhousevalues.
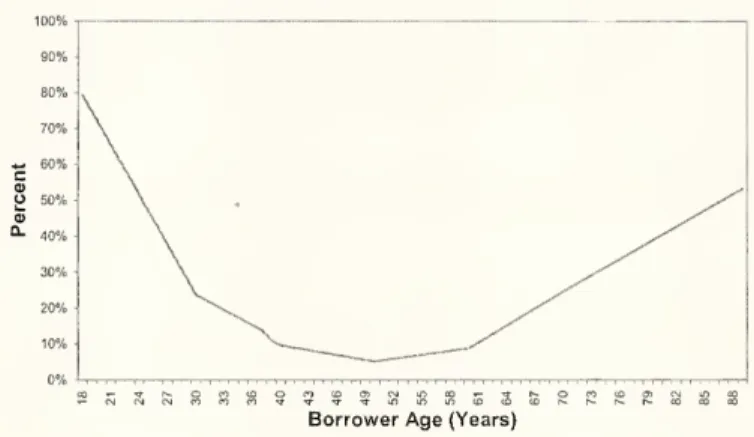
PropensityofMakingaRate-ChangingMistakeon
Home
EquityLoansbyBorrower
Age
Borrower
Age
(Years)Figure 6: Propensityof
making
aRateChanging
Mistakeonhome
equity loansby borrower age.We
define aRate
Changing
Mistaketohave occurredwlien a borrower'smisestimation ofhousevaluecausesachangeinLTV
categoryand
potentiallya changeininterestratepaid (see the textforafulldefinition).The
figureplotsthe residualeffect ofage, aftercontrolling forotherobservablecharacteristics,suchaslog(income)and
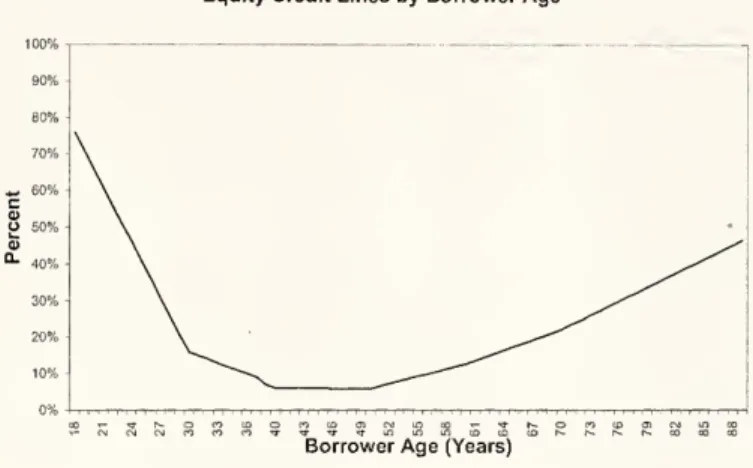
credit-worthiness.PropensityofMakingaRate-ChangingIVlistakeon
Home
Equity Credit LinesbyBorrower
Age
90% 80% 70%
\
^
60% C V O 50% -a> '^ 40%-\
.
30%\
^^^
20%\
'^^^^^^
10%^"^-^
^^^--^'^^^
0%Borrower
Age
(Years)Figure 7: Propensity of
making
a RateChanging
Mistake onhome
equity credit linesby
borrowerage.
We
defineaRate
Changing
Mistaketohave occurredwhen
a borrower's mises-timationofhousevahiecausesachangeinLTV
categoryand
potentiallyachangein interest ratepaid (seethe textfor a fulldefinition).The
figureplotsthe residualeffect ofage, after controllingforotherobservablecharacteristics,suchaslog(income) andcredit-worthiness.Home
EquityLoanAPRs
forBorrowersWho
DoNotMakea Rate-ChangingIVIistal<eBorrower
Age
(Years)Figure8:
Home
equity loanAPRs
forborrowerswho
donotmake
a rate-changing mistake.The
figureplotsthe residualeffectofage, aftercontrollingforotherobservablecharacteristics, suchaslog(income) andcredit-worthiness.Figures 6
and
7 plots the probabilityofmaking
a rate-changingmistakebyageforhome
equity loansand
home
equitylines,respectively.The
chartsshow
U-shapesforboth. Borrow-ers atage 70havea 16(19)percentagepoint greaterchanceofmaking
amistakethan borrowers at age 50 forhome
equity loans (lines); borrowersat age 20have a 35(41) percentage point greaterchance ofmaking
a mistake than borrowers at age 50.The
unconditional average probability ofmaking
a rate-changingmistakeis24percentforloansand
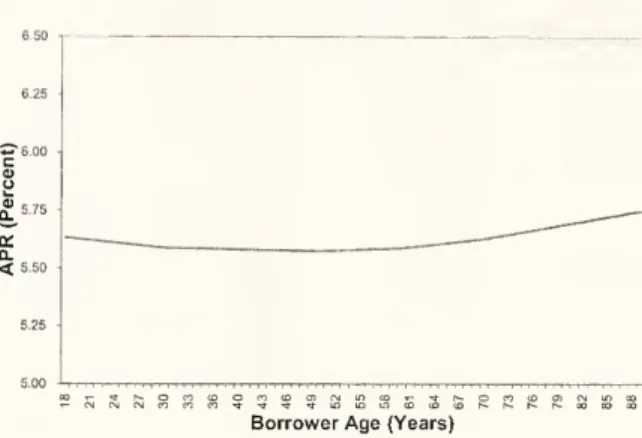
18percentforlines.Figures 8
and
9plotthefittedvaluesfromre-estimatingthe regressionsintable3,butnow
conditioningontheborrowernot
making
anRCAi.The
plotsshowsonlyslightdifferences inAPR
paidbyage.The
APR
differenceforahome
equity loanforaborrowerat age70 over aborrowerat age50has shrunk from36 basis points to 8 basis points;forahome
equityline ofcredit, it has slnrunkfrom 28 basis points to 4 basis points. For aborrower atage20, theAPR
differenceover aborrowerat age50 hasshrunk to 3basis pointsforhome
equity loans and3basispointsforhome
equitylinesofcredit.This disappearanceofthe ageeffectisconsistentwiththecostofan
RCM
calculatedabove andthe additional probabilityofmaking
anRCM
byage. Forexample,a70-year old has a 16 and 19 percent additionalchanceofmaking
anRCM
forloans anlines. Multiplyingthisby the averageAPR
cost ofanRCM
forhome
equitylinesand
loans of150and 125 basis points, respectively, gives an expected inAPR
paid of26and
23 basis points. ThesedifferencesHome
EquityCreditLineAPRs
forBorrowersWho
DoNot Mal<e aRate-Changing MistakeBorrowerAge(Years)
Figure 9:
Home
equity credit lineAPRs
for borrowerswho
do notmake
a rate-changing mistake.The
figure plots the residual effect ofage, after controlling for other observable characteristics,suchaslog(income)and
credit-worthiness.are,veryclosetotheestimateddifferencesof36-8=28 basispointsfor lines
and
28-5=23basis pointsfor loans.6
Credit
Cards
6.1
Data
Summary
We
use aproprietarypanel datasetfroma large U.S.bank
thatissuescredit cardsnationally.The
dataset contains a representativerandom
sampleofabout 128,000 credit card accounts followedmonthlyovera36month
period(fromJanuary 2002 throughDecember
2004).The
bulk ofthe data consists of the
main
billing information listed on each account's monthly statement, includingtotalpayment, spending, credit limit,balance, debt, purchasesandcash advance annualpercent rates (APRs), andfeespaid. At a quarterly frequency,we
observe each customer's credit bureau rating(FICO)
and a proprietary (internal) credit 'behavior' score.We
havecreditbureau data aboutthenumber
ofothercreditcards heldby
theaccount holder,total credit card balances,and
mortgagebalances.We
have dataontheage,genderand
incomeofthe accountholder, collected atthe timeofaccount opening. Furtherdetailson
the data, includingsummary
statisticsandvariable definitions, are availablein the dataCredit
Card
APR
Coefficient Std. Error Intercept 14.2743 3.0335 Age<
30 -0.0127 0.0065 Age30-40 -0.0075 0.0045 Age40-50 -0.0041 0.0045 Age50-60 0.0023 0.0060 Age60-70 0.0016 0.0184 Age>
70 0.0016 0.0364 Log(Income) -0.0558 0.0803 Log(FICO) -0.0183 0.0015Home
Equity Balance 0.0003 0.0022 MortgageBalance -0.0000 0.0000Number
ofObservations 92,278 Adjusted R-squared 0.0826Table 3: This table givescoefficient estimates for a regression oftire
APR
ofa credit card ona splinewithage asitsargument,financialcontrol variables(Log(FICO)
credit risk score, income, totalnumber
of cards, totalcard balance,home
equity debt balanceand
mortgage balance).appendix.
6.2
Results
Table 3 reports the results ofregressing credit card
APRs
on a spline with age as the argumentand
other controlvariables.As
controls,we
again use informationobservedbythe financialinstitutionthatmay
influencetheir pricing.As
before,we
findthatcreditscoreshave verylittle impacton creditcardAPRs.
APRs
rise withthe totalnumber
ofcards, though theeffectisnot statistically significant. Othercontrols, including thetotalcard balance, log income,andbalancesonother debt,donothave economicallyorstatisticallysignificant effects oncreditcardAPRs.
Figure??plotsthefittedvaluesonthe splineforage.
A
U-shapeispresent,thoughmuch
lesspronounced thaninthe case of
home
equityloans.7
Auto
Loans
7.1
Data
Summary
We
usea proprietarydatasetofautoloans originatedatseveral largefinancialinstitutions thatwerelateracquiredby anotherinstitution.The
datasetcomprisesobservationson 6996 loans originatedforthepurchaseofnew and
usedautomobiles.We
observe loan characteristics includingtheautomobilevalueandage,theloanamount and
LTV,
themonthly payment,theCreditCard
APR
byBorrowerAge
Borrower
Age
(Years)Figure10: Credit card
APR
by borrowerage.The
figureplotsthe residualeffectofage, after controllingforotherobservablecharacteristics,suchaslog(income)and
credit-worthiness.contractrate,
and
thetimeof origination.We
alsoobserveborrowercharacteristicsincluding credit score,monthly
disposableincome,and
borrowerage.7.2
Results
Table4reports theresultsofestimating a regression of the
APR
paidon autoloansona splinewithageastheargument andcontrolvariables.FICO
credit riskscores againhavelittleeffectontheloan terms. Higherincomeslower
APRs
and
higherdebt-to-incomeratios raise them, though themagnitudes ofthe effects are neglige.We
alsoinclude car characteristics, such astypeand
age, as one ofus has found those variables to matter forAPRs
inotherwork
(Agarwal,Ambrose
and Chomsisengphet, forthcoming)-thoughwe
note that thefinancial institutionsdonot conditiontheirloanson suchvariables.We
alsoinclude loanageand
statedummies.
Figure 11 plots thefitted values
on
the splinefor age.The
graph again shows arather pronounced U-shape.Auto Loan
APR
CoefRcicnt Std. Error Intercept n.4979 1.3184 Age<
30 -0.0231 0.0045 Age30-40 -0.0036 0.0005 Age40-50 -0.0054 0.0005 Age50-60 0.0046 0.0007 Age60-70 0.0031 0.0017 Age>
70 0.0091 0.0042 Log(Income) -0.3486 0.0176 Log(FICO) -0.0952 0.0059 Debt/Income 0.0207 0.0020 JapaneseCar -0.0615 0.0270 European Car -0.0127 0.0038 LoanAge 0.0105 0.0005 CarAge 0.1234 0.0031 StateDummies
YES
Quarter
Dummies
YES
Number
ofObservations 6,996 AdjustedR-squared 0.0928Table4: Thistable givescoefficientestimatesfroma regressionofthe
APR
ofan autoloanona splinewithageasitsargument,financialcontrol variables(Log(FICO)
creditriskscore,income,and
the debt-to-income-ratio),and
other controls (statedummies,dummies
for whetherthe carisJapaneseorEuropean,loanageand
carage).AutoLoan
APR
byBorrowerAge
Borrower
Age
(Years)Figure11:
Auto
loanAPR
by borrowerage.The
figureplots the residualeffect ofage, after controllingforother observablecharacteristics, suchas log(incQme)and
credit-worthiness.8
Mortgages
8.1
Data
Summary
We
usea proprietarydatasetfroma largefinancial institutionthat originatesfirst mort-gagesinArgentina.The
datasetcovers 4,867owner-occupied,fixedrate,firstmortgageloans originatedbetweenJune 1998and
March
2000,and observed throughMarch
2004.We
observe theoriginalloanamount,theLTV
and
appraisedhousevalueatorigination,andtheAPR.
We
alsoobserveborrowerfinancialcharacteristics (includingincome, second income,yearsonthe job,wealthmeasures suchassecond house ownershipandcarownership
and
value),borrower riskcharacteristics (Veraz score(acreditscore similar tothe U.S.FICO
score)and
mortgagepayments
asapercentageofafter-taxincome),and borrower demographiccharacteristics(age, genderand
maritalstatus).8.2
Results
Table5reportsresultsof regressingthemortgage
APR
ona splinewithageasanargument andcontrolvariables.As
controls,we
again use variables observable to thefinancialinstitution thatmay
affectloanpricing,includingriskmeasures(credit score,income,mortgagepayment
asa fraction ofincome, and
LTV),
andvariousdemographicand
financialindicators(gender, maritalstatus, adumiriyvariableforcarownership,and
several others; thesecoefficientsare not reported to save space).The
coefficients onthe controls areagain of the expectedsign andgenerally statistically significant,thoughofsmallmagnitude.The
coefficientsontheagesplineare positivebelowagethirty, thennegativethroughage 60and
positivethereafter. Figure12 plotsthefittedvaluesonthe splineforage.The
graph again generallyshowsaU-shape, though behaviorforyounger borrowersisratherdifferent.9
Small Business Credit
Cards
9.1
Data
Summary
We
usea proprietary datasetofsmall business creditcard accounts originatedat several large institutions that issued suchcards nationally.The
institutionswere later acquired by asingle institution.The
paneldatasetcovers 11,254 accounts originated betweenMay
200and
May
2002.Most
ofthe business are very small,owned
by asingle family, and have no formal financialrecords.The
data sethas all information collected at the time ofaccount origination, including the borrower's self-reported personal income, yeai^s inbusiness of the firm,and
borrowerage. Quarterly,we
observe theaccountcreditbureauscore.Mortgage
APR
Coefficient Std. Error Intercept 12.4366 4.9231 Age<
30 0.0027 0.0046 Age30-40 -0.0023 0.0047 Age40-50 -0.0057 0.0045 Age50-60 0.0127 0.0093 Age60-70 0.0155 0.0434 Age>
70 0.0234 0.0881 Log(Income) -0.2843 0.1303 Log( CreditScore) -0.1240 0.0217 Debt/Income 0.0859 0.2869 LoanTerm
-0.0114 0.0037 LoanTerm
Squared -0.0000 0.0000Loan
Amount
-0.0000 0.0000LoantoValue 0.1845 0.0187 YearsontheJob -0.0108 0.0046 Second
Home
0.1002 0.1014 Auto 0.1174 0.0807 AutoValue 0.0000 0.0000 Gender(l=Female) 0.0213 0.0706 Married -0.0585 0.0831Two
Incomes -0.1351 0.1799 Married withTwo
Incomes -0.0116 0.1957 Employment: Professional -0.0438 0.1174 Employment:Non-Professional 0.0853 0.1041 Merchant -0.1709 0.1124Bank
Relationship -0.2184 0.1041Number
ofObservations 4,867 AdjustedR-squared 0.1004Table5: Thistablereports theestimatedcoefficientsfroma regression ofmortgage
APR
ona splinewithage asitsargmnent and
financialand
demographiccontrolvariables.Mortgage
APR
byBorrowerAgeBorrower
Age
(Years)Figure12:
APR
for Argentine mortgages by borrowerage.The
figureplotsthe residualeffect ofage, after controlling for other observablecharacteristics, suchas log(income)and
credit-worthiness.9.2
Results
Table6reports theresultsofregressingthe
APR
forsmall businesscreditcardsonasphne with age as theargument
and control variables.As
with individual credit card accounts,we
control forthePICO
score of the borrower, the totalnumber
ofcards,card balance,and
cardlimit.
We
alsoincludedummy
variablesforyears inbusiness, and expectAPRs
tobe decreasing in this variable. All controls variables are statisticallysignificant and have the expectedsign, thoughonly thedummies
foryearsinbusinesshavesubstantialmagnitudes.APRs
aredecreasingintheageoftheborrowerthrough age60, andincreasingthereafter. Figure13 plotsthefittedvaluesonthe splinefor age.The
graph showsapronounced U-shape.10
Credit
Card
Fee
Payments:
Late
Fees
10.1
Overview
Certaincreditcard uses involve the
payment
ofafee.Some
kindsof feesareassessedwhen
termsofthecreditcard agreementareviolated. Otherkinds are assessedforuse ofservices. Inthe next threesections,
we
focusonthree importanttypes offees: late fees,over limitSmall Business Credit
Card
APR
Coefficient Std. Error Intercept 16.0601 0.6075 Age<
30 -0.0295 0.0081 Age30-40 -0.0068 0.0040 Age40-50 -0.0047 0.0038 Age50-60 -0.0017 0.0055 Age60-70 0.0060 0.0209 Age>
70 0.0193 0.0330 YearsinBusiness1-2 -0.5620 0.1885 YearsinBusiness2-3 -0.7463 0.1937 YearsinBusiness3-4 -0.2158 0.1031 YearsinBusiness4-5 -0.5100 0.0937 YearsinBusiness5-6 -0.4983 0.0931 Log(FICO) -0.0151 0.0008Number
ofCards 0.1379 0.0153Log(TotalCardBalance) 0.0000 0.0000 Log(TotalCardLimit) 0.0000 0.0000
Number
ofObservations 11,254 Adjusted R-squared 0.0933Table6: Thistablereportstheestimatedcoefficients froma regression of the
APR
forsmall business credit cardson
aspline with the business owner's age as itsargument
and other control variables(dummies
for j^ears inbusiness,log(FICO)credit risk score,number
ofcards, total card balance,and totalcardlimit).SmallBusinessCreditCard
APR
byBorrowerAge
Borrower
Age
(Years)Figure 13: Small business creditcard
APR
by borrowerage.The
figure plots the residual effect ofage, after controlling for other observable characteristics, such aslog(income) and credit-worthiness.
fees, and cash advancefees.-^°
We
describe thefeestructureforour datasetbelow.1.
Late
Fee:A
late fee ofbetween $30and
$35isassessediftheborrowermakes
apayment
beyond
theduedateonthecreditcard statement. Iftheborrowerislatebymore
than 60days once, orbymore
than 30days twicewithin ayear, thebank
may
alsoimpose 'penaltypricing' byraisingtheAPR
to over 24 percent.The bank
may
alsochoose to report latepayment
tocreditbureaus, adverselyaffecting consumers'FICO
scores. Iftheborrower does not
make
a latepayment
duringthe sixmonths
after thelastlate payment,theAPR
willrevert toitsnormal (thoughnotpromotional)level.2.
Over
Limit
Fee:An
overlimit fee, alsoofbetween $30 and$35, is assessedthe firsttime theborrower exceedshis orher credit limit.
The same
penalty pricing asinthe late feeisimposed.3.
Cash
Advance
Fee:A
cash advance fee ofthe greater of 3 percent of theamount
advanced,or$5,isleviedforeach cash advanceonthecreditcard. Unlike thefirsttwo fees,this feecanbeassessed
many
times permonth. Itdoes not cause the impositionof penaltypricingon purchasesor debt. However,theAPR
on cash advancesistypically greaterthanthaton pmxhases,and
isusually 16percent ormore.Payment
ofthesefeesmay
be viewedas mistakesinthatfeepayment
may
beavoidedby smalland
relatively costlesschangesinbehavior.We
use thesame
dataset as thatusedfor thecreditcardAPR
casestudydiscussedabove.10.2
Results
Table 7 presents panel regressionsfor each typeoffee. In eachof the threeregressions,
we
regressadummy
variableequal to oneifafee ispaid thatmonth
ona splineforageand
controlvariables;hencethecoefficientsgivethe conditionaleffectsoftheindependentvariables onthe propensity to payfees.
The
control variablesdiffer fromthose of the precedingsix examples, sincenow
we
wish to control for other things that mightaffect thepropensity topay
afee, which arenot necessarily thesame
asthingsthatmightleadborrowerstodefault orotherwiseaffecttheirborrowingterms. "BillExistence" isadummy
variableequaltooneifabill wasissued lastmonth; borrowerswillonlybeeligibletopay alate fee ifabill was issued. "BillActivity" isa
dummy
variableequal tooneifpurchases or paymeiatsweremade
Othertypesof feesincludeannual,balancetransfer,foreign transactions,and pay byphone. All ofthese
fees are relatively lessimportanttoboththe-bankandthe borrower. Fewissuers(themostnotable exception beingAmericanExpress) continuetocharge annualfees,largely asaresultofincreased competitionfornew borrowers(Agarwaletal.,2005). Thecardsinourdatadonothave annualfees.
We
study balancetransferbehavior using a separate datasetbelow. Theforeign transactionfeesandpayby phonefeestogether comprise
lessthan three percentofthetotal fees collectedbybanks.
onthe card; borrowerswillonlybeeligibleto payoverlimit orcashadvancefeesifthe card wasused. "Log(Purchases)" isthe log of the
amount
purchased onthe card, indollars;we
would expectthat the propensity topayoverlimitandcashadvancefeeswould beincreasing with the
amount
ofpurchases."Log(FICO)"
isthecredit risk score,and
"Log(Behavior)" isaninternalriskscore createdbythe
bank
topredictlateand
delinquentpayment beyond
that predictedbytheFICO
score. Higherscoresmean
lessrisky behavior.The
scores arelagged threemonths
because they are only updated quarterly.We
would expect the underlying behaviorleading to lowercredit riskscoreswouldlead tohigherfeepayment. "Debt/Limit"isthe ratio of the balance ofcreditcarddebttothecredit limit;
we
would expectthathaving lessavailablecreditwould raisethepropensity topayoverlimit fees,and
possibly otherfees.For late fee payments,
column
one ofthe table, all control variables have the expected signsand
arestatistically significant, though they arealso small in magnitude. Note thatsome
control variablesmay
partlycapturetheeffectsofage-related cognitive declineonfees.Forexample,ifincreasingage
makes
borrowersmore
likelytoforgettopayfeesontime,that would bothincreasethe propensity topaylate fees anddecreasecredit and behaviorscores.Hence
theestimatedcoefficientsonthe agesplinesmay
understatesome
age-related effects. Coefficientsontheagesplinesareuniformlynegativeforsplinesthroughage50, negative orweaklypositiveforthe splinebetweenage 50and60, andpositivewithincreasing slopefor splinesaboveage50.The
top line in Figure 14 plotsfitted valuesfor the age splinesfor the late feepayment
regression.
11
Credit
Card
Fee
Payments:
Over
Limit
Fees
The
secondcolumn
ofTable7 presents regressionresults forthe overlimitfee,onthesame
controls
and
agesplines asforthelatefee. Results arevery similar to thoseforthelatefee.The
bottom
lineinFigure14 plots fittedvaluesfor theage splines forthe overlimit feepayment
regression.12
Credit
Card
Fee
Payments:
Cash
Advance
Fees
The
secondcolumn
ofTable7 presents regressionresults forthe cash advancefee, onthesame
controlsand
agesplinesasforthelatefee. Results arevery similar to thoseforthelate feeand
overlimitfee.The
middlelineinFigure 14 plotsfittedvaluesfortheagesplines forthecashadvancefeepayment
regression.Late
Fee
Over
Limit
Fee
Cash Adv.
Fee
Coeff. Std. Err. Coeff. Std. Err. Coeff. Std. Err. Intercept 0.2964 0.0446 0.1870 0.0802 0.3431 0.0631 Age
<
30 -0.0021 0.0004 -0.0013 0.0006 -0.0026 0.0011 Age30-40 -0.0061 0.0003 -0.0003 0.0001 -0.0004 0.0002 Age40-50 -0.0001 0.0000 -0.0002 0.0000 -0.0002 0.0000 Age50-60 -0.0002 0.0000 -0.0002 0.0000 -0.0003 0.0000 Age60-70 0.0004 0.0002 0.0003 0.0001 0.0004 0.0000 Age>
70 0.0025 0.0013 0.0003 0.0001 0.0004 0.0000 BillExistence 0.0153 0.0076 0.0104 0.0031 0.0055 0.0021 BillActivity 0.0073 0.0034 0.0088 0.0030 0.0055 0.0021 Log(Purchases) 0.0181 0.0056 0.0113 0.0023 0.0179 0.0079 Log(Behavior) -0.0017 0.0000 -0.0031 0.0012 -0.0075 0.0036 Log(FICO) -0.0016 0.0007 -0.0012 0.0003 -0.0015 0.0005 Debt/Limit -0.0066 0.0033 0.0035 0.0013 0.0038 0.0012 Acct. FixedEff.YES
YES
YES
Time
FixedEff.YES
YES
^ES
Number
ofObs. 3.9Mill. 3.9Mill. 3.9Mill.Adj. R-squarcd 0.0378 0.0409 0.0388
Table7: Thistablereportscoefficients-froma regression of
dummy
variablesforcreditcardfeepayments on
asphneforage, financialcontrol variables (log(FICO) credit risk score,internalbank
behaviorriskscore,debtoverlimit)and
other control variables(dummies
forwhether abillexistedlastmonth, forwhetherthecardwas usedlastmonth,dollar
amount
ofpurchases, account- andtime-fixed effects).FrequencyofFeePaymentbyBorrowerAge 0.35 0,33
S
0.31 c o £0.29 g_0.27 2*0.25-C as 30.23 -CTi
0.21 -O d)0.19 -u. 0.17 0.15LateFee OverLimitFee
"
Cash AdvanceFeeBorrowerAge(Years)
Figure 14: Frequencyoffee
payment
by borrower age.The
figureplots the residualeffect ofage, aftercontrollingfor other observable characteristics, suchas log(income) and credit-worthiness.13
'Eureka'
Moments:
Balance Transfer Credit
Card
Usage
13.1
Overview^
Creditcard holders frequently receiveoffersto transfer account balancesontheircurrent cards to a
new
card. Borrowers paysubstantially lowerAPRs
onthe balances transferred to thenew
card fora six-to-nine-month period (a 'teaser' rate). However,new
purchaseson thenew
cardhavehighAPRs.
The
catchisthatpayments onthenew
cardgofirsttowardspaying
down
the (low interest) transferred balances,and
only subsequently towards payingdown
the (highinterest) debt accumulated fromnew
purchases.The
optimalstrategyforborrowers,is tomake
allnew
purchasesontheir old creditcardand
tomake
nonew
purchases withthenew
cardto which balances havebeentransferred.We
hypothesize thatsome
borrowerswill figure this out beforemaking
anypurchases with thenew
card.Some
borrowersmay
notinitially understandthe optimal strategy, andwill onlyfigureitoutbyobservingtheir (surprisingly) highinterestcharges.Those
borrowerswillmake
purchasesfor oneormore
months, then havea 'eureka'moment,
after whichtheywill implementtheoptimalstrategy.Some
borrowers willneveridentifytheoptimalstrategy.13.2
Data
summary
We
usea proprietarypaneldatasetfromseverallargefinancial institutions, lateracquired by asingle financial institution, thatmade
balancetransfer offers nationally.The
dataset contains 14,798 accounts which accepted suchoffers over theperiod January 2000 tliroughDecember
2002,The
bulkofthedataconsists ofthemain
bilhng informationlistedon each account'smonthlystatement, includingtotal payment,spending, credithmit, balance, debt, purchases and cash advance annual percent rates (APRs), and feespaid.We
also observe theamount
ofthe balance transfer, the start date of the balance transfer teaser rateoffer,theinitialteaser
APR
onthebalancetransfer,and
theenddateofthebalancetransferAPR
offer.
At
aquarterly frequency,we
observeeachcustomer'screditbureaurating(FICO)
and a proprietary(internal)credit 'behavior'score.We
havecreditbureau data aboutthenumber
of other credit cards held by the accountholder, total credit card balances,
and
mortgage balances.We
have data on the age, genderand
income ofthe account holder, collected at thetime ofaccount opening. Furtherdetails onthe data, includingsummary
statisticsand
variabledefinitions, are availableinthedata appendix.
13.3
Results
About
onethird ofallcustomerswho
make
abalancetransferdo no spending onthenew
card, thusimplementing the optimalstrategyimmediately. Slightly
more
than onethirdof customerswho make
a balance trairsfer spend everymonth
duringthe promotional period, thus never experiencing a "Eureka"moment.
Figure15 plots thefrequencyofEureka
moments
foreachage group.The
plotofthosewho
never experience a "Eureka"
moment-that
is,who
neverimplementtheoptimalstrategy-is a pronounced U-shape byage.The
plot ofthosewho
implementthe strategyimmediately isa pronouncedinverted U-shape byage. Plots fortheothermonths
arerelativelyflat.Table8 reports theresults ofa regression of a
dummy
variablefor everhaving aEurekamoment
ona spline for age and controls for creditrisk (log(FICO)), education, genderand
log(income).-''. Creditriskisincluded becausehigher scores
may
be associatedwithgreater financialsophistication. Similarly,we
would expect borrowers withhigherlevelsofeducation tobemore
likelytoexperienceEurekamoments
The
coefficientsontheage splineimplythatyoung
adultsand
older adults arelesslikelytoexperienceEurekamoments.
Figure16 plotsfittedvalues forthe agesplines.
Note
that, unlike the otherfigures, higher values indicatea smaller propensity tomake
mistakes."Although wereportan
OLS
regressionforeaseininterpretingthecoefficients,wehavealsorun theregressionFraction ofBorrowersinEachAge GroupExperiencinga EurekaIVloment,byiVIonth
50% ---MonthOne --- MonthFour NoEureka MonthTwo MonthFive MonthThree MonthSix 40%
\^,.
----"''-^^
30%;.--'^^^
20% 10%,..___
0% 18to24 25to34 35to44 45to64 Over 65BorrowerAgeCategory
Figure15: Fraction ofborrowersineachagegroupexperiencingspecific delays. Forexample, thedashed-bluelineplotsthe fraction ofborrowersexperiencingnodelay to aEureka
moment.
Thesesophisticatedborrowersrepresenta large fraction ofmiddle-aged households
and
amuch
smaller fraction ofyounger
and
olderhouseholds.Propensity
ofEureka
Moment
Coefficient Std. Error Intercept Age<30
Age30-40 Age40-50 Age50-60 Age60-70 Age >70Some
HighSchool HighSchoolGraduateSome
College Associate'sDegree Bachelor'sDegree Graduate log(FICO) log(Limit) log(Income) 0.2587 0.0134 0.0019 -0.0001 -0.0029 -0.0035 -0.0083 -1.6428 -0.6896 -0.4341 -0.2439 0.3280 0.6574 0.0102 0.0120 -0.0044 0.0809 0.0026 0.0005 0.0000 0.0009 0.0008 0.0072 0.9570 0.8528 0.8944 0.4537 0.5585 0.3541 0.0019 0.0022 0.0067Number
ofObservations Adjusted R-squared 3,622 0.1429Table8: Thistablereportsestimatedcoefficientsfromapanel regressionoftlie
month
inwhich theborrowerdid nomore
spendingonthebalance transfercard (the 'eurekamoment')on
a splinewithageas itsargument
and
other controlvariables.14
Quantifying the
Performance
Pecik
14.1
Locating
the
Peak
ofPerformance
Visual inspection of the agesplines fortheten case studies suggests thatfinancialmistakes areata
minimum
inthelate fortiesorearlj' fifties.To
estimate theminimum
more
precisely,we
re-estimateeachmodel,replacingthesplinesbetween40and50and
50and
60withasingle splinerunningfrom40 to60, andthesquareofthatspline.Inotherwords,
we
runthe following regression,whereF
istheoutcome
associated respec-tivelywith eachofthe 10studies:(2)
a
-(-/?X5'p/me(A(/e)4jg^[4o60]
+
7x Controls+
e+a
X Spline(A5e).45e6[40,60]+
^'Spline(^5'e)A3eel40,60]•
Here Spline{Age)isa piecewiselinearfunction that takes
consumer
ageasitsargument(with knotpoints atages 30,40, 60and 70). Spline{Age)j^gg^i^QQQ-^ representsthesplinesoutside ofthe[40,60] age range, whileSpline {Age) y^^^^QQQ^ isthelinearsplinewithknot points atasalogitandfoundsimilar results.
PropensityofEver ExperiencingaEureka
Moment
by BorrowerAge
Borrower
Age
(Years)Figure 16: Propensity ofeverexperiencing a eurelca
moment
by borrower age.The
figure plotsthe residual effect ofage, aftercontrolling forother observable characteristics, such as log(income), education,and
credit-worthiness.40
and
60. Hence, foragebetween 40and60,the aboveformulationisjust:F =
Controls+
a xAge
+
bxAge^
The
peak
ofperformanceisthevalue that minimizestheabovefunction, i.e.(3)
Peak
=
-a/
(26)We
calculatetheasymptotic standarderrorsonPeak
using the deltamethod,sothat s.e.{Peak)isthestandarderrorassociatedwith thelinearcombination:
—
l/(26)-(Coefficientonage)+
a/(26^)-(CoefHcientonage^).
In Table 9,
we
report the location ofthe 'age ofreason': the point at which financial mistakesareminimized.The
mean
age of reasonappearsto beat 53.3years.The
standard deviation across studiesis4.3 years.Formalhypothesis testing (Hq: a
+
25x53=
0)showsthatonly the location of theEurekamoment
isstatisticallydifferentfrom53years. Interestingly,theEurekataskisarguable themost
"difficult" task,i.e. themost
cognitively intensive one. Itmakes
sense that thepeak age for that taskwould beearlierthantheother tasks. Sincewe
donot havea rigorous measureAge
ofPeak Performance
Standard Error
Home
EquityLoans-APR
55.85 4.24Home
EquityLines-APR 53.30 5.23Credit
Card-APR
50.31 6.02Auto
Loans-APR
49.63 5.03Mortgage-
APR
61.75 7.92Small Business Credit
Card-APR
56.04 8.01 CreditCardLate Fee 51.94 4.87 CreditCard OverLimitFee 53.97 5.02 CreditCardCash AdvanceFee 54.82 4.89Eureka
Moment
45.81 7.93Averageofthe 10 Studies 53.34
Table9;
Age
atwhichfinancialmistakes areminimized,foreachcasestudyofthe "difficulty"ofatask,the interpretation of the Eurekacaseremainsspeculative.
14.2
Formal
Test of
a
Performance
Peak
EffectTable9allows usdoaformal test forapeakeffect. Inregression (2), the nullhypothesis ofa peakeffect is: (i) 6
>
0,and
(ii)Peak
=
—a/
(26) 6 [40,60]. Togetherthese conditions imply thatmistakesfollowaU-shape, withapeakthatisbetween40and60 years ofage.Forcriterion(i),
we
note that theb coefficientsare positiveforall10studies. For9 ofthe 10 studiesbissignificantly differentfromzero (thecreditcardAPR
studyistheexception).-'^ For criterion (ii),Table9shows that apeak inthe 40-60agerangecannotberejectedforalltenstudies.
15
Discussion
and
Related
Work
Age
effects offera unifiedparsimoniousexplanationforour findingsinall ten casestudies. However,our cross-sectional evidencedoesnot definitivelysupportthisinterpretation. In the currentsection,we
reviewsome
possible alternativeexplanations.Some
resultscouldbedrivenby unobservedvariationindefaultrisk. For instance, the U-shapeofAPRs,
couldbeduetoaU-shapeofdefaultbyage.We
test thisalternativehypothesis byregressingdefault rates onagesplines for creditcards, autoloans,andhome
equity loansand
creditlines.We
plot fittedvaluesin Figure 17.None
ofthegraphs isU-shaped.On
the contrary,
home
equity loansandlinesshow
apronouncedinverted-U-shape,implyingthat'*To savespace,weonly report thet—statisticsassociatedwith theb coefficients. FollowingtlieorderofTable
9,theyare:2.20, 4.55, 7.80, 8.77, 17.05, 1.61, 4.57, 2.91, 3.08, 2.67.
Percent DefaultingbyBorrower
Age
8,00%
- -CreditCards ——AutoLoans HE-Loans
™„, HE-Lines ArgentinaMortgage '^'"^^"^-Small Business
700%
-^-
\
6,00%"-'^
"'"'--.,
4,00% «_—.-"
300% u™^ ,.^^---"'-""^' "'"^^^^^^^^^^^^""•^^.^ .^.u-v—«"'""''*''*°*^'" "" '^^^^^^^S^*!r^ 2,00% 1,00%^^
..^-^ 000%^
Borrower
Age
(Years)Figure17: Defaultfrequencyby borrowerage.
The
figureplotsthe residualefi'ectofage, after controllingforotherobservablecharacteristics,suchas incomeand
credit-worthiness.the
young
andoldhave lower defaultrates. Credit cards and autoloansalsoshow
a slight invertedU-shape. Hence, Figure17 contradicts the hypothesis thatour resultsare drivenby anunmeasured
defaultrisk. Also,notethatage-dependent defaultriskcould not explain the observedpatternsincredit cardfeepayments
orsuboptimaluseofbalancetransfers.Some
ageeffectscouldbe generatedbyage-variationintheopportunitycost oftime[Aguiarand
Hurst2005]. However, suchopportunity-costeffectswouldpredictthatretireesmake
fewer mistakes, whichisnotwhat
we
observeinthe data.The
presence ofage effects might also be interpreted as evidence forsome
kind ofage discrimination.We
believe this to be unlikely, for two reasons. First, firms avoid age discriminationfor legalreasons. Penaltiesforage discrimination fromthe FairLending Act are substantial (as would bethe resulting negativepublicity). Second, theU-shaped pattern showsup
in contexts such as feepayments
and misuse ofbalance transfer offers in which discriminationisnot relevant (sinceallcard holdersfacethesame
rules).15.1
Related
Work
Other authorshavestudied theeffectsofagingonthe use offinancial instruments. Ko-rniotisand
Kumar
(2007) examine theperformance ofinvestors froma majorU.S. discount brokeragehouse.They
usecensusdatatoimpute educationlevelsand data fromtheSurveyofHealth, Aging
and
RetirementinEurope
to estimate amodel
ofcognitive abilities.They
findthat investors withcognitive declinesearnannual returnsbetween3-5percentagepoints lower on arisk adjustedbasis. In a related paper,
Zinman
(2006) reports that older adults aremore
likelytoborrowathighinterestratesoncreditcard accounts, while simultaneously holdingliquid assets inlow-interestbank
accounts.Intheir
work on
financial hteracy, Lusardiand
Mitchel findevidence consistent with an inverse-Ushapeoffinancial proficiency. Lusardiand
Mitchell (2006)finda declineinfinancial knowledgeafterage50. Lusardiand
Mitchell (2007)also findaninverseU-shapeinthemastery ofbasicfinancialconcepts, suchastheabilitytocalculatepercentages or simpledivisions.After
some
ofour presentationsother researchershave offered tolook forage patterns of financialmistakesintheirown
datasets. LuciaDunn
has reported to us that theOhio
State Survey on credit cards shows a U-shaped pattern ofcreditcardAPR
terms by age (Dunn, personal communication). Fiona Scott-Morton has reported thatin herdatasetof indirect autoloans (loansmade
by banksand
financecompaniesusing the dealerasanintermediary;see Scott-Mortonetai,2003), loanAPR
termsshow
aU-shapedpattern(Scott-Morton, personal communication).
A
relationship between earningand
performance has been noted inmany
non-financial^ contexts. Survey datasuggests that labor earningspeak aroundage50(GourinchasandParker, 2002) orafterabout30 years of experience(Murphy
and Welch, 1990). Thisisconsistentwith ourhypothesis thateconomic performancedepends on both analyticabilities andexperience. Turning to purely noneconomic domains, thereis aliterature onestimatingperformance peaksinprofessionalathleticsand
other competitiveareas. Fair (1994, 2005a,2005b)estimates theeffectsofage declinesinbaseballand
chess,among
othersports.James
(2003) estimates theage ofpeak performanceinbaseball tobe29.A
burgeoningliterature inpsychology and economicsreportssystematic differencein "ra-tionality" between groupsof people. Benjamin,Brown and
Shapiro(2006) findthat subjects withhighertest scores,orlesscognitiveload,displayfewerbehavioralbiases. Frederick (2005) identifies ameasure of "analytical IQ": people with higher scores oncognitive abilitytasks tend to exhibitfewer/weaker psychologicalbiases. While this literatureis motivated by ex-perimentaldata (whereit iseasier tocontrolfor unobservables),we
rely onfielddatainour paper. Similarly, Massoud, Saunders and Schnolnick (2006) find thatmore
educated peoplemake
fewer mistakesontheir credit cards.A
number
ofresearchers have writtenabout consumercredit card use.Our work most
closely overlaps with that of Agarwal et al. (2005),
who
useanother largerandom
sample ofcredit cardaccounts toshow
that,onaverage, borrowers choosecreditcard contracts that minimize their total interestcosts net offeespaid.About
40percent ofborrowersinitially choosesuboptimal contracts. Whilesome
borrowers incurhundredsofdollars ofsuchcosts,most
borrowers subsequentlyswitch to cost-minimizing contracts.The
resultsofourpapercomplement
those ofAgarwal
et al. (2005), sincewe
find evidence of learning to avoidfeesand
interestcostsgiven a particular card contract.Several researchers havelooked at theresponse ofconsumers to low, introductoi'y credit cardrates ('teaser' rates),
and
atthe persistence of otherwise highinterest rates. Shuiand Ausubel (2004)show
that consumersprefer creditcard contractswith lowinitialrates for a shortperiod oftimetooneswithsomewhat
higher ratesfora longer period of time,evenwhen
thelatter is expost,
more
beneficial.Consumers
alsoappear 'reluctant'to switch contracts. DellaVignaand Malmendier
(2004) theorize thatfinancialinstitutionsset theterms ofcredit cardcontracts toreflectconsumers'poorforecastingabilityovertheirfutureconsumption.Bertrand et al. (2005) find that randomized changes in the "psychological features" of
consumer
credit offers affect adoptionrates asmuch
asvariations inthe interestrateterms. Ausubel(1991) hypothesizes thatconsumersmay
beover-optimistic,repeatedly underestimat-ingthe probability thattheywillborrow,thus possibly explaining thestickinessofcredit card interest rates.Calem and
Mester (1995) use the 1989 SurveyofConsumer
Finances (SCF) to argue that information barriers create high switching costs for high-balance credit card customers, leadingto persistence ofcreditcardinterest rates,and
Calem,Gordy and
Mester (2005) use the 1998and
2001SCFs
toarguethatsuchcosts continue tobeimportant. Kerrand
Dunn
(2002) usedatafromthe 1998SCF
toarguethathavinglargecreditcard balances raisesconsumers' propensity to searchfor lower creditcard interest rates. Kerr andDunn
(2004) use
SCF
datatoarguethatbanksofferbetterlendingtermstoconsumerswho
arealsobank
depositors,and
aboutwhom
thebank
wouldthushavemore
information.Other authors have usedcreditcarddatatoevaluate
more
generalhypotheses about con-sumption. Agarwal, Liuand
Souleles (2004) usecreditcarddatatoexamine
theresponse of consumersto the2001 tax rebates. Grossand
Souleles (2002a) usecreditcarddatatoargue that default rates roseinthemid-1990sduetodeclining default costs, ratherthana deterio-ration in the credit-worthiness of borrowers. Gross andSouleles (2002b) findthat increases incredit limitsand
declinesininterestrates leadtolargeincreasesinconsumer
debt. Ravina (2005) estimates consumption Eulerequations for creditcard holdersand
findsevidence for habit persistence.15.2
Some Open
Questions
forFuture
Resecirch
Our
findingssuggest several directionsforfuture research.First,itwould beuseful tostudyageeffects inother decisiondomains.
We
havepresented a simpleprocedureforthis: (1) identifythe generalshapeofageeffects,asin (1),using controlsand agesplines; (2)estimate a linear-quadraticformtolocalizethepeakofperformance,as in
(2)-(3).
Second,it
may
bepossible todevelopmodelsthat predictthe location ofpeak performance. Thereisagrowing consensusthat analytically intensiveproblemsareassociatedwith youngerpeak
ages-think aboutmathematics(seeSimonton
1988,Galenson2005,andWeinberg and Galenson 2006). Analogously,problemsthat aremore
experientially-relevanthaveolderpeak ages. Forinstance, Jones(2006)findsthatthepeakageforscientistshasdrifted higherinthe twentieth century.More
knowledgenow
needstobeaccumulatedtoreach the cuttingedgeof thefield.In our last case study,
we
found thatwhat
isarguably themost
analyticallydemanding
task- deducing the best
way
to exploit "interest-free" balance transfers-isassociated with theyoungestage ofpeak
performance. Itwould beusefultoknow
ifthisassociationbetween analyticallydemanding
problemsand
young
peakagesisgeneral.Third, it would be useful to identify cost-effective regulations that would help improve financial decisions. Forceddisclosureis notitselfsufficient, since disclosing costsin thefine printwillhavelittleimpact ondistracted
and
boundedlyrationalconsumers.^'^Good
disclo-surerules willneedtobeeffectiveevenforconsumers
who
donot take thetimetoread thefine print orwho
havelimitedfinancialeducation.We
conjecture thateffectiveregulationswould produce comparableand
transparent products.On
the otherhand,such homogenizationhas thedynamic
costthatitmay
createaroadblockto innovation.Fourth, studying cognitive lifecycle patterns should encourage economists to pay
more
attention tothe market for advice. Advice markets
may
not functionefficientlybecause of informationasymmetriesbetweentherecipientsandthe providers ofadvice (Dulleckand Ker-schbamer2006). It isparticularlyimportanttostudythe advicemarketforolderadultswho
are