A 3-D Tomographic Survey of Compound Chondrules in Two Carbonaceous
Chondrites: Acfer 139 and Renazzo
by
Shavonne N. Hylton
Submitted to the Department of Earth, Atmospheric, and Planetary Sciences in Partial Fulfillment for the Requirements of the Degree of Science in Earth, Atmospheric, and
Planetary Sciences at the Massachusetts Institute of Technology.
May 2005
CA C
Copyright 2005 Shavonne N. Hylton. All rights reserved.
The author hereby grants to M.I.T. permission to reproduce and distribute publicly paper and electronic copies of this thesis and to grant to others the right to do so.
Author
Department of Earth, Atmospheric, and Planetary Sciences May 2005 Certified by
Timothy L. Grove
Signature redacted
Thesis SupervisorCertified by
Denton S. Ebel Thesisz q" ervisor
Accepted by
Signature redacted
V
Samuel Bowring Chair, Committee on Undergraduate Program
OF TECHNOLOGY
SEP 2
8 2017
LIBRARIES
The author hreby grants to MIT permision to
reproduce and to distibute publicly paper and
electronic copies of tIs thesig docurment in
whole or in part in any medium now known or
MITLibraries
77 Massachusetts Avenue Cambridge, MA 02139 IILLp:// Ibraries.mit.edu/ask
DISCLAIMER NOTICE
Due to the condition of the original material, there are unavoidable
flaws in this reproduction. We have made every effort possible to
provide you with the best copy available.
Thank you.
This thesis was submitted to the Institute Archives
without all the required signatures.
ABSTRACT
Compound chondrules (CCs) are two or more chondrules fused or mechanically joined together. Studies of compound chondrules have been conducted in order to understand the chondrule formation process, including the environment and precursor materials. Chondrule formation is still not currently understood and much doubt still remains as to whether the chondrule formation process is nebular and/or planetary
However, our evidence suggests that a primary and secondary process are responsible for CCs: (1) semi-molten collisions among individual (I) chondrules (Gooding and Keil,
1981) and (2) Parent-body impacts that cause jostling, fracturing and compaction
(Wasson et al., 1995). By understanding chondrule collisions and impacts we can gain greater knowledge into what was happening during early solar system formation, including mean interparticle distances and velocities (Gooding and Keil, 1981).
This thesis introduces x-ray tomography as a new method of measuring and surveying CCs; and explores the advantages and limitations of this method. A 3-D tomographic study of two CR carbonaceous meteorites, Acfer139 and Renazzo, reveals a higher frequency of compound chondrules in CR chondrites than in ordinary chondrites. Previous two-dimensional studies of compound chondrules are reexamined and two new categories, touching and aggregate compounds, are also introduced. Our reexamination suggests a 9.6% frequency of compound chondrules (excluding the new categories), twice more than the value of 4% found by Gooding and Keil (1981) and almost 4 times the value of 2.4% found by Wasson et al. (1995) in their studies of ordinary chondrites. The implications of a higher compound chondrule frequency on chondrule formation are
ACKNOWLEDGEMENTS
There are many people that have made this thesis possible. First and foremost, I would like to thank my thesis advisors Denton S. Ebel and Timothy L. Grove for their support, time and patience. Without them this thesis would not be possible. I thank Sara Baughman for her energy, her intelligence, and general presence throughout this whole process. To Richard P. Binzel, your continuous voice of encouragement and words of wisdom were greatly appreciated. I would also like to thank my family and friends for their support and understanding during such a time-consuming undertaking.
CONTENTS 1. Introduction
1.1. Chondrules and Chondrites 1.2. Models of Chondrule formation 2. Previous Work
3. Methods
3.1. X-ray tomography 3.2. Thick Section Analysis 3.3. Thin Section Analysis 3.4. Classification of Chondrules
3.4.1. Chondrule Identification 3.4.2. Compound Chondrules
3.5. Exclusion of Touching and Aggregate Compounds 4. Models of Compound Chondrule Formation
4.1. Penetrating and Enveloping Compounds 4.2. Touching and Aggregate Compounds
5. Conclusion 6. References 5 5 6 7 8 8 9 11 13 13 14 15 17 17 17 18 19
1. INTRODUCTION
1.1. Chondrules and Chondrites
Chondrules, which make up the bulk of meteoritic material, are small, spherical iron-magnesium silicate and/or iron-metal aggregates that are thought to be among the earliest formed solids in the solar system. Textural clues imply that chondrules were once molten droplets, which in turn led to the accretion of the inner planets. There are three main types of chondrule bearing meteorites (chondrites): ordinary (OCs, most common and mostly comprised of olivine and orthopyroxene.), enstatite (ECs, rarest and mostly iron-free pyroxene), and carbonaceous chondrites (CBCs, rare and mostly composed of olivine, serpentine, and carbon). Each category is subdivided into: H, L, and LL (OCs) based on their Fe percentage and metal content; EH and EL (ECs) based on their total Fe percentage; CI (Ivuna), CM (Murray), CV (Vigarano), CO (Ornans), CR (Renazzo), CK (Karoonda), and CH (High metal) (CBCs) based on different meteorite types.
The focus of this study was the CR (Renazzo-like) carbonaceous chondrites. According to Wiesberg (1992), the characteristics include: (1) large, multilayered, iron-nickel rich chondrules, (2) abundant matrix and dark inclusions, (3) serpentine- and chlorite-rich phyllosilicates and Ca-carbonates, (4) calcium-carbonate chondrule rims, (5) abundant iron, nickel metal, (6) rare refractory inclusions, (7) amoeboid olivine
aggregates. In addition, CRs have (8) unique oxygen isotope compositions. For our study, features (1), (2), and (4) turned out to be very useful for identifying chondrules in our tomography data.
1.2. Models of Chondrule Formation.
The understanding of chondrule formation has eluded many. Currently no chondrule formation model is universally accepted because they all have aspects that make them a plausible model and aspects that preclude them from being a plausible model. With that said, three likely candidates for chondrule formation include (Boss,
1996):
(1) Lightning in the solar nebula: Large dustballs collide with smaller dust grains
as they fall into the center of the nebula. This creates a large charge separation that induces lightning, which, in turn melts the dustballs. The drawbacks of this model include uncertainty in the physical feasibility of lightning in the solar nebula and short heating time scales.
(2) Shock waves in the solar nebula: Shock waves (front of hot, compressed gas) melt chondrules. Behind the shock wave, pressure density and temperature increase. Particles are heated through friction with the post-shock gas.
Drawbacks of this model include short heating pulses and uncertainty around the method of shock production.
(3) X-winds associated with the young sun: Chondrules are heated by solar flares. Interactions between the nebular disk and the young sun produce X-winds that are actually observed. Material is then launched from the disk by the x-winds and melted by the sun. Drawbacks to the x-wind model include cooling rates that are too slow for chondrule formation and incapacity to explain multiple heating events.
2. PREVIOUS WORK
To date, there are only four extensive studies of compound chondrules- Gooding (1979), Lux et al. (1981), Gooding and Keil (1981), and Wasson et al. (1995), all of which were exclusively carried out using ordinary chondrites. Gooding (1979) separated 216 whole chondrules from type-3 and type-4, the least altered, ordinary chondrites and found that 4% of the chondrules were compound. Lux et al. (1981) analyzed 32 chondrules and determined that approximately 81% had similar textures and
compositions. Gooding and Keil (1981) examined over 1600 chondrules and found that 1.4% of these were compound. Wasson et al. (1995) found eighty-three compound chondrules in his study of seventy-nine ordinary chondrite thin sections and found a value in accordance with Gooding and Keil of 1.4%. Incidentally, Wasson et al. (1995) suggested that further studies are warranted of "tiny adhesions [which] demonstrate that tiny like bodies of melt (i.e. microchondrules) were produced in the chondrule-forming process". These "microchondrules" were examined further using x-ray
tomography and found to be an important addition to compound chondrule types. Extensive studies of compound chondrule have been primarily limited to two-dimensional thin sections. However, this reliable method precludes accuracy with regard to frequency and type. Given that the frequency of occurrence and the types of
chondrules are important in various chondrule and early solar system formation models, it is important to get a better constraint on parameters such as diameter, frequency of occurrence, and textural classes. Three-dimensional tomographic analysis has proved to be a better tool for accurate measurements of these parameters.
3. METHODS
3.1. X-Ray Tomography (XRT)
X-ray tomographic images of two CR chondrite samples (Figure 1), Acfer139 (two 3 x 4 x 19 mm pieces) and Renazzo (two 5 x 6.5 x 11.5 mm pieces), were obtained using the Advanced Photon Source synchrotron radiation facility at the Argonne National Laboratory in Illinois. These images where supplied by Denton Ebel, a curator of
meteorites at the American Museum of Natural History in New York.
Figure 1: CR chondrite samples Acfer]39-1 and Renazzo, respectively.
An XRT image is obtained by placing the sample in a synchrotron x-ray source beam while the sample is rotated through 180 degrees in 0.25-degree increments. Meanwhile, a photosensitive CCD camera detects the x-rays over a 16-bit range that corresponds to 65536 gray values (Figure 2). The image is similar to a CAT scan. The
CCD magnifying sample monochromatic
lens scintillator >20 KeV x-ray
camera
scintillator: phosphor emitting sample is rotated visible light when struck by x-rays through half circle
Figure 2: Schematic of a sample placed in the beam of a synchrotron x-ray source.
brightness correlates strongly with the mass density variation in the meteorite; the brightest objects are the densest (i.e. metals), and the darker objects are the least dense (i.e. chondrules). The gray area that comprises most of the image is called the matrix, which consists of very small mineral grains and fragments.
A Fast Fourier Transform algorithm is applied to reconstruct the density model of the sample. The result is a datafile that contains a 3-dimensional array of volume
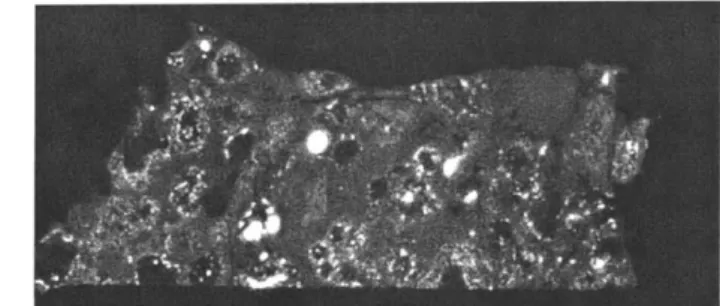
elements (voxels), each of which has a unique value that resembles the x-ray attenuation by that voxel. The resulting datafile is then converted into stacks of tiff images correlated to the x, y, and z directions (Figure 3) using IDL, visual data-analysis software.
Figure 3: Tomographic image 300 out of 486 of Renazzo
sample in the y-z-direction.
During tomographic sample preparation, the Acfer139 samples were cut adjacent to each other, while the Renazzo sample was not due to its irregular shape. The thick sections where cut prior to tomographic analysis in order to expose the maximum 3-D the surface area while remaining within the size restrictions of the synchrotron source.
3.2 Thick Section Analysis
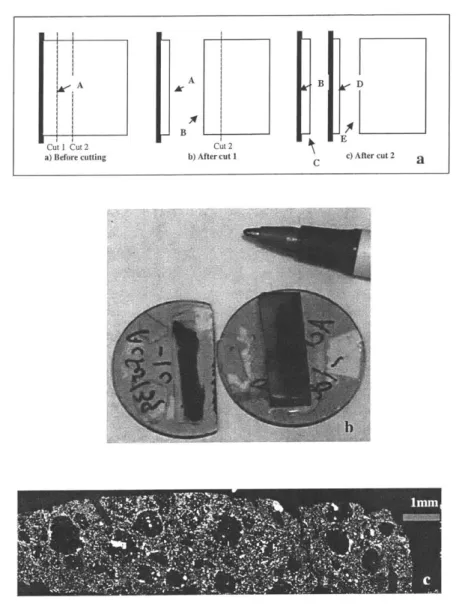
Following tomographic analysis, each sample was mounted on a glass slide and cut into multiple slices (Figure 4a-b) using a 30-micron precision wire saw, which was
coated with boron carbide in an oil slurry. Each slice was then diamond polished to eliminate contamination. In total, four thick sections of Renazzo and five thick sections of Acferl39 were prepared approximately 0.5 mm thick. After preparation, each slice was analyzed using a 2-D technique with the Cameca SX-100 electron microprobe at the American Museum of Natural History (AMNH). Back-scattered electron (BSE) images were created at a resolution of 4 pm/px (5 jtm/px for Acfer139-1B) using a current of 20
nA and high voltage of 20 kV (Figure 4b). Unlike XRT images, BSE images only
provide 2-D analysis. However, they allow one to see textures and impact "breaks" or fractures within and around the chondrules.
Thick sections were created, analyzed and compared with 3-D analyzed tomographic images. BSE maps of these sections were used to locate chondrules and identify which ones were CCs. The corresponding tomographic images were then located in the stack of tiff images. In each case, the frequency of CCs was significantly lower in the BSE images than in the tomographic images and in accordance with Gooding and Keil's (1981) CC occurrence of 1.4%. Digital images were also taken of the thick section samples and analyzed in the same manner as the BSE images. The CC frequency
Figure 4: a) Sample thick section cutting method. Capital letters represent order of cutting and analysis. b) Carbon-coated polished thick sections of Acfer139-B and -C, on the left and right respectively. c) Back-scatted electron (BSE) image of Acfer139-2A.
3.3 Thin Section Analysis
To date, studies of compound chondrules have primarily been limited to two-dimensional thin sections. In 1981, Gooding and Keil examined over 1600 chondrules in thin sections and 216 whole chondrules removed from bulk meteorite samples. They found the frequency of compound chondrules to be 4%, based on an observed frequency
A A B g
B
Cut I Cut 2 Cut 2
of 1.3%, multiplied by a factor of 3. This factor was used to correct for thin section bias, and was obtained by dividing the percent of whole compound chondrules found by the percent found in thin sections. In 1995, Wasson et al. surveyed over 10,000 chondrules in thin sections and found only 2.4% of their chondrules to be compound. This value was also obtained by multiplying the observed frequency by a correction factor of 3. It is assumed that the reason for this disparity lies in the fact that Wasson et al. (1995) included only whole chondrules in his calculation, and did not include chondrules less than 40 microns in diameter. Gooding and Keil (1981) included broken chondrules if they met the criteria for (1) being a chondrule and (2) had a boundary of more than 180
degrees of continuous arc (i.e. more than half of the chondrule was visible). In the 3-D tomographic data, our limiting size was 100 microns. Chondrules that were cut off, regardless of the degree of continuous arc, were not included in our study. Table 1 compares the result of two different chondrule studies. Wasson's study of chondrules is
the most extensive to date and is the source of the accepted value for compound frequency.
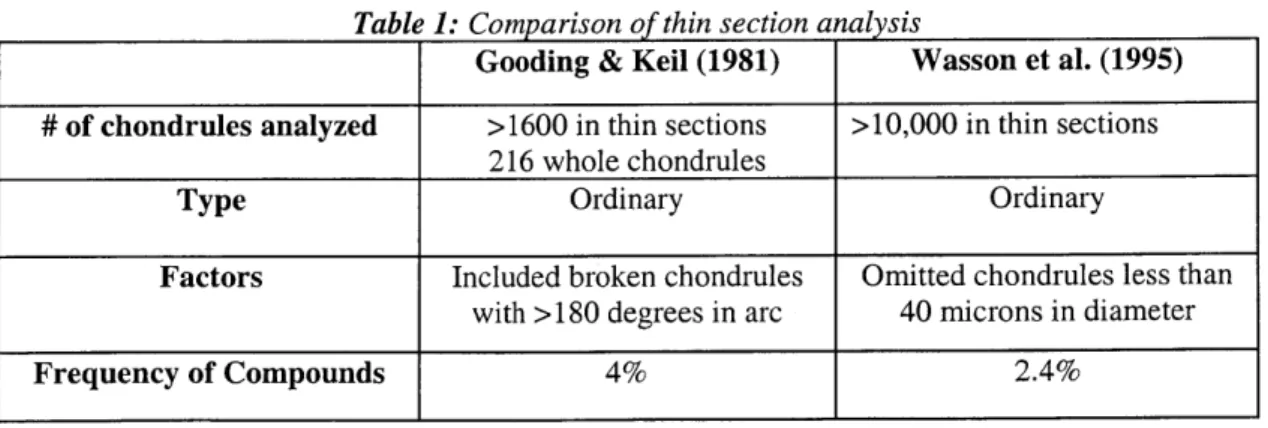
Table 1: Comparison of thin section analysis
Gooding & Keil (1981) Wasson et al. (1995) # of chondrules analyzed >1600 in thin sections >10,000 in thin sections
216 whole chondrules
Type Ordinary Ordinary
Factors Included broken chondrules Omitted chondrules less than
with >180 degrees in arc 40 microns in diameter
3.4
Classification of Chondrules
3.4.1 Chondrule Identification
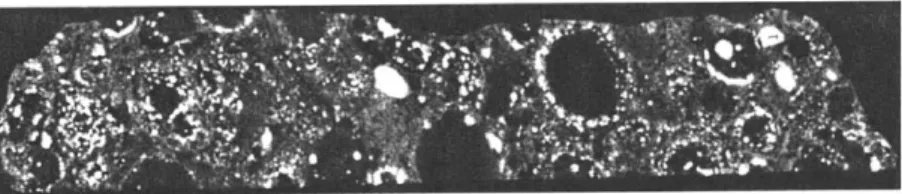
We worked with a stack of 8-bit tiff images normal to a particular axis of the tomography volume. In other words, we scanned though the third dimension and viewed the chondrite sample in 2-D. Each chondrule was assigned a number based on the order in which it was found and labeled on every tenth image (Figure 5). We used the program ImageJ for this work (http://rsb.info.nih.gov/ii/). We catalogued the chondrules in the 3D
tomographic images for both sections of Acferl39 and both sections of Renazzo. Then, we developed the criteria for identifying chondrules in the images: (1) continuity of chondrule in two or more consecutive. 2-D images, (2) a change in size over the two or more 2-D images, and (3) the presence of a distinct boundary between the dark chondrule interior and the background matrix. The reason for the first two criteria comes from the fact that there are minor flaws in the tomographic method. These lead to artefacts in the image, which don't change in size as we look through the 2-D slices and fail to appear in two or more consecutive images. Criterion # 3 was necessary because clear visibility was
necessary for classification. Finally, we did not include any chondrules that were partially
cut off in any image.
Figure 5: Example of labeled tomography slice
After identifying the chondrules, in ImageJ, an ellipse was visually fit to them where the chondrule appeared to have the largest area. From this fit we extracted the center of the
ellipse, its area, major and minor axes, and the angle between the major axis and the
horizontal. For compound chondrules, we fit an ellipse to each component, if possible.
For aggregate compound chondrules having more than four parts, we fit an ellipse to the
entire aggregate.
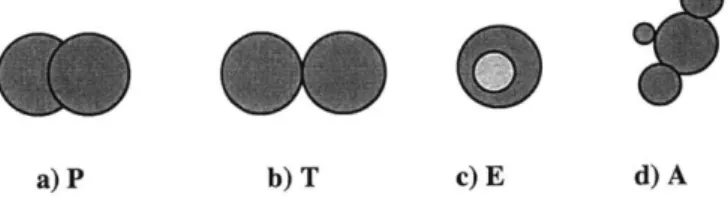
3.4.2 Compound Chondrules (CCs)
The chondrules were separated into two main categories, individual (I) and
compound. Individual chondrules are single chondrules that are not joined to any other
chondrules nor compound with a chondrule that is cut off and therefore not included in
our survey. Compound chondrules were then further divided into 4
subcategories-penetrating (P), touching (T), enveloping (E), and aggregates (A) (Figure 6).
a) P b) T c) E d) A
Figure 6: Compound types: a) Penetrating (P), b) Touching (T), c) Enveloping (E), d) Aggregates (A)
The latter two subcategories, penetrating and enveloping, are classified according to the
published definition of Wasson et al. (1995). In this definition, penetrating compound
chondrules consist of two or three chondrules joined together, where and one chondrule
retains its original shape and the other conforms to the shape of the primary chondrule.
Enveloping chondrules consist of one chondrule that is completely enclosed inside the
other. However, Wasson et al. (1995) also divided penetrating compounds into 2
categories- adhering and consorting compounds. The two categories differ in that
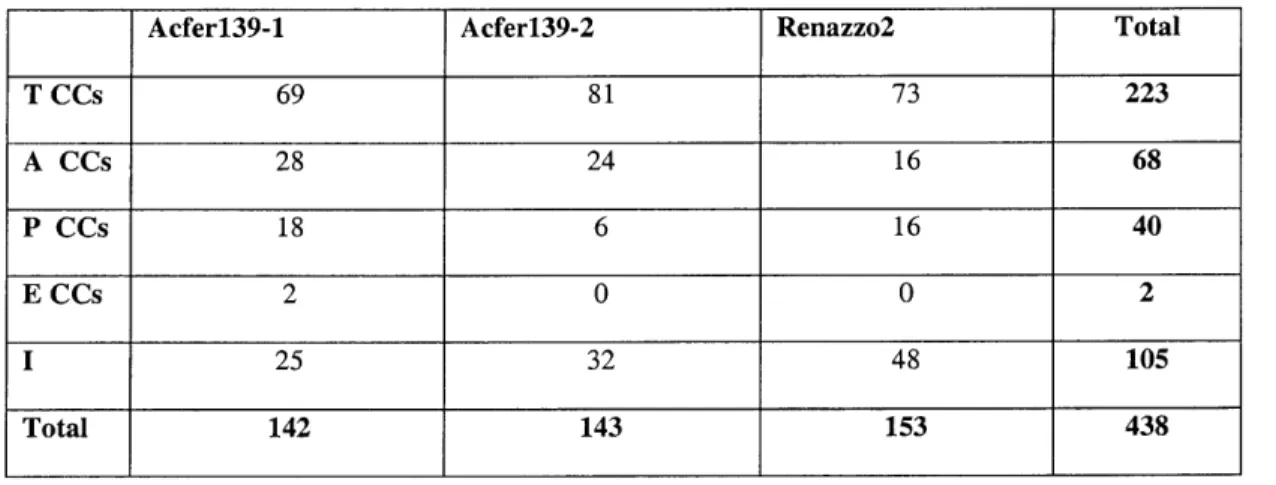
consorting CCs consist of penetrating chondrules that are of similar size, while adhering CCs differ widely in size. In our tomography data, and in polished thick sections, we failed to find any instances of adhering CCs. Touching (50.9 % of all chondrules) and aggregate (15.5% of all chondrules) CCs are new categories created after finding an overwhelming number of examples in our tomography data. Touching CCs consist of two or three chondrules mechanically joined together where each chondrule still appears to retain its original shape. Aggregate CCs are deviants from touching CCs that consist of 4 or more chondrules mechanically joined together. Table 2 below shows the distribution of compound chondrule types in our tomography data.
Table 2: Distribution of chondrule categories.
Acfer139-1 Acfer139-2 Renazzo2 Total
TCCs 69 81 73 223 A CCs 28 24 16 68 P CCs 18 6 16 40 ECCs 2 0 0 2 I 25 32 48 105 Total 142 143 153 438
3.5. Exclusion of Touching and Aggregate Compounds
We feel that there are several reasons that these types of compound chondrules have been left out of previous studies. Gooding and Keil (1981) were primarily
concerned with chondrule types, and placed minimal focus on compound chondrules. It does appear though, that their definition was broad enough to include touching CCs,
since they define CCs as those with attached or partially embedded chondrules. We assume this lower frequency of compounds to be a characteristic of ordinary chondrites. On the other hand, the exclusion of touching and aggregate CCs by Wasson et al. (1995) is very clear. Their criteria for CC identification are: (1) continuity of the shared border,
(2) preservation of a circular arc on the primary chondrule, and (3) evidence that material was added subsequent to compound chondrule formation. Criterion (2) immediately excludes touching and aggregate CCs given that most of the points of contact are not circular arcs and most are flattened. Criterion (3) was added later after Wasson et al. (1995) believed they found instances of "ghost rims" or chondrules that appeared to be compound but were interpreted as remelted without the addition of mass. One section in Wasson et al.'s paper is of particular interest, however. Entitled Distinguishing
Compound Chondrules from Independent Chondrules which Share Congruent Surfaces, this section mentions what we have identified as touching compounds. In this
section, he also mentions findings by Holmen and Wood (1986) where they found cases of indenting (penetrating) chondrules separated by matrix. Though Wasson et al. (1995) did not find any examples of these types of penetrating chondrules, we found this to be the case more than 50% of the time in our tomography data. The omission of touching and aggregate CCs by Wasson et al. (1995) can also be explained by their assumption that chondrules were formed in the solar nebula by flash heating of chondrule precursors (shock model). An assumption regarding thee method of chondrule formation disqualify our new cateogories from being considered compound chondrules.
4. MODELS OF COMPOUND CHONDRULE FORMATION
4.1. Penetrating and Enveloping Compounds
Gooding and Keil (1981) presented what is now considered the more popular view of compound chondrule formation. In their model, individual chondrules collided while at least one of the chondrules was still molten. Wassson et al. (1995) felt that the Gooding and Keil (1981) random collision model was implausible and proposed a "relic-chondrule" model that calls for the primary, or rigid, chondrule to be part of a porous aggregate that was then flash heated to form the secondary, or conformed, chondrule. The latter seems plausible since we found quite a few aggregates (15.5%) throughout our tomography data.
Another possibility consistent with accepted theories of compound chondrule formation is that of hot accretion suggested by Holmen and Wood (1986). According to their interpretation of penetrating CCs with different textural and chemical compositions and separated by matrix, some important conclusions can be drawn:
(1) Accretion began immediately after thermal processing
(2) Matrix and chondrules were a product of the same thermal event.
Though our data is limited to physical interpretation, we did find several instances of penetrating chondrules separated by matrix material that enveloped the chondrule interface. Given the high frequency of matrix between the CC interface (> 50%), conclusions (1) and (2) imply that the primary mechanism for chondrule formation is a nebular process.
4.2. Touching and Aggregate Compounds
The new categories, touching and aggregates, garnered the most interest because they could not be explained by previous theories that were used to account for
interpenetrating compound chondrules. We interpreted the physical evidence to correlate to two possible processes, parent body and nebular, and came up with two very different but equally plausible processes that would be able to produce these types of compounds.
(1) Impacts onto parent body regolith caused compaction and flattening that
sorted and mechanically joined the chondrules together. The jostling and fracturing during parent body compaction allowed some chondrules to fit together like jigsaw puzzle pieces (Wasson et al. 1995).
(2) Semi-molten objects are colliding in space and are mechanically joining together.
The existence of these types of compounds warrants future study due to its evidence for secondary parent-body processes. Confirmation can be seen in BSE and Scanning Electron Microscope (SEM) images, where adjacent chondrules are clearly separated by matrix material and distance yet appear to be two connecting pieces of a jigsaw puzzle. Touching and aggregate CCs look as if they have initially undergone
process (2) then, secondarily,. process (1). Nebular and parent-body processes must be considered in conjunction when considering the models of compound chondrule formation due to the strong evidence that suggests both happen in succession.
5. CONCLUSIONS
Based on a 3-D tomographic study of chondrules in CR chondrites, the following conclusions are made:
(1) Compound chondrules occur more frequently in CR chondrites than in
(2) Compound chondrule study, including textural, thin section, and chemical analysis, should be expanded to include touching and aggregate compounds.
(3) Compound chondrules constitute more than 9.6% of all chondrules in the
traditional sense and comprise more than 75% of all chondrules with the addition of the new categories in CR chondrites.
(4) The high frequency of these new compound categories suggests additional processes may be involved in the compound chondrule formation.
REFERENCES
Boss A.P. (1996) A concise guide to chondrule formation models. In Chondrules and the
Protoplanetary Disk (eds. R.H.Hewins, R.H. Jones, and E.R.D. Scott), pp
257-263. Cambridge University Press.
Ciesla F. J., Lauretta D. S., and Hood L. L. (2004) The frequency of compound
chondrules and implications for chondrule formation. Meteorit. Planet. Sci. 39, 5
531-544.
Desch S. J. and Connolly H. C., Jr. (2002) A model of the thermal processing of particles in solar nebula shocks: Application to the cooling rates of chondrules.
Meteorit. Planet. Sci. 37, 183-207.
Ebel D. S. and Grossman L. (2000) Condensation in dust-enriched systems. Geochim.
Cosmochim. Acta 64, 339-366.
Eisenhour D.D. (1996) Determining chondrule size distributions from thin-section measurements. Meteoritics & Planetary Science 31, 243-248.
Gooding J.L. (1979) Petrogenetic properties of chondrules in unequilibrated H-,L-, and LL-group chondritic meteorites. Ph.D dissertation,Univ. New Mexico.
Gooding J. L. and Keil K. (1981) Relative abundances of chondrule primary textural types in ordinary chondrites and their bearing on conditions of chondrule formation. Meteoritics 16, 17-43.
Chondrules and the Protplanetary Disk. (eds. R.H. Hewins, R.H. Jones, and
E.R.D Scott) pp 3-9. Cambridge University Press.
Hewins, R.H. (1997). Chondrules. Annu. Rev. Earth Planet. Sci. 25, 61-83.
Hewins, R.H. and Fox, G.E. (2004). Chondrule textures and precursor grain size: an experimental study. Geochimica et Cosmochimica Acta. 68, 917-926.
Holmen B. A. and Wood J. A. (1986) Chondrules that indent one another: Evidence for hot accretion? Meteoritical Society 21, 399.
Joung M. K. R., Mac Low M.M., and Ebel D. S. (2004) Chondrule formation and protoplanetary disk heating by current sheets in nonideal
magnetohydrodynamic turbulence. Astrophys. J. 606, 532-541.
Kuebler K. E., MacSween H. Y., Jr., Carlson W. D, and Hirsch D. (1999) Sizes and masses of Chondrules and Metal-Troilite Grains in Ordinary Chondrites: Possible Implications for Nebular Sorting. Icarus 141, 96-106.
Lux G., Keil K., and Taylor G.JJ. (1981) Chondrules in H3 chondrites: textures, compositions,and origins. Geocihm.Cosmochim. Acta 45. 675-685.
Maerz, N.H. (1996) Reconstructing 3-D block size distributions from 2-D measurements on sections. Proceedings of the FRAGBLAST 5 workshop on measurements of
blast fragmentation, Montreal, Quebec, Canada, 23-24 Aug. 196, 39-43.
Scott, E.R.D (2002) Meteorite Evidence for the accretion and collisional evolution of evolution of asteroids. In Asteroids III. (eds. W.F. Bottke, A. Cellino, P. Paolicchi, and R.P. Binzel), pp 697-709. University of Arizona Press. Sekiya M. and Nakamura T. (1996) Condition for the formation of the compound
chondrules in the solar nebula. Proc. NIPR Symp. Anarct. Meteorites. 9, 208-217. Shukolyukov A. and Lugmair G.W. (2002) Chronology of asteroid accretion and
differentiation. In Asteroids III. (eds. W.F. Bottke, A. Cellino, P. Paolicchi, and R.P. Binzel), pp 687-695. University of Arizona Press.
Wasson J. T., Krot A. N., Min S. L., and Rubin A. E. (1995) Compound chondrules.
Geochim. Cosmochim. Acta 59, 1847-1869.
Weisberg M. K., Prinz M., Clayton R. N., and Mayeda T.K. (1993) The CR (Renazzo
type) carbonaceous chondrite group and its implications. Geochim.
![Figure 1: CR chondrite samples Acfer]39-1 and Renazzo, respectively.](https://thumb-eu.123doks.com/thumbv2/123doknet/13799125.440958/9.917.155.751.439.646/figure-cr-chondrite-samples-acfer-renazzo-respectively.webp)