HAL Id: hal-02518053
https://hal.archives-ouvertes.fr/hal-02518053
Submitted on 24 Mar 2020HAL is a multi-disciplinary open access
archive for the deposit and dissemination of sci-entific research documents, whether they are pub-lished or not. The documents may come from teaching and research institutions in France or abroad, or from public or private research centers.
L’archive ouverte pluridisciplinaire HAL, est destinée au dépôt et à la diffusion de documents scientifiques de niveau recherche, publiés ou non, émanant des établissements d’enseignement et de recherche français ou étrangers, des laboratoires publics ou privés.
Active substrates improving sensitivity in biomedical
fluorescence microscopy
Eric Le Moal, Sandrine Lévêque-Fort, Emmanuel Fort, J.-P. Lacharme, M.-P.
Fontaine-Aupart, C. Ricolleau
To cite this version:
Eric Le Moal, Sandrine Lévêque-Fort, Emmanuel Fort, J.-P. Lacharme, M.-P. Fontaine-Aupart, et al.. Active substrates improving sensitivity in biomedical fluorescence microscopy. European Conference on Biomedical Optics 2005, Jun 2005, Munich, Germany. pp.58600G, �10.1117/12.632945�. �hal-02518053�
Active substrates improving sensitivity
in biomedical fluorescence microscopy
E. Le Moal
a,b, S. Lévêque-Fort
b, E. Fort
*a, J.-P. Lacharme
a, M.-P. Fontaine-Aupart
b, C. Ricolleau
ba
NanoPlasmonic and Nanostructured Materials group
Laboratoire Matériaux et Phénomènes Quantiques (Paris7)
Laboratoire Physique du Solide (ESPCI, Paris)
b
Photobiology and Biophotonic group
Laboratoire PhotoPhysique Moléculaire (CNRS, Orsay)
ABSTRACT
Fluorescence is widely used as a spectroscopic tool or for biomedical imaging, in particular for DNA chips. In some cases, detection of very low molecular concentrations and precise localization of biomarkers are limited by the weakness of the fluorescence signal. We present a new method based on sample substrates that improve fluorescence detection sensitivity. These active substrates consist in glass slides covered with metal (gold or silver) and dielectric (alumina) films and can directly be used with common microscope set-up. Fluorescence enhancement affects both excitation and decay rates and is strongly dependant on the distance to the metal surface. Furthermore, fluorescence collection is improved since fluorophore emission lobes are advantageously modified close to a reflective surface. Finally, additional improvements are achieved by structuring the metallic layer. Substrates morphology was mapped by Atomic Force Microscopy (AFM). Substrates optical properties were studied using mono- and bi-photonic fluorescence microscopy with time resolution. An original set-up was implemented for spatial radiation pattern’s measurement. Detection improvement was then tested on commercial devices. Several biomedical applications are presented. Enhancement by two orders of magnitude are achieved for DNA chips and signal-to-noise ratio is greatly increased for cells imaging.
Keywords : Fluorescence enhancement, Surface Plasmon Polariton, nanostructured substrate, DNA chip, biomedical
fluorescence imaging
1. INTRODUCTION
Fluorescence is a powerful and widely used technique in biological studies. It has been successfully used as a diagnostic tool for tissue analysis or to provide an easy and quick read out method. One of the main limitations in most of the recent studies and applications comes from the need to detect very low molecular concentrations, with the extreme case of single molecule detection. Another current trend in biological issues is the need for a precise localization of the bio-markers, in particular for diffusion studies for which it is necessary to accurately trace the active molecules. In DNA chips applications, both aspects are important:
1. precise localization is needed to increase the signal to noise ratio (for instance to discriminate between the hybridized and the unwashed DNA strands) or for high-density DNA chips;
2. detection of very low concentrations: for instance in medical applications for which the quantity is limited by the biopsy. We present here an innovating method which enhances fluorescence emission while allowing one to keep commonly used detection set-up. This new approach is based on sample substrates developped from commonly used glass slides covered with metal and dielectric films. Emitted light intensity can be greatly increased just by replacing the usual microscope glass-slide by an active substrate.1
The vicinity of a metallic interface is known to modify significantly the fluorophores emission properties. It is possible to tailor the fluorescence emission of a fluorophore by modifying its local environment. The resulting intensity change is both due to the changes of the desexcitation (radiative and non radiative) rates and the modification of the emission lobe. Surface plasmon (SP) plays a crucial role in the interaction between fluorophore and interface since evanescent components of the emitter local field can couple to SP modes. Spatial extensions of this coupling being of the order of a few nanometers, fluorescence can be engineered down to the nanometer scale. We investigated fluorescence enhancement by confocal and multiphotonic fluorescence microscopy with time resolution. By controlling the separation between the fluorophore and the metallic interface, enhancement of two orders of magnitude can be achieved using standard epi-fluorescence optical geometries. We present results obtained with DNA chips microarrays and with fluorescently labeled cells. In addition, we have experimented an alternative configuration in which fluorescence is collected using a optical fiber spinning around the sample, thereby providing a picture of the emission lobes. We have applied this technique to study how a metallic surface modifies the spatial emission pattern of a fluorophore.
2. PRINCIPLES OF FLUORESCENCE ENHANCEMENT
2.1 Basics on fluorescence
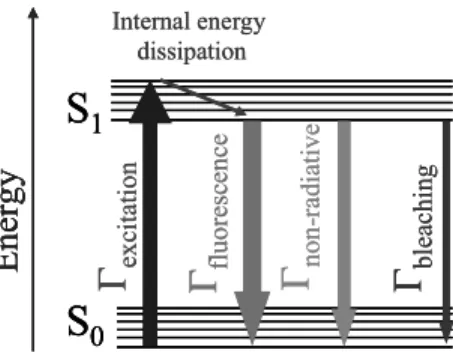
Fluorescence is emission of light from singlet excited states. Return to the ground state is spin-allowed and occurs by emission of a photon, with typical emission rates of 108 s-1 to 1011 s-1. It may also involve non-radiative processes that are generally faster. The addition of new decay ways shorten the fluorophore lifetime i.e. the average time between its excitation and its return to the ground state. Transitions processes are illustrated by a simplified Jabłoński diagram. The singlet ground and first electronic states are depicted by S0 and S1, respectively (Fig. 1). At each of these electronic energy levels the fluorophores can exist in a number of vibrational energy levels. Upon excitation into higher electronic and vibrational levels, the excess energy is quickly dissipated, leaving the fluorophore in the lowest vibrational level of S1. Because of this rapid relaxation (>1012 s-1), emission spectra is usually independent of the excitation wavelength.2 The fluorophore is set in the excited state after absorption of a photon or after a non-linear process involving the absorption of several photons of lower energy. Multiphotonic excitation requires strong electromagnetic field density and short pulses. The fluorophore can also be excited by resonant energy transfer, from an excited molecule for instance.
After a certain number of excitation/emission cycles, the fluorophore may be irreversibly decomposed, which process is called photobleaching.
Ener
gy
S
0S
1Γ
flu oresc en ce Internal energy dissipationΓ
ex cita tionΓ
bl eachingΓ
non -r ad iativeEner
gy
S
0S
1Ener
gy
S
0S
1Γ
flu oresc en ce Internal energy dissipationΓ
ex cita tionΓ
bl eachingΓ
non -r ad iativeFigure 1: Simplified Jabłoński diagram
Fluorescence is a spontaneous emission process and thus an archetypal quantum-mechanical process. Nothing can be said on the occurence of a particular fluorescence emission event but one can establish a probability of decay for an ensemble of emitters. The probability of spontaneous emission is given by the Fermi’s golden rule (equation 1) where Γij is the rate for the
transition between the excited state i and the lower-energy state j; Mij is the matrix element connecting i and j wavefunctions
2
( )
ij
M
ijρ ω
ijΓ ∝
(1)From a quantum-mechanical viewpoint, PMD is associated with the vacuum fluctuations. From a classical viewpoint, PMD describes the ability of the structure surrounding the emitter to support a photon (electromagnetic mode density). Both points of view lead to the same quantitative results. Therefore, the process of spontaneous emission is subject to external influence.3 The decay rate can be controlled, through the PMD, by modifying the boundary conditions of the electromagnetic field. For instance, this can be achieved by setting the emitter in a cavity or close to an interface.
2.2 Dipole oscillator model
In the classical approach, the emitter is considered to be a damped dipole oscillator because of the electric dipole nature of most molecular transitions emitting light ; the damping is due to the radiation process. The dynamic equation of the dipolar momentum p(t) is given in equations 2 and 3, where Γ0 and τ0 = 1/ Γ0 are respectively the decay rate and lifetime in free
space (p and p0 are vectors).
2 2 0 0 2
d
d
0
d
d
p
p
p
t
+ Γ
t
+
ω
=
(2) 0exp(
0) exp(
)
p
=
p
Γ
t
− t
i
ω
(3)The oscillating dipole dynamic may be influenced by the vicinity of an object, for instance a surface, a small particle or the tip of an atomic force microscope. The origin of such a pertubation is the interaction between the electron and a part of its own radiation, reflected by the object. The dynamic equation of the dipolar momentum is now a forced damped oscillator one (equations 4 and 5). Both emission rate and frequency are modified compared to their free space values. These shifts are directly linked to the local field Eloc as shown in their new expressions (equations 6 and 7). Eloc, p and p0 are vectors and Im
and Re stand respectively for the imaginary and real part functions.
2 2 2 0 0 2
d
d
d
d
locp
p
e
p
E
t
+ Γ
t
+
ω
=
m
(4) 0exp( ) exp(
)
p
=
p
Γ
t
− t
i
ω
(5) 2 0 2 0 0m(
loc)
e
p E
m
ω
p
Γ = Γ +
ℑ
⋅
(6) 2 2 0 0 2 0 0 0e(
)
8
2
loce
p E
m
p
ω ω ω
ω
ω
Γ
∆ = −
= −
−
ℜ
⋅
(7)The nature of the disturbing object will be now specified and the effect of a mirror surface presented. The field reflected by the interface interferes with the emitter. Both the amplitude and the phase of the reflected field are to be considered to determine the field at the dipole site. If the reflected field is in phase the PMD at the emitter site will be high, resulting in the dipole being driven hard; consequently the emission will be enhanced. If the reflected field is out of phase, emission will be reduced. As the emitter-to-mirror distance increases, the strength of the oscillation decreases, owing to the point source nature of the dipole emitter.
This is in good agreement with experimental results. Fluorescence measurements have been done on a silver-mirror surface covered with one-tenth-monolayer Rhodamine B film for different metal-dye spacer layer thicknesses. The fluorescence enhancement factor oscillates (Fig. 2) with a period of half the wavelength, as a function of the metal surface distance, alternating super-radiance and sub-radiance conditions.
0 100 200 300 400 500 600 0 10 20 30 Spacerlayer thickness (nm) Enha ncem ent fact o r
Figure 2: Fluorescence enhancement factor as a function of the emitter-to-metal distance
2.3 Fluorophore stabilization
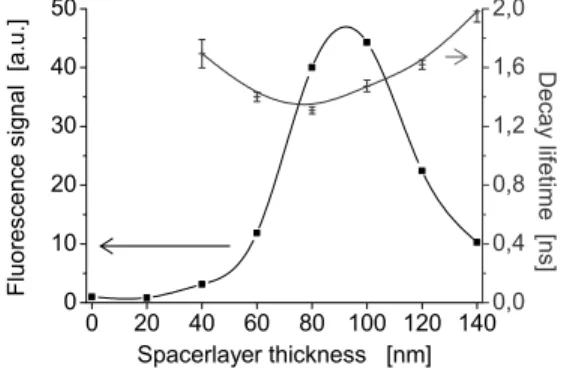
Another advantage of surface enhanced fluorescence is the decrease of the photobleaching yield. Photodestruction mainly occurs when the molecule is in the excited state, since its chemical stability is weaker. The probability of photodestruction thus depends on the time the molecule spends in the excited state i.e. the decay lifetime. Therefore, when the emitter is set at such a proper distance from the mirror, in order to achieve constructive self-interferences, the emission rate is increased resulting in the decay lifetime being reduced and the fluorophore stabilized. Namely, the molecule will achieve a greater number of absorption/emission cycles, emitting a greater number of photons before decomposition. Fig. 3 depicts fluorescence intensity and decay lifetime variations as a function of emitter-to-mirror distance for a one-tenth-monolayer Rhodamine B film under bi-photonic excitation (λexc = 859 nm).
0 20 40 60 80 100 120 140 0 10 20 30 40 50 0,0 0,4 0,8 1,2 1,6 2,0 D e ca y l ife tim e [n s] Fl uo re sc e nc e s ign a l [a .u .] Spacerlayer thickness [nm]
Figure 3: Fluorescence signal and decay lifetime as a function of emitter-to-mirror distance
2.4 Collection improvement
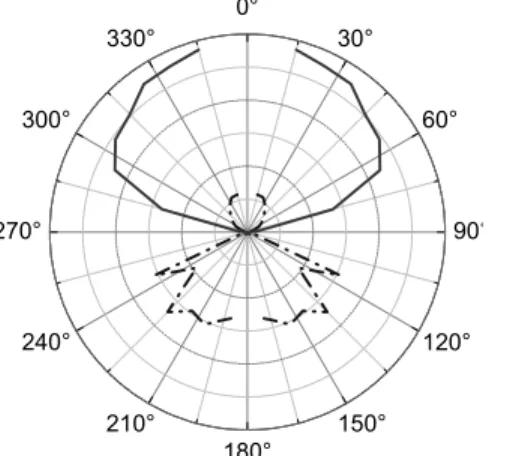
Besides the emission enhancement, another improvement of the fluorescence detection sensitivity is the redirection of emitted light. Fig. 4 is a diagram representing the angular distribution of the fluorescence emission for a fluorophore layer deposited on two different substrates. To acquire these data, the sample (substrate coated with one-tenth monolayer Rhodamine B film) is set at the centre of a rotational stage and lighted by a laser beam (λexc = 532 nm) at normal incidence. The emitted light is collected using an optical fiber spinning around the sample. The signal intensity is plotted as a function of the angle of collection. The upper and lower parts of the diagram respectively correspond to the air-side and the glass-side of the air-glass interface of the substrate (Fig. 5). When the substrate is a common glass slide (dash-dot curve on Fig. 4), an important part of the emitted light is not collected when excitation and collection are achieved at the sample side of the slide.
This is the case in numerous detection set-ups, like commercial devices for biochip read-out. However, the spatial radiation pattern of a dipole is modified close to a metal surface. Replacing the inert substrate by an active one (solid curve on Fig. 4), the emission lobe is redirected in the air-side, allowing the collection of up to about 80% of the emitted light, with high numerical aperture lenses, whereas only about 20% is collectable on standard substrates.
0° 30° 60° 90° 120° 150° 180° 210° 240° 270° 300° 330°
Figure 4: Spatial radiation pattern on inert (– · –) and active substrates (——) Figure 5: Excitation configuration
2.5 Coupling to Surface Plasmons Polaritons (SPPs)
Now we will see how to achieve further enhancement by structuring the metal layer of the active substrate. A short preliminary description of the electromagnetic field radiated by the emitter is necessary.
The dipolar field comprises a propagative part responsible for the energy radiation and an evanescent part that predominates at short distance and is responsible for strong coupling with the surrounding structure. When the molecule is less than about λ/4 from the surface, a strong distance-dependent quenching sets in, involving energy transfer from the excited molecular dipole to the substrate (non-radiative decay processes). The evanescent part of the dipolar field couples to electromagnetic surface modes refered to as Surface Plasmon Polaritons (SPPs). SPPs are associated to electric charges oscillations at the interface between a metal and a dielectric, and are confined to and propagating along this interface (Fig. 6). 4,5
dipole dipole
λlight λSPP λlight λSPP
Figure 6: Dipole and SPPs field lines and associated charges Figure 7: SPP and light wavelengths mismatching
As Fig. 7 illustrates it, SPP wavelength is shorter than the wavelength of light. Consequently, plane wave illumination cannot coherently excite SPPs at a planar interface. Since the reverse is true, SPPs conversion into photons is forbidden too and thus the energy given by the emitter to these non-radiative modes will not contribute to increase the emission of light. However, one can take advantage of this coupling by structuring the metallic thinfilm to further increase the fluorescent signal.
ω
exc.∆k
∆k
∆k
∆k
ω
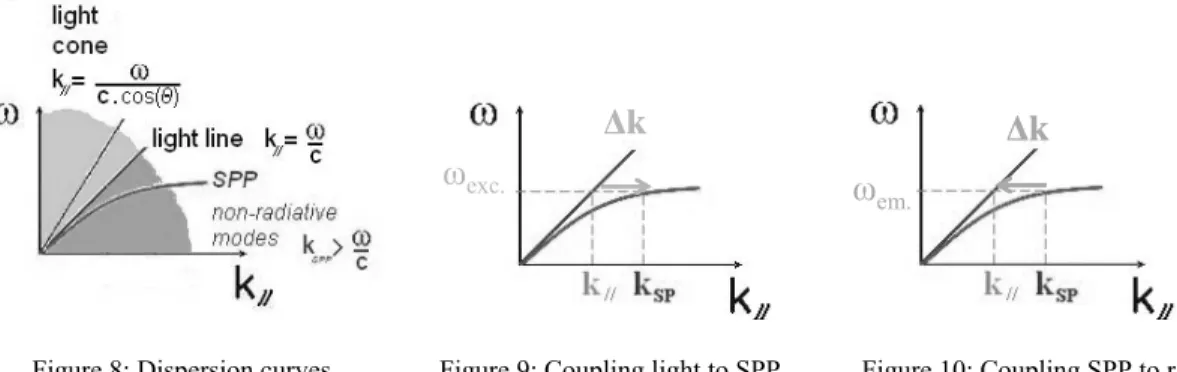
em.Figure 8: Dispersion curves Figure 9: Coupling light to SPP Figure 10: Coupling SPP to radiation
A convenient formalism for the understanding of SPP coupling is the dispersion curve. The dispersion relation gives the propagation speed distribution of the wave associated to an electromagnetic mode, as a function of its frequency. The dispersion curve of a photon in free space is a straight line since, unlike SPPs, the propagation speed of light in free-space is not frequency-dependent. Since SPPs only propagate along the interface, the frequency is relevantly plotted as a function of the wave vector component that is parallel to the interface. For all possible angles of incidence, the light dispersion curve lies at the left of the light line, in the so-called light cone. For light and SPP to couple, their dispersion curves have to cross, which is never the case here since SPP dispersion curve lies at the right of the light line, so outside the light cone (Fig. 8). In other words, the SPP wave vector is larger than the light wave vector parallel component for any given frequency and any angle of incidence.
Figure 11: Topographic image of a rough silver surface (AFM)
2.6 Additional enhancement on nanostructured substrates
There are three main techniques by which the missing momentum can be provided. The first makes use of prism coupling to enhance the momentum of the incident light. The second involves scattering from a topological defect on the surface, such as a subwavelength protrusion or hole, which provides a convenient way to generate SPPs locally. The third makes use of a periodic corrugation in the metal surface.6 We will now explain how corrugation enables SPPs coupling and we will discuss the advantages of a randomly corrugated surface compared to a periodic grating.
When scattered by a metallic grating, the light wave vector can be enlarged by wave vector components whose values are defined by grating periodicity. Therefore, matching of SPP and light wave vectors is not ensured for all frequencies or at all angles of incidence. In particular, for a monoperiodic grating, the matching conditions will be very restrictive. In the aim of providing a nanostrutured substrate that enhance fluorescence for a wide scope of biomedical applications – namely for a wide spectral domain (at least the visible spectra) and at any angle of excitation/collection, we chose randomly corrugated surfaces rather than periodic gratings. Figure 11 is a topographic image, obtained by atomic force microscopy, of a rough silver surface. The Fourier spectra calculated from this image represents the spatial periods distribution of the surface geometry. The Fourier spectra of a monoperiodic grating would exhibit a sharp and unique peak whereas our substrate
spectra presents a bell curve. This wide distribution of Fourier components allows two processes that provides additional enhancement: incident light coupling to SPP at excitation frequency (Fig. 9), which leads to electromagnetic field enhancement close to the surface, due to charge oscillations excitation; recovery of SPP energy by coupling to radiation at emission frequency (Fig. 10).
To summarize, by modifying the field boundary conditions, roughness allows incident light coupling to SPP and SPP coupling to radiation. The validity of this description is limited to small roughness, typically a few nanometers. In the case of greater roughness, one has to take into account multiple scattering of SPPs that leads to plasmon localization. In addition, SPP dispersion curve may be significantly modified. Indeed, periodic structuring of the metal surface can lead to the formation of a surface plasmon photonic bandgap.6 Finally, SPP modes exhibit strong resonances when confined in protrusions whose size is of the order of tens to hundreds of nanometers. Such protrusions presents many similarities with metal nanoparticles that act like antennas when excited at surface plasmon resonance wavelength. SPP modes resonances lead to strong local field enhancements, often referred to as hot spots.
3. EXPERIMENTAL SET-UP
3.1 Sample preparation
The samples are prepared under ultra high vacuum conditions on conventional coverslips or microscope slides. After standard cleaning procedures, a silver or gold deposition is performed by pulsed laser deposition (PLD) technique or by thermal evaporation. The distance between the fluorophores and the metal film is tuned by adding a cover layer of amorphous alumina deposited by PLD technique. The caracteristics of the metallic thin film can be controlled precisely by changing the experimental conditions (substrate temperature, atomic flux,...) from isolated nanoparticles with well defined size and shape to continuous metallic thin film, and from very flat film up to roughened surface with micrometric protrusions. Morphology parameters of the metal layer are calculated from the angular distribution of reflected light intensity and also from atomic force microscope (AFM) images.
3.2 Investigation set-ups
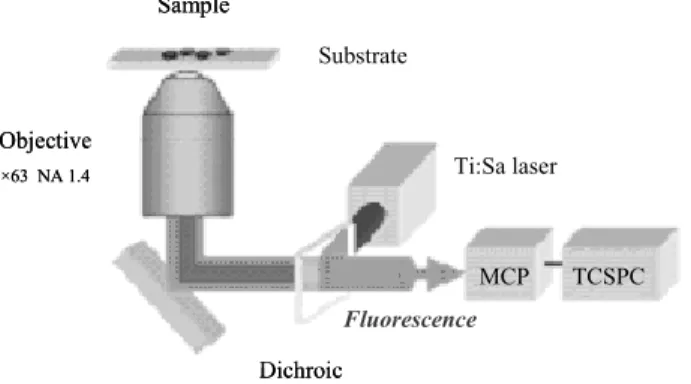
Different set-ups have been used to investigate the applications of these new active substrates ranging from two photon microscope to confocal microscope but also a classical biochip DNA scanner device. Briefly, time-resolved fluorescence measurements are carried out with a conventional two photon microscope (Fig. 12). Our set-up is developed on a inverted microscope (Zeiss axiovert 135). The laser beam from the Ti:Sa laser (100 fs, 76 MHz, attenuated to less than 10 mW) is focussed on the sample through a immersion oil objective (Zeiss x63 NA 1.4). The fluorescence emission is collected by the same objective and transmitted through the dichroic mirror along the emission path. Fluorescence is then detected by a microchannel plate (MCP) associated to a conventional Time Correlated Single Photon Counting system (TCSPC). The temporal resolution of our system is 30ps.
Sample Substrate Objective ×63 NA 1.4 Dichroic Ti:Sa laser MCP TCSPC Fluorescence Sample Substrate Objective ×63 NA 1.4 Dichroic Ti:Sa laser MCP TCSPC Fluorescence
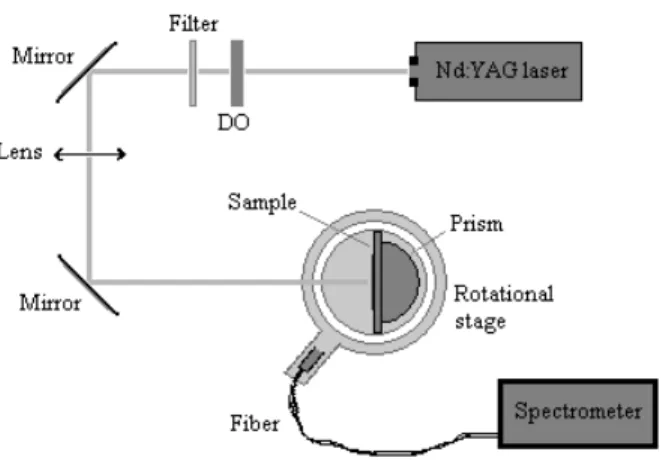
Figure 13: Experimental set-up implemented to study the spatial radiation pattern
For the study devoted to cells imaging, a Leica confocal microscope is used to realize fluorescence image stacks for several excitation wavelengths (488, 514, 532, 633 nm). A commercial biochip scanner device with two different excitation sources (Gre Ne laser at 543nm and He Ne laser at 633 nm) is used for fluorescence imaging on DNA chips.
A experimental set-up was designed to measure the angular distribution of the fluorescence emission (Fig. 13). A optical fiber is carried by an arm spinning around the sample in order to collect the emitted light in all directions. A hemispheric prism is set at the backside of the slide to allow collection of the light emitted into the glass side of the substrate air-glass interface. Sample is lighted by a laser beam at normal incidence. The excitation source is a ADLAS 300 Nd:YAG cw laser whose emission at 532 nm is well adapted to Rhodamine B absorption band. Collected light is acquired using a Hammamatsu spectrometer in order to discriminate fluorescence from scattered excitation light and to study spectrum modifications as the angle of collection changes.
4. BIOMEDICAL APPLICATIONS: RESULTS AND DISCUSSION
Active substrates technology is applied to the fluorescence signal enhancement on DNA chips.
In the past several years, a new technology, called DNA microarray, has attracted tremendous interests among biologists. This technology promises to monitor the whole genome on a single chip so that researchers can have a better picture of the interactions among thousands of genes simultaneously. An array is an orderly arrangement of samples. It provides a medium for matching known and unknown DNA samples based on base-pairing rules and automating the process of identifying the unknowns. Microarrays are generally fabricated on glass slides and require specialized robotics and imaging equipment.7 Complementary binding involves a probe which is the tethered nucleic acid with known sequence and a target which is the free nucleic acid sample whose identity/abundance is being detected.8
There are two major application forms for the DNA microarray technology: 1. identification of sequence (gene / gene mutation);9
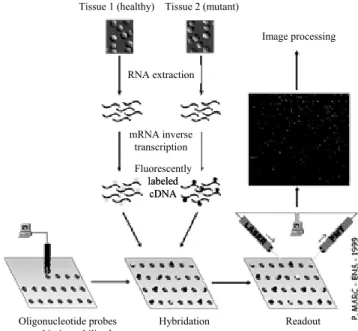
2. determination of expression level (abundance) of genes. The arrays developped on our active substrates in collaboration with Genescore corporation are of the second type. An array of oligonucleotide probes is synthetized ex situ and immobilized on chip. The array is exposed to fluorescently labeled sample DNA, hybridized, and the abundance of complementary sequences is determined by fluorescence excitation and collection (Fig. 14). This method, historically called DNA chips, was developed at Affimetrix, Inc.
RNA extraction mRNA inverse transcription Oligonucleotide probes on-chip immobilized Hybridation Readout
Tissue 1 (healthy) Tissue 2 (mutant)
Fluorescently labeled cDNA Image processing RNA extraction mRNA inverse transcription Oligonucleotide probes on-chip immobilized Hybridation Readout
Tissue 1 (healthy) Tissue 2 (mutant)
Fluorescently labeled
cDNA
Image processing
Figure 14: DNA chip principle
Figure 15 shows details from a DNA chip in which the inert substrate has been replaced by one of our active substrates. Sample DNA is labeled with Cyanine 3 and excitation source is a Gre Ne laser emitting at 543 nm. Two similar series of DNA chip spots are studied with identical lightning conditions and on two different substrates. Fluorescence enhancement is compared for different spacer layer thicknesses. A maximum is reached for a spacing of about λ/4. A one order of magnitude enhancement is achieved on a mirror surface (Fig. 15b), compared to on a common glass slide (Fig. 15a), involving super-radiance and redirection of light. A two orders of magnitude enhancement is achieved on a nanostructured metal surface, involving in addition SPP coupling. This impressive enhancement on DNA chip has been sensed using a commercial scanning device commonly used to read out biochips and without any expensive material. On an active substrate, the fluorescence detection sensitivity is greatly improved, therefore quantitative measurements are more reliable and the evolution of genes expression level can be followed with better accuracy. Furthermore, smaller quantities of genetic material will be necessary for recurrent medical diagnostics all along a cure to test the efficiency of a genic treatment. This point is also of great interest for embryology applications. Antenatal biopsies of smaller size will be needed and the foetus future development will then be less perturbed and less endangered. Finally, for comparable signal-to-noise ratios, an enhanced signal intensity offers the possibility of limiting the excitation source power, thereby reducing the photobleaching processes. The possibility may thus given for a biochip to be read several successive times with reproductible results. In a near future, active substrates could also contribute to the improvement of microfluidics-based chip or laboratory-on-chip systems, for applications in disease diagnostics, drug discovery or toxicological research.7
Increasing spacer layer thickness
a. Standard microscope slide:
b. Silver mirror:
Increasing spacer layer thickness
a. Standard microscope slide:
b. Silver mirror:
20 µm
20 µm
20 µm
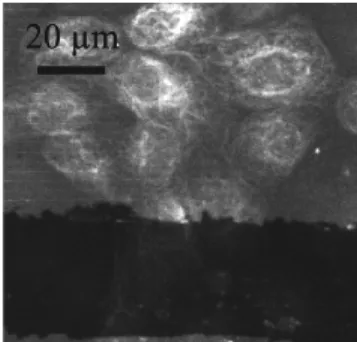
Figure 16: Cells imaging
Surface enhanced fluorescence can also be applied to cells imaging. Figure 16 is a confocal microscope image of dog kidney cells on one of our active substrates (collaboration with F. Cordelières at Institut Curie and R. Briandet at INRA). Cells membrane is marked with GFP. Since a part of the metal layer has been removed, one can easily notice the signal-to-noise ratio improvement. Since spatial extensions of SPP coupling are of the order of tens to hundreds nanometers, surface enhanced fluorescence is of great interest for studies related to membranes: diffusion of marked molecules inside membranes, adhesion of membranes onto the substrate…
5. OUTLOOKS
We plan to develop models to determine and map the local field close to different types of nanostructured metal suface. We are about to apply Surface Enhanced Fluorescence to the dynamic study of biofilms growth, in collaboration with the french Agricultural Research National Institute. We also recently started experiments on dynamic probing of DNA hybridation. Finally, for the last few years, we have been working with the Photobiology and Biophotonic Group at Orsay University in the aim of implementing new fluorescence techniques involving Fluorescence Lifetime Imaging Microscopy.
ACKNOWLEDGEMENTS
We acknowledge our co-workers Luc Talini, Fabrice Richard and Diane Le Clerre (Genescore Company, Paris); Fabrice Cordelières (Institut Curie, Orsay); Romain Briandet (INRA, Massy).
For financial support, we acknowledge Paris 7 – Denis Diderot University, Ville de Paris (ESPCI), CNRS (DNA chips program) and Research Ministry (ACI Nanosciences-Nanotechnologies).
REFERENCES
1. S. Leveque-Fort et al., Proc. SPIE Int. Soc. Opt. Eng. 5139, 20 (2003); S. Leveque-Fort et al., Proc. SPIE Int. Soc. Opt. Eng 5327, 29 (2004)
2. J. R. Lakowicz, Principles of Fluorescence Spectroscopy, Kluwer Academic / Plenum Publishers, 1999 3. W. L. Barnes, Journal of Modern Optics 45 (4) 661-669, 1998
4. H. Ditlbacher, APL 83 (18), 2003 5. H. Ditlbacher, APL 80 (3), 2002 6. W. L. Barnes, Nature 424, 2003
7. Leming Shi, DNA Microarray (Genome Chip), www.Gene-Chips.com 8. Nature Genetics 21 1-60, 1999