A Decomposition-Based Approach for Manufacturing
System Design
by Joachim Linck
Diplom Ingenieur Mechanical Engineering RWTH Aachen, Germany, 1996
Submitted to the Department of Mechanical Engineering in Partial Fulfillment of the Requirements for the Degree of
Doctor of Philosophy in Mechanical Engineering at the
MASSACHUSETTS INSTITUTE OF TECHNOLOGY
June 2001
0 2001 Massachusetts Institute of Technology All rights reserved
BARKER
Signature of Author:
Delaa)tment of Mechanical Engineering 2001 Certified by:
David S. Cochran Assistant Professor of Mechanical Engineering
_ Supervisor Accepted by: Chairman, Committee on Am A. Sonn Graduate Students MASSACHUSETTS INSTITUTE OF TECHNOLOGY
JUL 16 2001
A Decomposition-Based Approach for Manufacturing System Design by
Joachim Linck
Submitted to the Department of Mechanical Engineering on May 24, 2001 in Partial Fulfillment of the Requirements for the Degree of
Doctor of Philosophy in Mechanical Engineering
ABSTRACT
The design of manufacturing systems is a complex task that requires many people to cooperate and communicate at various organizational levels. Companies often change the design of their manufacturing systems by using "off-the-shelf' solutions, such as U-formed manufacturing cells, without relating those solutions to overall system objectives. These ad hoc changes seldom have a formal process to guide them.
This thesis contributes to the development of a manufacturing system design framework that satisfies five objectives: (1) it clearly separates objectives from means of achievement, (2) it relates low-level activities and decisions to high-level goals and requirements, (3) it states interrelationships among different elements of a system design, (4) it provides a common platform to effectively communicate this information across the organization, (5) it guides the designers through all stages of the system design. The framework is based on a recently developed Manufacturing System Design Decomposition (MSDD).
This thesis reports on a multiple case-study research program that validates and modifies the MSDD. This research program led to the creation of a questionnaire that guides the systematic investigation and critical analysis of manufacturing systems. The reliability of this questionnaire has been tested successfully with Cronbach's Alpha factor.
The thesis describes four groups of case studies that show how the MSDD provides a powerful tool to analyze the strengths and weaknesses of existing manufacturing systems. In addition, the thesis uses the MSDD to derive new manufacturing system designs. It shows that the MSDD is equally applicable across industry, manufacturing processes, production volume, and company size. The research in this thesis proves theoretical and literal replication of the premises stated in the MSDD. A database is developed to provide a graphical interface for the use of the MSDD, for documenting system design projects, and for analyzing the questionnaire. Modifications to the MSDD are recommended, based on the case studies. The thesis provides a basis for future research to integrate
existing manufacturing system design methodologies with the MSDD.
Thesis Supervisor: David Cochran, Assistant Professor of Mechanical Engineering Committee Member: Professor Sara Beckman
Committee Member: Professor Stephen Graves Committee Member: Professor David Hardt
Acknowledgements
The work on the Ph.D. has finally come to an end - with the help of many people. First of all, I would like to thank Professor Cochran for introducing me to the fascinating world of MIT. Preparing my diploma thesis was the starting point of my five years in the Production System Design (PSD) Laboratory. Professor Cochran deserves great credit for establishing the PSD Lab at MIT. The work and research in the lab gave me great exposure to many different companies in various industries on three continents. Professor Cochran allowed me to define my own research paths and encouraged me throughout the highs and lows of the Ph.D. process. His help with the case studies was greatly appreciated.
My committee has been very helpful in clarifying and defining my research and thesis. Professor Sara Beckman continuously encouraged me with warm advice and helpful comments. Professor David Hardt supported me to position my work in the Mechanical Engineering Department at MIT. Our "just-a-minute" talks often turned into hour-long discussions. Professor Stephen Graves greatly helped defining the research framework that is developed and applied in this thesis.
I would also like to thank other members of the MIT community. Professor Suh gave valuable advice for constructing the research and the application of axiomatic design. Dr. Daniel Whitney gave critical and beneficial remarks. Professor Timothy Gutowski and Tom Shields introduced me to the Lean Aerospace Initiative research in manufacturing system design. Dr. Eric Rebentisch was very helpful in developing the case study research framework.
Very special thanks to Professor Tom Johnson from Portland State University. He was greatly supportive and encouraging for the work and a tremendous help during the thesis writing process. Professor Paulo Lima from Unicamp University in Brazil motivated the whole PSD Lab during his yearlong stay. Professor Kenneth McKay from Memorial University accompanied me for a long time including four awesome days in Newfoundland talking about "stuff." Many more people inspired me in various ways:
Professor Gudela Grote, Dr. Eric Scherer, Marc Sesterhenn, Martin Weidemann to name just a few.
All the work would be impossible without the work in manufacturing companies. Visteon has been a tremendous support to the PSD Lab and myself. Visteon funded me through half of my time here at MIT. Special thanks to Al Tervalon for the open and insightful discussions over the last 4 years. Ron Clemons and the rest of the Milan crew made the work in their plant an enjoyable and productive time. I owe my thanks to Pat Wardwell, Bruce Hamilton, and Jerry Yukauskas from United Electric, who introduced me to the magical world of "lean manufacturing" by explaining to me patiently how their shop floor functioned. Charlie Colosky gave great insights to the manufacturing reality as well. Many thanks also to Ken Kreafle and Phil Posey from the Toyota plant in Kentucky. The visit of Toyota in Japan was a special highlight. Many thanks to Chris Couch for showing us around at Toyota, and touring around in the evenings. Mr. Mustafa Suzuki from TRW gave us an impressive tour through one of TRW's plants and the Japanese menu.
The current and former fellow students in the PSD Lab made life in 35-135 fun and productive. Thanks to Jorge, Joel, Vicente, Mohammad, Micah, Andrew, Jongyoon, Jey, Zhenwei and many others. Special thanks for Patrick who made the Milan work and Detroit time real fun and gave great feedback during the final weeks of thesis writing. I am much obliged to Matthias Poschmann who supported me for two years. Some major private changes rose from that cooperation. Sincere thanks also to my Aunt Carmen who
endowed me with the financial base for the costly life in Cambridge.
Very special thanks to my parents back home in Essen who always closely followed the distant developments, shared the emotions and spent memorable days with us in Cambridge.
Above all, I want to thank my wife Dbrthe. Her love is the greatest possible motivation and support. Last March, we experienced the most important event of the whole time in Boston: our son Maximilian Douglas was born. This little family made even the last weeks of writing the thesis an enjoyable time.
Table of Contents
ACKNOWLEDGEMENTS ... 5 TABLE OF CONTENTS ... 7 LIST OF FIGURES... 12 LIST OF TABLES... 16 LIST OF ACRONYMS ... 18 CHAPTER 1 INTRODUCTION... 19 1.1 M OTIVA TION ... 19 1.2 PROBLEM STATEMENT ... 21 1.3 SCOPE OF R ESEARCH ... 22 1.4 ORGANIZATION OF THESIS ... 23CHAPTER 2 LITERATURE REVIEW ... 25
2.1 INTRODU CTION ... 25
2.2 SYSTEMS ENGINEERING ... 25
2.2.1 Definition of Systems and Systems Engineering ... 25
2.2.2 Definition of Manufacturing System and Manufacturing System Design. 27 2.3 MANUFACTURING SYSTEM DESIGN APPROACHES ... 30
2.3.1 Manufacturing System Reference Architectures... 30
2.3.2 Conceptual Design Frameworks... 31
2.3.3 Frameworks for Detailed Planning and Operation... 36
2.3.4 Manufacturing System Design in Practice ... 49
2.4 CHAPTER SUMMARY ... 52
CHAPTER 3 MANUFACTURING SYSTEM DESIGN DECOMPOSITION .... 55
3.1 INTRODUCTION ... 55
3.2.1 Basics of Axiomatic Design ... 55
3.2.2 Application of Axiomatic Design for the Development of the MSDD ... 58
3.3 MANUFACTURING SYSTEM DESIGN DECOMPOSITION ... 60
3.3.1 General structure... 61
3.3 .2 Q ua lity ... . . 65
3.3.3 Identifying and Resolving Problems... 68
3.3.4 Predictable Output... 70
3.3.5 Delay Reduction... 72
3.3.6 Operational costs... 76
3.3.7 Investment ... 78
3.4 REVIEW OF USE OF AXIOMATIC DESIGN ... 79
3.5 CHAPTER SUMMARY ... 81
CHAPTER 4 RESEARCH FRAMEW ORK... 83
4.1 INTRODUCTION ... 83
4.2 REVIEW AND SELECTION OF RESEARCH M ETHODS ... 84
4.3 APPLIED RESEARCH FRAMEWORK ... 87
4.3.1 MSDD Development ... 88
4.3.2 Validation of MSDD ... 89
4.3.3 Application Process ... 94
4.4 CHAPTER SUMMARY... 95
CHAPTER 5 DESIGN OF DATA COLLECTION TOOL... 97
5.1 INTRODUCTION ... 97
5.2 REQUIREMENTS FOR DATA COLLECTION TOOL ... 97
5.3 EXISTING MEASUREMENTS AND EVALUATION TOOLS FOR MSDD... 100
5.3.1 Performance M easures ... 100
5.3.2 Evaluation Tool... 102
5.3.3 Other Approaches ... 104
5.3.4 S um m a ry ... 105
5.4 STANDARD DATA COLLECTION TOOL (QUESTIONNAIRE) ... 105
5.4.2 Reliability and Validity ... 109
5.4.3 Lim itations ... 112
5.4.4 Use of Q uestionnaire D uring Research... 113
5.4.5 Review of D ata Collection Requirem ents ... 115
5.5 SUM MARY ... 116
C H A PTER 6 C A SE STU D IE S... 117
6.1 INTRODUCTION ... 117
6.2 BUM PER PRODUCTION CASE STUDIES... 119
6.2.1 Plant M Case Study... 119
6.2.2 Plant T Case Study... 153
6.2.3 Plant U Case Study ... 175
6.2.4 Comparison of the Three Plants ... 187
6.2.5 Sum m ary ... 191
6.3 A PPLICATION CASE STUDY ... 194
6.3.1 Introduction... 194
6.3.2 Project M otivation and Objectives ... 194
6.3.3 Application of M SD D ... 196
6.3.4 D iscussion... 208
6.3.5 Sum m ary ... 212
6.4 ELECTRONICS A SSEM BLY CASE STUDIES... 214
6.4.1 Introduction... 214
6.4.2 D escription of Value streams... 214
6.4.3 Evaluation and Analysis ... 218
6.4.4 N um erical Comparison... 242
6.4.5 D evelopm ent of a Third Value Stream D esign ... 245
6.4.6 Sum m ary ... 253
6.5 INDUSTRIAL G OODS ... 255
6.5.1 Introduction... 255
6.5.2 Company Background... 256
6.5.3 The 120 Product Line... 256
6.5.5 Summary ... 265
6.6 CHAPTER SUMMARY ... 267
CHAPTER 7 M SDD M ODIFICATIONS ... 270
7.1 M ODIFICATION SUGGESTIONS FOR THE M SDD ... 270
7.1.1 Quality (FR-DP Qx)... 270
7.1.2 Identifying and Resolving Problems (FR-DP Rx)... 271
7.1.3 Predictable Output (FR-DP Px) ... 274
7.1.4 Delay Reduction (FR-DP Tx) ... 275
7.1.5 Direct Labor (FR-DP Dx)... 276
7.2 ANALYSIS AND M ODIFICATION OF QUESTIONNAIRE ... 277
7.2.1 Analysis of the Questionnaire... 277
7.2.2 Modifications of Questionnaire ... 284
7.3 DISCUSSION OF DEPENDENCIES ... 288
7.4 SUMMARY... 290
CHAPTER 8 M SDD DATABASE ... 292
8.1 M SDD DATABASE ... 292
8.2 LINKING EXISTING DESIGN METHODS TO M SDD... 295
8.3 SUMMARY... 299
CHAPTER 9 CONCLUSIONS ... 300
9.1 SUMMARY OF W ORK... 300
9.2 RECOMMENDATIONS FOR FUTURE RESEARCH DIRECTIONS ... 301
9.2.1 Long-Terms Studies ... 301
9.2.2 Performance M easurement... 302
9.2.3 Determination of Correlations and Dependencies ... 302
9.2.4 Empirical Research in Manufacturing System Design ... 303
9.2.5 MSDD as Part of Manufacturing System Design Framework... 303
9.2.6 MSDD Database ... 304
APPENDIX A (M SDD) ... 306
MANUFACTURING SYSTEM DESIGN DECOMPOSITION (MSDD) (PAGE 2 OF 2)... 307
APPENDIX B (QUESTIONNAIRE) ... 308 REFERE N CES... 317
List of Figures
Figure 2-1: General systems engineering process [adapted from Blanchard & Fabrycky, 19 9 8 , p .2 6 ]. ... 2 6 Figure 2-2: Systems engineering process applied to manufacturing systems... 29 Figure 2-3: Focus of conceptual design frameworks relative to systems engineering
p ro cess... 3 2 Figure 2-4: Product-process matrix [adapted from Hayes and Wheelwright, 1984]... 33 Figure 2-5: Framework for selecting a manufacturing strategy [Miltenburg, 1995]... 34 Figure 2-6: Relationship between production rate / mix and system configuration [Black,
19 9 1, p . 4 6 ] ... 3 5 Figure 2-7: Core Just-In-Time manufacturing framework [Sakabibara et al., 1993]... 37 Figure 2-8: Implementation steps for Toyota production system [Monden, 1998, p.3 2 8]3 9
Figure 2-9: Lean production framework [Suzuki, 1999]... 41 Figure 2-10:TPS related research and frameworks relative to systems engineering
p ro cess... 4 3 Figure 2-11: The focus of value stream mapping is on defining relationships between
sub sy stem s. ... 44 Figure 2-12: Decomposition of high profitability for manufacturing systems [Hopp &
Spearm an, 1996, p.200]... . 45 Figure 2-13: Facotry design procedure [Kettner et al., 1984]... 46 Figure 2-14: Structure of unified manufacturing system management framework [Wu,
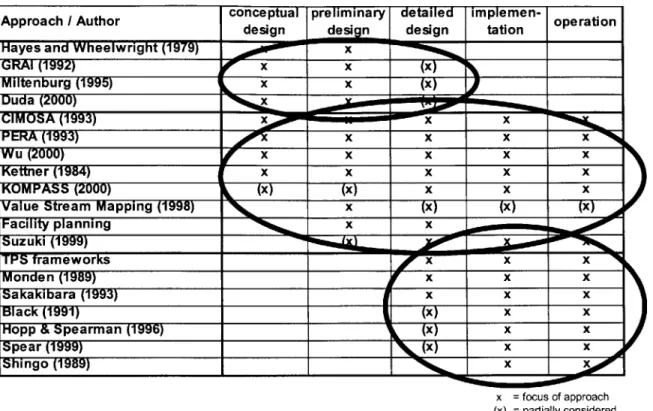
2 0 0 0 , p . 12 6 ]. ... 4 7 Figure 2-15: Existing manufacturing system design methodologies, tools and frameworks
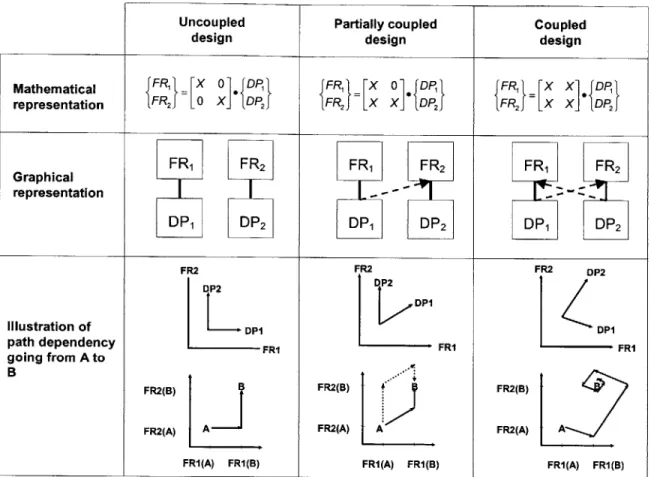
relative to system s engineering process... 53 Figure 3-1: The mathematical and graphical representation of uncoupled, partially
coupled and coupled design... 57
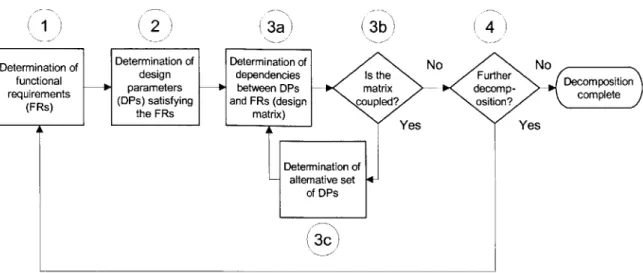
Figure 3-2: The axiomatic design decomposition process consists of four steps:
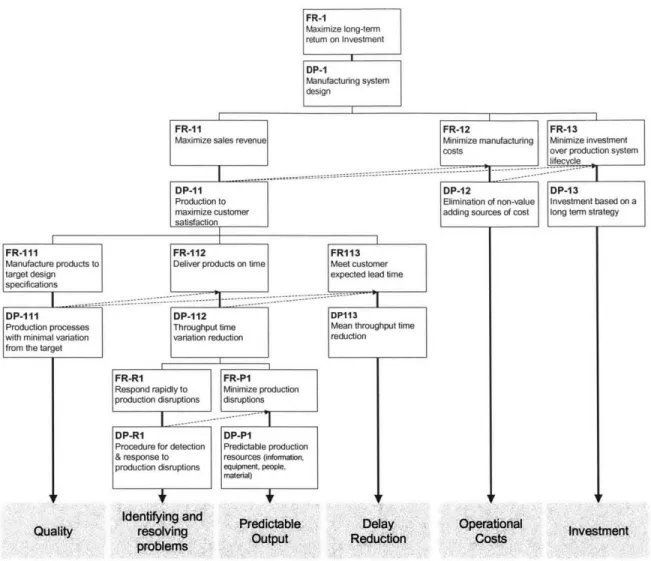
determination of FRs, DPs, design matrix, and further decomposition if necessary.59 Figure 3-3: The MSDD distinguishes six general functions of manufacturing systems:
operational costs, and investment. Each function is decomposed into a separate
branch following the rules of axiomatic design... 61
Figure 3-4: General structure of the MSDD with six distinctive decomposition branches. ... 6 5 Figure 3-5: Quality branch of the MSDD ... 66
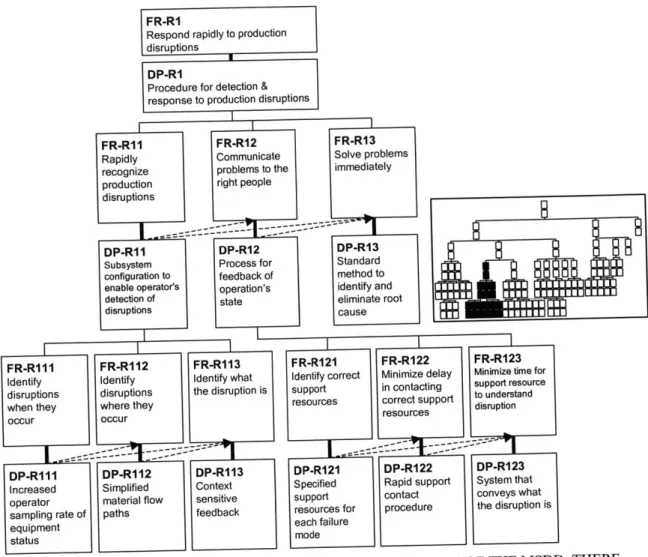
Figure 3-6: Identifying and resolving problems branch of the MSDD. There are three main elements in the branch: disruptions must be recognized (when, where, what), communicated, and eventually solved... 69
Figure 3-7: The decomposition of predictable resources distinguishes four production resources: information, equipment, people, and material... 70
Figure 3-8: The MSDD distinguishes five types of delays: lot delay, process delay, run size delay, transportation delay, and systematic operational delays... 73
Figure 3-9: Cost system for advanced manufacturing systems [Son, 1991]... 76
Figure 3-10: The operational costs branch focuses on the elimination of non-value adding sources of costs (DP-12). Three sources of costs are considered: direct labor (FR-DP 121), indirect labor (FR-DP 122) and facility costs (FR-DP 123)... 77
Figure 4-1: Overall research steps of this thesis. ... 84
Figure 4-2: Framework for multiple-case study research (adapted from [Yin, 1994, p.49]) ... 8 7 Figure 4-3: Applied case study framework... 88
Figure 4-4: Development of MSDD. ... 89
Figure 4-5: V alidation process... 90
Figure 4-6: Two approaches for data analysis. ... 93
Figure 4-7: Development of application process for MSDD... 95
Figure 5-1: Evaluation tool assesses how well a system satisfies 16 FR-DP pairs of M SD D [W ang, 1999, p. 104]... 102
Figure 5-2: Detail of Evaluation tool showing the description of six levels of achievement for FR-DP Ri. The pie charts illustrate to what degree a system belongs to a p articu lar lev el. ... 103
Figure 5-3: Graphical illustration of filled out questionnaire... 114
Figure 6-2: Value stream of plant M... 122
Figure 6-3: Material flow in plant M... 124
Figure 6-4: Schematic layout of injection molding area in plant M ... 125
Figure 6-5: Schematic layout of the paint M's paint system. ... 126
Figure 6-6: Processes in plant M's paint system. ... 127
Figure 6-7: The ILVS assembly area in plant M. ... 130
Figure 6-8: Typical station for non-ILVS assembly... 132
Figure 6-9: Overall evaluation of plant M relative to the MSDD and score distribution of qu estion s. ... 13 3 Figure 6-10: Schematic layout of plant T. ... 153
Figure 6-11: Value Stream of Plant T... 155
Figure 6-12: Material flow in plant T. ... 156
Figure 6-13: Schematic layout of injection molding area at Plant T... 157
Figure 6-14: Schematic layout of Plant T's paint system... 158
Figure 6-15: Schematic layout of paint unload and assembly area. ... 160
Figure 6-16: Overall evaluation of plant T relative to the MSDD and score distribution of qu estion s. ... 16 1 Figure 6-17: Schematic layout of Plant U... 176
Figure 6-18: Value stream of plant U... 177
Figure 6-19: material flow in plant U... 178
Figure 6-20: Schematic layout of injection molding area in pant M ... 179
Figure 6-21: Schematic layout of plant U's paint system... 180
Figure 6-22: The Paint system of plant U has the ability to paint two color parts. ... 181
Figure 6-23: Typical ILVS assembly area in plant U... 183
Figure 6-24: Non-ILVS assembly area... 184
Figure 6-25: Overall evaluation of plant U in comparison to Plant M. ... 185
Figure 6-26: Comparison of all three bumper plants ... 188
Figure 6-27: Simplifying future state value stream map. ... 195
Figure 6-28: 4 step application process for MSDD. ... 197
Figure 6-29: Mapping of project objectives with MSDD... 200
Figure 6-31: Comparison of original bumper production and pilot system including
distribution of answers to questions related to design objectives... 204
Figure 6-32: Schematic layout of Value stream C ... 215
Figure 6-33: Schematic layout of value stream P. ... 217
Figure 6-34: Comparison of value stream C and P... 219
Figure 6-35: Anwers to group I questions ... 234
Figure 6-36: Anwers to group I questions (concept irrelevant)... 237
Figure 6-37: Third way - conceptual structure... 250
Figure 6-38: Shop floor layout of UE with material flow 120 line. ... 257
Figure 6-39: Value stream UE 120 line ... 258
Figure 6-40: 120 assembly line at UE... . ... 260
Figure 6-41: Overall MSDD evaluation of UE's 120 line and score distribution for questions. ... ---...---... 26 1 Figure 7-1: Layout of injection molding area in plant M and T. ... 272
Figure 7-2: Graphical illustration of questionnaire answers in MSDD database. ... 278
Figure 7-3: Percentage of achievable points for all value streams ... 279
Figure 7-4: Distribution of questionnaire responses... 280
Figure 8-1: MSDD database working window ... 293
Figure 8-2: General process of linking design methods with MSDD... 295
Figure 8-3: Administration of design methods ... ... 296
Figure 8-4: Linkage of design methods with MSDD... 297
Figure 8-5: Twelve steps for redesigning existing manufacturing systems [Cochran et al., 200 1] ... ... ---... 298
Figure 8-6: Linkage of 12 steps process with MSDD... 299
Figure 9-1: MSDD as an integrative part of a manufacturing system design framework. . . . . ... 304
List of Tables
Table 4-1: Characteristics of quantitative and qualitative research methods [Leedy, 1997].
The shaded boxes indicate the relationship to the research area of the thesis... 85
Table 4-2: Approaches and typical research questions for qualitative research [Leedy, 19 9 7 ] ... 8 5 Table 5-1: Examples of Performance measures for Functional requirements... 101
Table 5-2: Results of reliability test analysis... 110
Table 6-1: Sum m ary of quality branch... 135
Table 6-2: Summary of the identifying and resolving problem branch... 138
Table 6-3: Key observations of predictable output branch for plant M... 140
Table 6-4: Summary of delay reduction plant for plant M... 145
Table 6-5: Summaries of direct labor for plant M... 150
Table 6-6: Quality sum m ary for plant T... 162
Table 6-7: Summary of identifying and resolving problem branch at Plant T... 164
Table 6-8: Key observations of predictable output branch for plant T... 167
Table 6-9: Delay reduction summary for pant T. ... 170
Table 6-10: Direct labor summary for plant T... 173
Table 6-11: Comparison of pants M, U, and T... 189
Table 6-12: quantitative comparison of the three bumper plants. ... 190
Table 6-13: Comparison of paint systems of the three bumper plants. ... 191
Table 6-14: Evaluation for questions of FR-DP pairs, which were design objectives... 205
Table 6-15: FR-DP pairs of project objectives in the order they appear in the MSDD.. 210
Table 6-16: Q uality related issues... 221
Table 6-17: Identifying and resolving problems... 222
Table 6-18: Predictable output... 223
T able 6-19: D elay reduction ... 224
Table 6-20: D irect labor... 2 2 6 Table 6-21: Group I questions (Independent on choice of value stream)... 229
Table 6-22: Group D questions (dependent on choice of value stream)... 232
Table 6-24: Answers to Q12 "elmination of operator assignable causes" for value stream
C and P...-- --... 243
Table 6-25: Answers to R 1I and P11 branches for value stream C and P. ... 244
Table 6-26: Distribution of answers to The T-branch for Value stream C and P... 245
Table 6-27: Group D questions for third value stream design... 247
Table 6-28: Questions with medium to poor evaluation for UE. Shaded questions relate to standardization aspects... ... 263
Table 7-1: Questions related to standaridzed work and procedures. ... 283
Table 7-2: Distribution of answers for questions related to standardized methods and procedures ... 283
List of Acronyms
AGV Automatic Guided Vehicle
AS/RS Automated Storage and Retrieval System
CIM Computer Integrated Manufacturing
CIMOSA CIM Open System Architecture
CNC Computer Numerical Control
CT Cycle Time
DM Design Matrix
DP Design Parameter
e.g. Exempli Gratia (for example)
ERP Enterprise Resource Planning
EWIP Emergency Work In Process
FMS Flexible Manufacturing System
FR Functional Requirement
GIM GRAI Integrated Method
GRAI Graphe a Resultats et Activities Interlies
i.e. Id Est (that is)
ILVS In Line Vehicle Sequence
JIT Just In Time
MRP Material Requirements Planning
MSDD Manufacturing System Design Decomposition
OM Operations Management
PERA Prudue Enterprise Reference Architecture
PM Performance Measure or Preventive Maintenance
ROI Return On Investment
SCORE Structured Company Operational Review & Evaluation
SMED Single Minutes Exchange of Die
SPC Statistical Process Control
SWIP Standard Work In Process
TPM Total Productive Maintenance
TPS Toyota Production System
TQM Total Quality Management
TSSC Toyota Supplier Support Center
UE United Electric
VDI Verein Deutscher Ingenieure
VSM Value Stream Mapping
Chapter 1
Introduction
Manufacturing is one of the most important contributors to economic wealth. Even though the service sector tends to steadily grow in Western economies, half of the jobs in the US are still tightly coupled to manufacturing [Hopp and Spearman, 1996]. Global competition forces Western companies to streamline their manufacturing operations. In addition, customer requirements are becoming more demanding in terms of higher product variety, shorter product life cycles, faster delivery times, and better quality. Companies have to design efficient manufacturing systems to meet those customer requirements.
The design of manufacturing systems is an inherently complex task. It starts with the definition of system requirements and ends with operation of the system. Many people from various organizational levels and disciplines have to cooperate to create and operate a successful manufacturing system. However, research studies provide evidence that most manufacturing system design is done in an ad-hoc fashion without applying a design process that supports the achievement of the system requirements. Although numerous tools and methods are available to support the design process, it often is not possible to integrate the various tools into a comprehensive manufacturing system design methodology. This thesis develops a manufacturing system design framework with the potential to combine existing manufacturing system design methodologies.
1.1
Motivation
Several studies find that industry tends to follow loosely defined procedures to carry out the task of manufacturing system design. There is a particular lack in defining and communicating design requirements and objectives across the organization [Hopp & Spearman, 1996, Wu, 2000].
Manufacturing strategy frameworks clarify system requirements at an abstract level. The frameworks define high-level system requirements and provide guidance for the selection of general system configurations such as job shop or manufacturing cells [Hayes &
Wheelwright, 1979, Miltenburg, 1995]. However, the frameworks do not help to break those high-level requirements into more detailed objectives.
Designing a manufacturing system in the absence of defined system requirements often leads to unsatisfactory system performance. A recent trend in industry is to transform the shop floor towards "lean" manufacturing. Companies tend to copy established "lean tools" such as U-form manufacturing cells and kanban systems [e.g., Sekine 1999]. The "lean tools" are often seen as generic solutions to contemporary manufacturing problems [Zipkin, 1991]. Few authors, however, point out the necessity to view these practices in the context of the whole system [Japan Management Association, 1986, p.23]. To address this need, Suzuki of TRW developed a framework relating the "lean tools" to objectives in order to understand the objectives those tools are trying to achieve [Suzuki, 1999]. A large amount of research has been done to understand the Toyota Production System (TPS). Hence, many frameworks attempt to support designers in the design of a manufacturing system that can copy the manufacturing efficiency observed at Toyota. The frameworks focus on operational aspects of a manufacturing system and build upon tools and concepts associated with Toyota. The frameworks often do not relate those tools to system requirements. Conceptual designs are considered as a given based on Toyota's approach. As a result, industry often copies those tools out of system context as discussed above.
Manufacturing system design in industry often starts with a rough layout scheme, which divides the plants into sub-systems such as machining and assembly. The design of the sub-systems is often a replication of existing system designs without a clear definition of system requirements. The advantage of copying existing lines could be that a company gradually improves their systems by incorporating gained knowledge [Kreafle, 2001]. However, many companies lack a formal process to capture such knowledge [Grant, 1996]. As a result, manufacturing engineers often copy existing system designs without knowing the original objectives that led to the existing design.
During more detailed design phases, manufacturing engineers are often assigned to specific tasks such as the selection of a specific machine. The engineers are often not able to relate their design decisions to the overall system. A translation of high-level system
requirements to lower-level design decisions and vice versa is often not possible. Consequently, there is a tendency to optimize single operations rather than the system as a whole.
Value Stream Mapping (VSM) has recently become a widely used tool in industry. VSM is a very valuable and useful tool to support manufacturing system design particularly during early design phases, when general relationships between sub-systems are defined. However, VSM does not support the detailed system design and does not consider human aspects of manufacturing systems.
System designers have a large choice among various tools that support the manufacturing system design task. However, those tools are often difficult to link with each other. It would be desirable to develop a manufacturing system design framework that better facilitates the connection of existing tools. Such a framework would guide practitioners through all stages of manufacturing system design and operation without losing the system perspective.
1.2
Problem Statement
To summarize, there is a need to develop a comprehensive framework that can guide practitioners through all stages of manufacturing system design. Starting with the definition of system requirements, the framework must be able to link design decisions at various stages to those requirements. It is desirable that the framework is able to make use of existing tools for manufacturing system design. Those tools should be linked with each other to avoid local optimization.
It is believed that the framework should satisfy the following requirement: - clearly separate system design objectives from design solutions
- relate low-level activities and decisions to high-level goals and requirements - state the interrelationships among the different elements of a system design
- provide a common platform to effectively communicate this information across the organization
- guide practitioners from system design to operation.
1.3
Scope of Research
This thesis develops a manufacturing system design framework that satisfies the requirements outlined above in three steps.
- Development of the Manufacturing System Design Decomposition (MSDD). - Validation and modification of the MSDD.
- Outline of an application process based on the MSDD.
The MSDD uses axiomatic design to articulate a general set of objectives and means for manufacturing systems. The MSDD provides a structure for relating the many elements of manufacturing systems and for linking low-level design decisions to high-level system objectives. Four case studies test whether or not the MSDD provides a useful framework for manufacturing system design. The first case study compares three plants producing plastic bumpers for the automotive industry. The study shows how well the MSDD can explain performance differences among observed manufacturing systems. The second case study applies the MSDD in one of the bumper production plants to test how well the MSDD can support system designers. The third study examines two distinctive line designs for the assembly of electronic products within the same company. The strength and weaknesses of both systems are explained with the help of the MSDD. Furthermore, the case study develops improvement suggestions for the two line designs based on the premises stated in the MSDD. The last case study applies the MSDD to analyze a value stream in a medium-sized family owned company that manufactures automatic process controllers for pressure and temperature. The company is known to have a very efficient manufacturing system. Thus, the case study uses the MSDD to see how well it captures the positive aspects of the manufacturing system design.
A data collection tool based on the MSDD is developed to standardize the compilation of observations made during the case studies. A software tool is created to provide a graphical user interface for the use of the MSDD, document system design projects and to support the analysis of the observations.
1.4
Organization of Thesis
This thesis begins with a review of existing approaches to manufacturing system design. The review categorizes the various approaches by relating them to a general systems engineering process. Then follows a discussion of manufacturing system design in practice. Chapter 3 reviews existing research methodologies and defines the applied research framework of this thesis. The fourth chapter describes in detail the MSDD, which builds the basis for the remaining part of the thesis. The research framework outlined in Chapter 3 requires a standard way to evaluate a system relative to the MSDD and to relate observations to the MSDD in a repeatable manner. The chosen means for the data collection is a form of questionnaire based on the MSDD, which is described in chapter 5. Chapter 6 describes the four groups of case studies. Chapter 7 summarizes the findings of the case studies, and makes suggestions for improvements and modifications to the MSDD. Chapter 8 suggests how other manufacturing system design approaches can be linked to the MSDD. Chapter 9 summarizes the work performed and identifies future research areas.
Chapter 2
Literature Review
2.1 Introduction
Reviewing the vast body of literature in manufacturing system design is a daunting challenge. Manufacturing system design incorporates numerous research disciplines ranging from manufacturing strategy to detailed process engineering.
This literature review is based on a belief that manufacturing system design must apply systems engineering methods to manage the complexity of the design task [Wu, 1992, Hitomi, 1996]. The chapter therefore begins with a review of systems engineering and discusses its application to manufacturing system design. Existing frameworks and methodologies of manufacturing system design are then reviewed and related to the systems engineering process. After describing examples of manufacturing system design in practice, the chapter concludes with a summary and motivation for the research in this thesis.
2.2 Systems Engineering
2.2.1 Definition of Systems and Systems Engineering
A system is generally defined as a set of elements embodying specific characteristics. Between the elements are relations representing the functional connections of the elements. The system has a defined boundary to its environment and all elements exist within this boundary. Each element itself might be a subsystem. An open system has inputs from and/or outputs to the environment through the system's boundary. A dynamic system changes its status with the time. The purpose of a system is to achieve defined goals [Bruns, 1988].
Systems engineering is basically a structured approach to think about and work with systems. Wu describes it as a generic problem solving cycle [Wu, 2000, p. 126]. Hitomi finds four characteristics of systems engineering in the literature [Blanchard and Fabrycky, 1998, p.23]:
(1) A top-down approach that examines how individual system elements work together to influence overall system performance. The bottom-up approach is complementary in that it deals with individual elements first and then considers the relationships among the elements. Both, the top-down and bottom-up approaches assume that systems are hierarchical in nature. (2) A life-cycle orientation that addresses all phases of a system from conceptualization, rough design, detailed design, and operation to phase out. (3) System design starts with the definition of system requirements, relates these requirements to design decisions, and performs system evaluations relative to the requirements. (4) System design requires an interdisciplinary approach to understanding
and handling the system complexity.
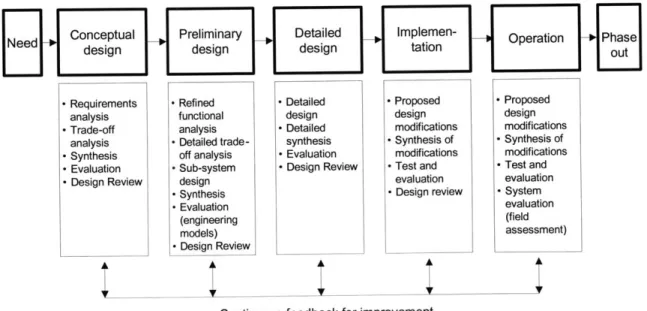
A systems engineering process describes the engineering tasks that support and specify all activities through the phases of a system life cycle. Figure 2-1 illustrates the systems engineering process [Blanchard & Fabrycky, 1998, p.26]. The process moves from left to right in iterative steps, not sequential.
N eed Conceptual _,Preliminary _, Detailed _,Implemen- Operation Phase
design design design tation ITut
-Requirements -Refined -Detailed -Proposed -Proposed
analysis functional design design design
-Trade-off analysis -Detailed modifications modifications analysis -Detailed trade- synthesis -Synthesis of -Synthesis of
-Synthesis off analysis -Evaluation modifications modifications
-Evaluation -Sub-system -Design Review -Test and -Test and
-Design Review design evaluation evaluation
-Synthesis -Design review -System
-Evaluation evaluation
(engineering (field
models) assessment)
-Design Review
Continuous feedback for improvement
FIGURE 2-1: GENERAL SYSTEMS ENGINEERING PROCESS [ADAPTED FROM BLANCHARD & FABRYCKY, 1998, P.26].
The process highlights several important aspects of systems engineering:
" Systems exist to fulfill a purpose. System requirements must be defined. " Systems are hierarchical in nature and can be divided into sub-systems. * Systems are designed and improved over time until the system is phased out. " Three tools are commonly used throughout the system design process: synthesis,
analysis, and evaluation.
Synthesis refers to the selecting and combining of system components in such a way that the defined system requirements can be satisfied [Blanchard, Fabrycky, 1998, p.67]. Synthesis occurs in every phase of the systems engineering process as the system design becomes more and more specific. Synthesis is essentially a creative process to satisfy defined requirements. Analysis develops system requirements, performs feasibility studies, and defines evaluation measures. Evaluation occurs after synthesis and assesses how well system requirements have been satisfied.
System design essentially applies the systems engineering process to create a "useful system (static structure and operating procedure) under a specified evaluation criterion by the use of scientific disciplines" [Hitomi, 1996, p. 30]. Note that the systems engineering process also includes the operation of the system and does not end with implementation. The following paragraphs discuss the characteristics of manufacturing systems and explain how the systems engineering process can be applied to manufacturing system design.
2.2.2 Definition of Manufacturing System and Manufacturing System
Design
Definition of Manufacturing System
There is no generally shared definition of manufacturing systems [see e.g., Arinez, 2000, p. 27]. However, there are common elements among the definitions found in literature:
the purpose of manufacturing systems is to convert inputs into outputs by processing
material. The elements of manufacturing systems are resources such as people, equipment, material and information. The resources are linked by relationships enabling
material and information to flow through the system. The relationships represent the
organization of the system.
The boundary of the manufacturing system is not always included in the definitions. Cochran distinguishes manufacturing systems and production systems. Production systems include the manufacturing system along with functions such as marketing, finance, and product development [Cochran, 1994]. The manufacturing system can therefore be seen as the shop floor of a manufacturing enterprise.
A working definition of manufacturing systems for this thesis is as follows [adapted from Cochran, 1994, Chryssolouris, 1992, Wu, 1992]:
Manufacturing systems consist of people, machines, tools, material, and information, which are related to each other to produce a value-added product. Definition of Manufacturing System Design
Manufacturing system design must integrate the many elements of a manufacturing system into a smoothly functioning whole. It starts with the definition of the system requirements and ends with the operation of the system.
Given the broad meaning of manufacturing system and the numerous elements it consists of, it is not surprising to find an even broader understanding of manufacturing system design. Wu and Hitomi emphasize the need to apply systems engineering approaches to design manufacturing systems [Wu, 2000, Hitomi, 1996]. Wu starts with the definition of enterprise objectives, which are then translated into the physical arrangement and the operation of the system. Black focuses on the physical layout of the operations and the material flow [Black, 1991]. Kettner provides a detailed step-by-step procedure from goal definition to detailed physical layout to implementation [Kettner et al., 1984]. The GRAI method concentrates on developing decision support for conceptual and preliminary design phases [Doumeingts et al., 1993].
Arinez [2000] categorizes manufacturing system design definitions found in literature into four types: (1) layout and structural organization of physical elements, (2) procedural design approaches providing a sequence of interrelated design activities, (3) decision process, (4) system control. Each type focuses on particular aspects of the system
engineering process by limiting the scope of manufacturing system design (e.g., to layout, control).
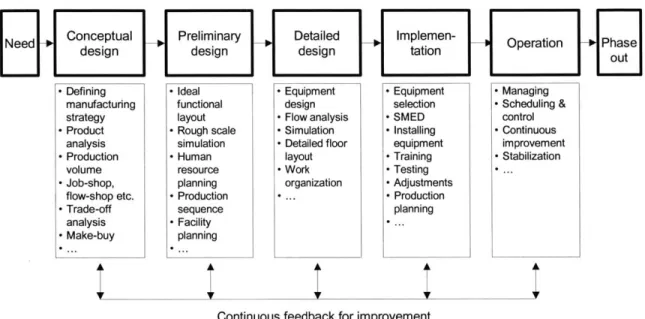
As stated in the outset of this chapter, manufacturing system design must apply a systems engineering approach to structure the complexity of the relationships of manufacturing systems. Therefore, a general definition of manufacturing system design should not be limited to a single aspect of system engineering relative to manufacturing, but should include all aspects. Figure 2-2 illustrates activities in each phase of the system engineering process applied to manufacturing system design.
Ned Conceptual Preliminary Detailed l Implemen-K -eO aIon PA
[I desigDn design design tatio out
-Defining -Ideal -Equipment -Equipment -Managing manufacturing functional design selection -Scheduling & strategy layout -Flow analysis -SMED control
-Product -Rough scale -Simulation -Installing -Continuous analysis simulation -Detailed floor equipment improvement
-Production -Human layout -Training -Stabilization
volume resource -Work -Testing
--Job-shop, planning organization -Adjustments flow-shop etc. -Production ...- Production
-Trade-off sequence planning
analysis -Facility
--Make-buy planning
Continuous feedback for improvement
FIGURE 2-2: SYSTEMS ENGINEERING PROCESS APPLIED TO MANUFACTURING SYSTEMS.
A working definition of manufacturing system design for this thesis is as follows:
Manufacturing system design applies a system engineering process to create and operate a manufacturing system from the definition of the system needs and requirements to the phase out of the system.
With this working definition in mind, the following section reviews existing approaches to manufacturing system design and relates them to the systems engineering process. Approaches can be methods, methodologies, frameworks, or special tools. The goal of
the review is to examine the strengths and limitations of existing approaches relative to the task of manufacturing system design.
2.3 Manufacturing System Design Approaches
2.3.1 Manufacturing System Reference Architectures
Within the context of manufacturing systems, a reference architecture is a set of models which describe what a manufacturing system consists of and how it functions [Williams et al., 1993]. Most architectures focus on control aspects and try to systemize decision making in manufacturing systems. This section reviews three reference architectures and relates them to the overall systems engineering process.
PERA
The Purdue Enterprise Reference Architecture (PERA) provides a framework for examining manufacturing system design from the definition of enterprise objectives to the design of individual tasks [Williams, 1993]. PERA, using a process that is similar to the engineering process presented above, distinguishes five phases: concept phase, definition phase, design phase, installation phase, and operations phase. PERA links an information architecture and a manufacturing architecture with a human-organization architecture. Although PERA provides a useful framework to convey the complexity of manufacturing systems, the overall application process remains undefined.
GRAI Method
The Graphe a Resultats et Activites Interlies (GRAI) reference model has been developed to provide a general description of a manufacturing system with the focus on system control [Doumeingts et al., 1993]. The model distinguishes three sub-systems of manufacturing systems: the physical system transforms material etc. into output products,
the decision system ensures that the system objectives are met, the information system
contains all information the decision system needs. The goal of the GRAI model is to structure the design and analysis of manufacturing systems in the early design phases. The GRAI model uses two main tools: GRAIgrid is a top-down approach to identify decision centers. Decision centers are functional areas (planning, purchasing etc.) that
make decisions to coordinate the system. GRAIgrid determines the time horizon in which decisions are made relative to a predefined set of functions. The second tool, GRAInet, is a bottom-up approach to model activities and decisions made in the system. The GRAI model is useful in designing the control structure of systems with the focus on
computerized solutions.
A recent extension of GRAI is the GRAI Integrated Method (GIM), which applies existing tools such as IDEFO to integrate decision, information and physical systems. It is unclear how GRAI can be applied to the physical design aspects of manufacturing systems [Wu, 1992]. It is also unclear whether the model can be applied without the extensive use of computer modeling.
CIMOSA Model
The goal of CIMOSA is to model business processes and enterprise objects of a CIM environment [Vernadat, 1993]. The main function of CIMOSA is to develop an executable model of some part(s) of the enterprise and then use the model to control the CIM system operations. It is focused on the logical (i.e. control) part of manufacturing systems and provides only limited support for the physical design. Tools of the framework are designed to capture system requirements in a structured way. High-level requirements are decomposed into lower-level activities.
Summary of Reference Architectures
The architectures provide a general framework for manufacturing system design and operation. CIMOSA and GRAI are computer oriented and focus primarily on control and decision aspects of manufacturing systems. PERA in contrast is a conceptual framework for applying systems engineering to manufacturing systems, but it does not provide tools for the different systems engineering phases. All three architectures provide a relatively complete view of an enterprise life cycle. However, more detailed tools are needed to accomplish the full challenge of manufacturing system design.
2.3.2 Conceptual Design Frameworks
The purpose of conceptual design frameworks is to clarify system requirements at an abstract level. The frameworks define manufacturing strategy criteria and translate those
criteria into requirements for the conceptual and preliminary system design phases. With respect to system engineering, the frameworks support the first two phases as illustrated in Figure 2-3.
Conceptual Preliminary Detailed
Implemen-design design design tation Oprtn
FIGURE 2-3: FOCUS OF CONCEPTUAL DESIGN FRAMEWORKS RELATIVE TO SYSTEMS ENGINEERING PROCESS.
The literature distinguishes general types of manufacturing system configurations. A manufacturing system configuration may be defined as a manufacturing (sub-)system at a general, conceptual level [Duda, 2000, p.163]. A configuration is the result of general decisions about equipment selection and arrangement, material flow, and control. No decisions regarding work descriptions, tool design etc. are made yet. The most commonly cited configurations are: project shop, job shop, FMS, manufacturing cells, transfer lines, and continuous processing lines [e.g., Hayes and Wheelwright, 1984, Kettner et al., 1984, Black, 1992, Askin, 1993, Miltenburg, 1995].
A project shop is used for large immobile parts such as ships, buildings etc. All needed
parts and machines are brought to the product. Job shops group equipment into departments e.g., drilling department, milling department. Each product produced in a job shop has a unique path through the manufacturing system. Product flexibility is very high, scheduling is often subject to frequent changes, and inventory levels are high. A
flexible manufacturing system (FMS) is a highly automated configuration of CNC
controlled equipment with automated material handling. Direct labor is limited, since routing, machining and material handling is fully automated. FMS usually consists of 3-10 machines. Manufacturing cells are designed for a family of similar parts. Group technology is frequently used to determine families. Parts of similar size and shape can often be processed by a similar set of processes. Manufacturing cells are often associated with the Toyota production system [Shingo, 1989]. Manufacturing cells are usually not
fully automated. Operators perform material handling and processing. Manufacturing cells are applicable for machining and assembly. Transfer line or flow lines involve a
series of stations often arranged in a straight line, to produce a single part. The configuration is most effective when justified by low product mix and high production volume. Material movement in flow lines is usually automated. Continuous processing
lines refer to non-discrete manufacturing processes such as in refineries.
The following paragraphs review several frameworks, which help system designers to determine the type of configuration most appropriate in a given context and relates the frameworks to the systems engineering process.
Hayes and Wheelwright [1984] developed the well-known product-process matrix showing how system configurations relate to production volume and mix (see Figure 2-4). Hayes and Wheelwright state that elements on the diagonal are most suitable to satisfy companies' needs.
Product Structure Mfg System Structure Jumbled flow (job shop) Disconnected line flow (batch)
Ill Connected line flow (ass'yline) IV Continuous flow I Low volume -high variety, one of a kind 11 Multiple products low volume Ill Few major products, higher volumes IV High volume commodity products None ommercial printer Heavy Equipment Auto Assembly Sugar Refinery None
FIGURE 2-4: PRODUCT-PROCESS MATRIX
1984]
[ADAPTED FROM HAYES AND WHEELWRIGHT,
I I
Miltenburg [1995] extended the process-product matrix by strategic objectives (delivery, cost, quality etc.) and manufacturing levers (human resources, organization structure etc.) as shown in Figure 2-5.
Manufacturing Outputs
Products and Volumes >
Layout and Mat'l Flow
a Functional layout
Flow extremely varied
Cellular layout
9 Flow varied with
Op. Paced line flow
Flow mostly regular
0 Equip paced line flow
t Flow regular
-J
Continuous flow Flow rigid
One Low Many Many Several product volume; products products products very
high low medium high high
variety volumes volumes volumel volum e
od JS BF 4 O OPL FMS FMS 0JIT JI L_~2 ... ... 011 -a
IIIZ
7777
ED 0 0J U U N M E U U NE ] U U U El U Ei _____ _ ____I_
_ CaTpry(aur) Strir (ncr twng 0 0 A 14 11CD Poor Good Human resourcesOrganization structure & controls Production planning & control & Sourcing
Process technology Facilities
Level of Manufacturing Capability
FIGURE 2-5: FRAMEWORK FOR SELECTING A MANUFACTURING STRATEGY [MILTENBURG,
1995]
The framework is very useful in analyzing the present position of a company and deriving an improvement strategy. It shows the impacts on manufacturing systems of strategic decisions such as increasing production volume or changing production technology. A shortcoming of the framework is that it treats the configurations as discrete choices and does not provide guidance on how to combine advantages of different configurations. The framework also does not assist the actual design of the manufacturing system, as it is limited to high-level strategic choices.
I NWMEWEMEF . N
U) V)
CD
Other authors offer similar correlations between production volume and mix and system configuration [e.g., Black, 1991, Reinhardt, 2000]. The relationships, however, are only useful for a very high-level selection of possible configurations. First, there is significant overlap between the different configurations as shown in Figure 2-6. Second, many existing manufacturing systems show characteristics of several configurations. Third, it is assumed that basically two variables (production volume and mix) are the main determinants for the system configuration.
Tansfcr
High /
volume Dedicated
flow
Manred and
Prduction 100 ~ unmarmed vells
rates /r e
Parts/
per
Hour 10
-L FMS -A No families of
VUMCI pans. sd-alo
.4I machines
10 100 10tv 10000
Variety
(Number of different pars per system?
FIGURE 2-6: RELATIONSHIP BETWEEN PRODUCTION RATE / MIX AND SYSTEM
2.3.3 Frameworks for Detailed Planning and Operation
2.3.3.1 Toyota Production SystemThe Toyota Production System (TPS) has greatly influenced the research of manufacturing system design over the last 10 to 20 years. Many books on TPS have been published since the 1980s [e.g., Monden, 1983; Hall, 1983; Japan Management Association, 1986]. However, interest in academia and industry to understand the success of TPS has increased greatly since the publication of "The Machine that Changed the World " [Womack, Jones, Ross, 1990]. The book coined the term "lean production" in describing TPS and made the success of the TPS well known across the world. Another term frequently used to describe TPS is Just-In-Time production [Schonberger, 1982, Sakakibara, 1993].
Lean production describes a broad set of management and manufacturing methods commonly used at Toyota. A tendency is to categorize lean tools into best practices such as Kanban, SMED and U-shaped manufacturing cells [e.g., Sekine 1999]. Few authors, however, point out the necessity to view these practices in the context of the whole system: "One cannot discuss the kanban system out of context. If anyone tries to imitate that system without regard to all the factors contributing to its success, then his efforts will be in vain" [Japan Management Association, 1986, p.23]. Other authors present the means of lean manufacturing as a universally applicable solution to manufacturing problems [Black, 1991, Schonberger, 1990].
Many companies have tried to implement those means with varying degrees of success [e.g., Liker, 1998; Cusumano, 1992]. Academia developed frameworks and design approaches to understand the underlying principles of lean production and to allow transferability within industry [e.g., Monden, 1983; Sakakibara, 1993; Spear & Bowen,
1999].
The following paragraphs review TPS-related research with respect to the systems engineering process.
Sakakibara et al. [1993] developed a framework for Just-in-Time (JIT) manufacturing. The core Just-In-Time manufacturing framework is shown in Figure 2-7. The framework is based on academic and practitioner literature and provides a valuable summary of research with respect to the Toyota Production System. The upper and lower parts of the framework show how manufacturing strategy, management, and organizational aspects interrelate with each other. The main focus of the framework is on the middle part and deals with continuous improvement and problem solving activities.
managementMauctrn
Human resource ppo M tratg
management
company wide continuous
Improvement and problem
-Quality solving activities Technology management
Production Process & Work force Supplier Information
floor Scheduling product design management management system
management 1. Setu redu 2. Sma 3. Prev main 4. Kan (if appli 5. Pull (if appli p time 6. Repetitive ction master
11 lot size scheduling entive 7. Daily tenance schedule ban adherence cable) system cable) 10. Multifunction workers 11. Small group problem solving 12. Training JIT-Manufacturing-System
Improved manufacturing performance
Competitive advantage
FIGURE 2-7: CORE JUST-IN-TIME MANUFACTURING FRAMEWORK [SAKABIBARA ET AL., 1993]. 8. 9. Equipment layout Product design simplicity 13. JIT delivery 14. Supplier quality level 15. MRP adaptation to JIT 16. Accounting adaptation to JIT
The framework highlights an important issue: most TPS related research deals with implementation and operational issues of the systems engineering cycle. Very little attention is paid to early phases of systems engineering such as the formulation of requirements, preliminary design synthesis and analysis, and system evaluation. Sakakibara et al. [1993] also note that most research on JIT has been empirical and descriptive.
JIT Measurement Instrument (Sakakibara et al.)
Sakakibara et al. expanded the core JIT manufacturing framework shown in Figure 2-7 to a measurement instrument by formulating 16 practices usually associated with JIT manufacturing. The measurement instrument consists of a questionnaire, which allows companies to evaluate their performance relative to the depicted practices. In terms of the systems engineering process, most practices are related to the implementation and operational phase, except for one scale that measures accounting practices. The questionnaire was sent to 41 plants in three industries. The analysis of the survey determined three underlying factors of the sixteen practices: management of people and schedule, simplified material flow, and supplier management. Those factors could be seen as high-level objectives to be achieved by the manufacturing system.
The JIT research and measurement framework provides a valuable tool to evaluate system performance relative to key factors of TPS. The framework suggests that implementing the depicted 16 practices will eventually lead to a high performing manufacturing system. However, the framework does not show how the practices depend on each other and how the system must be designed to achieve good performance relative to the practices.
Toyota Production System Framework by Monden
Monden developed a framework of the Toyota production system based on detailed studies of Toyota plants in Japan. Monden relates basic methods and concepts observed at Toyota and develops a sequence, in which those elements should be implemented (Figure 2-8). The intent of the framework is to show relationships between system goals and means. The idea is to start with the means at the bottom and to move upward to achieve the ultimate goal of increasing profits.
![FIGURE 2-7: CORE JUST-IN-TIME MANUFACTURING FRAMEWORK [SAKABIBARA ET AL., 1993]](https://thumb-eu.123doks.com/thumbv2/123doknet/14670753.556770/37.918.148.779.451.993/figure-core-just-in-time-manufacturing-framework-sakabibara.webp)
![FIGURE 2-8: IMPLEMENTATION STEPS FOR TOYOTA PRODUCTION SYSTEM [MONDEN, 1998, P.328]](https://thumb-eu.123doks.com/thumbv2/123doknet/14670753.556770/39.918.173.736.96.686/figure-implementation-steps-toyota-production-monden-p.webp)
![FIGURE 2-9: LEAN PRODUCTION FRAMEWORK [SUZUKI, 1999]](https://thumb-eu.123doks.com/thumbv2/123doknet/14670753.556770/41.918.134.779.105.486/figure-lean-production-framework-suzuki.webp)