A Decomposition-Based Approach to Linking Strategy,
Performance Measurement, and Manufacturing System Design
by
James Wallace Duda B.S., Mechanical Engineering Case Western Reserve University, 1994
S.M., Mechanical Engineering
Massachusetts Institute of Technology, 1996 Submitted to the Department of Mechanical Engineering in partial fulfillment of the requirements for the degree of
DOCTOR OF PHILOSOPHY IN MECHANICAL ENGINEERING
at the
MASSACHUSETTS INSTITUTE OF TECHNOLOGY September, 2000
0 Massachusetts Institute of Technology 2000. All rights reserved.
S/
Signature of Author___________________________
Department of Mechanical Engineering ,Alus4,2000
Certified by
David S. Cochran
Assistant Professor of Mechanical Engineering
_.,u.m hesis Sunervisor
Accepted by
Professor Ain Sonin
Chairman, Committee on Graduate Studies MASSACHUSETTS INSTITUTE
OF TECHNOLOGY
A Decomposition-Based Approach to Linking
Strategy, Performance Measurement, and Manufacturing System Design by
James Wallace Duda
Submitted to the Department of Mechanical Engineering on August 4, 2000 in Partial Fulfillment of the Requirements for the Degree of
Doctor of Philosophy in Mechanical Engineering
ABSTRACT
The ability to understand the impact of lower-level design decisions on the achievement of higher-level strategic objectives is critical for the effective design of manufacturing systems. Furthermore, the development of a set of performance measures in alignment with these
strategic objectives is necessary to ensure that ongoing design improvement activities result in better manufacturing system performance with respect to the goals of the firm. This thesis
investigates how manufacturing systems can be designed to achieve the unique high-level strategic objectives of an organization and how performance measures can be derived to ensure that future system improvements support the firm's manufacturing strategy. A model of the manufacturing system design process is developed using the principles of systems engineering. This system design process begins with the identification and
prioritization of relevant dimensions of manufacturing performance (cost, quality, delivery performance, etc.). Next, performance measures are developed concurrently with various possible models of system behavior and structure (i.e., design alternatives). Trade-offs among these design alternatives are examined, enabling designers to select the most appropriate feasible alternative and to identify opportunities for improvements.
A structured process for trade-off analysis is developed to aid designers in identifying and analyzing the strengths and weaknesses of alternative system designs. An axiomatic design decomposition of a general set of functional requirements (FR's) and design parameters (DP's) for a manufacturing system is used to guide designers through this trade-off analysis as well as through the development of a preliminary set of performance measures. Matrices are formed to express the relationships between strategic objectives, FR's and DP's, and the design alternatives. Combination of these matrices results in the generation of a comparison matrix showing the relative strengths and weaknesses of each design alternative. A software tool is developed to assist designers in managing, visualizing, and communicating the
information required for this trade-off analysis. Examples of the application of this process to the design of manufacturing systems at an automotive component supplier are reviewed. Thesis Supervisor: David Cochran, Assistant Professor of Mechanical Engineering Committee Member: Professor Timothy Gutowski
Committee Member: Professor Deborah Nightingale Committee Member: Professor Shahram Taj
Acknowledgements
After having worked on this for so long, it's hard to even know where to begin this last part. So many people have contributed to this thesis one way or another, knowingly or unknowingly. From Abernathy to Zipkin, so many researchers have contributed to the academic content of this work through their own research and the development of their ideas about manufacturing, strategy, and performance measurement. And from Alaa Abdelnaby to Zinedine Zidane, so many others have contributed to this thesis in other, perhaps less direct ways. I can't possibly acknowledge every individual who helped me with this thesis in some way, but I'll do my best to summarize.
Academically, my thesis committee played an important role in the development of this thesis, of course. Professors David Cochran, Tim Gutowski, Debbie Nightingale, and
Shahram Taj all provided valuable input and encouragement at various stages of the Ph.D. process. I'd like to thank Dr. Taj for his support during the time I spent in Detroit, as it was
very helpful to have an "academic" colleague in the factory. And I'd like to thank Professor Cochran for his leadership in creating the Production System Design lab and developing so many valuable connections with industry. Working in the lab has given me an excellent opportunity to visit many factories and to gain insight into the reality and complexity of designing a manufacturing system. It's also given me the chance to present my work at various conferences and to get feedback from others in academia. On that note, I'd like to thank the many people from industry and academia who attended these presentations and who took the time to discuss my research with me. In particular, I'd like to thank Wickham
Skinner for his enthusiastic and encouraging comments at the last research presentation before my thesis defense.
None of this work would have been possible were it not for the generous sponsorship of the National Science Foundation, Ford Motor Company, and Visteon Automotive Systems. Thanks to Bill Flatt, George Pfeil, Bo Reinholz, Dale Pflanzer, Chuck Muir, Mike Baur, Ron Anger, Gene Warman, and all the other great people I had the chance to work with and get to know during the time I spent at Ford and Visteon. There's no question that I learned a great deal about the world of manufacturing and the realities faced by system designers from all of you.
And again, none of this would have been possible without the people who helped encourage me to come here for graduate school in the first place. Thanks to Professors Ray, Pauley, Newman, and Adams for helping to get me here, and to friends like Shaker and Julie who helped convince me that life as a grad student might not be so bad. I'd also like to thank Mark Jakiela for his guidance while I was doing my Masters here at MIT. He was a great guy to work with, and he, along with CADLab members such as Alok, David, Jay, Krish, Li, Narendra, and Nicola, helped me make the decision to stick around for the Ph.D.
The first big step towards getting the Ph.D. is passing the qualifiers, and I'd like to thank Manuel, Tim, and Gu for being a great study group and helping me prepare for that...
challenge. Also, seeing the three of you finish up your degrees here before me has given me an extra boost of motivation to get going myself.
Since passing the quals, I've spent an awful lot of time here in the PSD lab, and I'd like to thank the fellow students who made it (or at least tried their best to make it) a fun place to work, either through taking the initiative to put together some fun lab intermural teams, or just by trying to have a positive and fun attitude towards life as a grad student. PSD would've been a lot less enjoyable without guys like Mike, Micah, Andrew, Jorge, Cesar, and many others. Equally important to me has been the support of my family and my friends from outside of school (You all know who you are, so I won't go into another long list of names.)
As my time here at MIT has neared its end, another concern began to surface: what to do next. I'd like to thank the good people at i2 Technologies for helping me to clarify that and for providing me with an exciting opportunity to explore some new areas in the world of
manufacturing. Plus there was no greater motivation for me to finish up my work here than to realize exactly what it was costing me to stay.
Finally, I'd like to thank you, the reader, for taking the time to read at least this much of what I've written. Hopefully you'll venture a bit further, maybe read a chapter or two, and find something valuable herein.
Table of Contents
ACK N OW LEDG EM ENTS... 5
TABLE O F CO NTENTS... 7
LIST O F FIG URES... 12
LIST O F TABLES... 15
LIST O F ACRO NYM S... 16
CH APTER 1 INTRO DUCTION ... 17
1.1 MOTIVATION: PROBLEMS IN EXISTING FACTORIES...17
1.2 RELATION OF PERFORMANCE MEASUREMENT TO MANUFACTURING SYSTEM DESIGN...19
1.3 PROBLEM STATEMENT...-.20
1.4 SC O PE O F R ESEA RCH ... 2 1 1.5 ORGANIZATION OF THESIS...22
CHAPTER 2 MANUFACTURING STRATEGY ... 25
2 .1 O V E R V IE W ... 2 5 2 .2 IN TR O D U C TIO N ... 25
2.3 HIERARCHY OF STRATEGIES... 26
2 .3.1 C orp orate Strategy ... 2 7 2 .3 .2 B usin ess S tra tegy ... 2 7 2 .3.3 F unctional S trateg ies...30
2.3.4 Manufacturing Strategy... 31
2.4 A UNIFIED FRAMEWORK FOR STRATEGY...33
2.5 SUMMARY AND CONCLUSIONS ... 35
CHAPTER 3 PERFORMANCE MEASUREMENT FOR MANUFACTURING ... 37
3 .1 IN T R O D U C T IO N ... 3 7 3.2 FUNCTION AND CONTENT OF A PERFORMANCE MEASUREMENT SYSTEM...38
3.3 DESIGNING A PERFORMANCE MEASUREMENT SYSTEM ... 38
3.4 DEFINING THE SET OF PERFORMANCE MEASURES... 40
3.4.1 Qualities of an Effective Set of Measures ... 40
3.5 A NOTE ON THE BALANCED SCORECARD ... 45
3 .6 S U M M A R Y ... 4 6 CHAPTER 4 MANUFACTURING SYSTEM DESIGN METHODS ... 47
4.1 ENGINEERING DESIGN APPLIED TO MANUFACTURING SYSTEMS ... 47
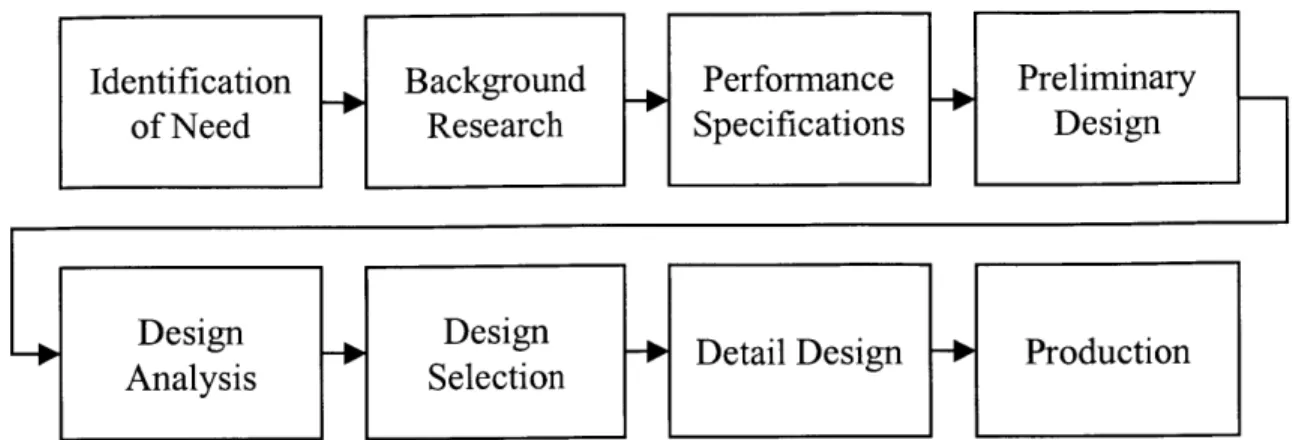
4.1.1 Identification of N eed ... 48
4.1.2 B ackg round R esearch ... 48
4.1.3 Performance Specifications...49
4.1.4 P relim inary D esig n ... 50
4 .1.5 D esig n A n a ly sis ... 5 5 4 .1.6 D esig n S electio n ... 5 7 4 .1 .7 D eta il D esig n ... 5 8 4 .1 .8 P ro d u c tio n ... 5 8 4 .1 .9 S u m m a ry ... 5 9 4.2 INTEGRATED APPROACHES TO MANUFACTURING SYSTEM DESIGN...59
4.2.1 D esig n by P hilosop hy ... 59
4.2.2 System s E ng ineering ... 60
4.2.3 Conclusions on Integrated Approaches to Manufacturing System Design... 62
CHAPTER 5 A DECOMPOSITION-BASED APPROACH TO UNDERSTANDING M ANUFACTURING SYSTEM DESIGN... 65
5 .1 O V E R V IE W ... 6 5 5 .1 .1 M o tiva tio n ... 6 5 5.2 OTHER MANUFACTURING SYSTEM DESIGN FRAMEWORKS...66
5.2.1 Toyota Production System Framework (Toyota Supplier Support Center) ... 67
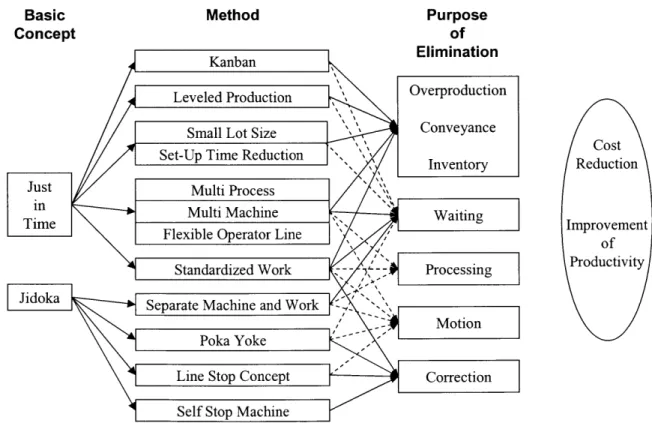
5.2.2 Toyota Production System Framework (Monden)... 67
5.2.3 "Lean Manufacturing Framework" (TR W Automotive)...69
5.2.4 Hierarchy of Manufacturing Objectives ... 69
5.2.5 Framework for Manufacturing Excellence...70
5.2.6 Summary of Frameworks Reviewed... 71
5.3 MANUFACTURING SYSTEM DESIGN DECOMPOSITION...72
5.3 .1 A x io m a tic D esig n ... 72
5.3.2 Manufacturing System Design Decomposition... 80
5 .4 S U M M A R Y ... 9 1 CHAPTER 6 PROPOSED MANUFACTURING SYSTEM DESIGN PROCESS ... 93 6 .1 O V E R V IEW ... 9 3
6.2.1 Elements of Oliver's Core Systems Engineering Technical Process ... 94
6.2.2 Summary of the Core Systems Engineering Process ... 99
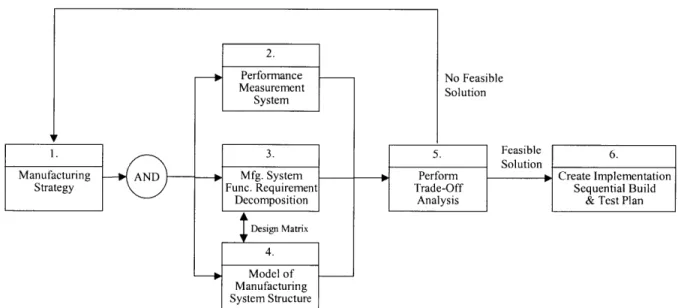
6.3 PROPOSED CORE MANUFACTURING SYSTEM DESIGN PROCESS...100
6 .3 .1 In tro d u ctio n ... 10 0 6.3.2 Elements of the Core Manufacturing System Design Process...100
6.3.3 Summary of the Core Manufacturing System Design Process ... 103
6.4 COMPARISON WITH THE GENERAL SYSTEMS ENGINEERING PROCESS...104
6.4.1 Step s 1 and 2 of the P rocesses...104
6.4.2 Step 3: B ehavior M odel...104
6.4.3 Step 4: Create Structure M odel ... 107
6.4.4 Steps 5 and 6: Trade-offAnalysis and Implementation Plan...108
6.5 APPLYING THE CORE MANUFACTURING SYSTEM DESIGN PROCESS ... 108
6.5.1 Applying the Process at Different Levels of Detail...108
6 .6 S U M M A R Y ... I11 CHAPTER 7 INTEGRATING THE MSDD INTO THE PROPOSED CORE PROCESS: STRATEGY AND PERFORMANCE MEASUREMENT ... 113
7.1 RELATING MANUFACTURING STRATEGY TO THE MSDD... 113
7 .1 .1 C o s t...1 1 4 7 .1 .2 Q u a lity ... 1 1 5 7.1.3 D elivery P erform ance...116
7 .1 .4 F lex ib ility ... 1 1 8 7.1.5 In n o va tiven ess ... 12 1 7.1.6 Summary of Linking the MSDD to the Dimensions of Strategy...122
7.2 USING THE MSDD TO DEFINE EFFECTIVENESS MEASURES...124
7.2.1 E nsuring C om p leteness ... 124
7.2.2 Ensuring Consistency at all Organizational Levels...125
7.2.3 Ensuring Compatibility Within Manufacturing ... 125
7.2.4 A Set of Performance Measures Based on the MSDD...126
7.3 USING THE MSDD FOR BEHAVIOR AND STRUCTURE MODELING ... 137
7 .4 S U M M A R Y ... 13 7 CHAPTER 8 INTEGRATING THE MSDD INTO THE PROPOSED CORE PROCESS: EXAMINING TRADE-OFFS... 139
8.1 MODELING THE DECISION MAKERS' PREFERENCE STRUCTURE ... 140
8.1.1 P rioritizing A sp ects of Strategy ... 141
8.1.3 Including R equirem ents...144
8.1.4 Using the MSD Software Tool... 145
8.2 MAPPING FR/DP PAIRS TO STRATEGY AND REQUIREMENTS...147
8.2.1 Process for Generating the Ms and MR Matrices ... 148
8.2.2 Prioritizing Among Effectiveness Measures ... 151
8.3 MAPPING DESIGN ALTERNATIVES TO FR/DP/PM TRIPLETS... 154
8.3.1 Process for Generating the MD Matrix... 155
8.3.2 Using the MSD Software Tool...157
8.4 COMPARING DESIGN ALTERNATIVES...158
8.5 INTERPRETING THE RESULTS OF THE COMPARISONS...160
8.6 SUMMARY OF THE PROCESS FOR TRADE-OFF ANALYSIS...161
CHAPTER 9 EXAMPLES OF MODELS AND APPLICATIONS... 163
9 .1 O V E R V IEW ... 16 3 9.2 PRELIM IN A RY D ESIGN ... 163
9.2.1 Manufacturing Subsystem Configuration Design and Selection ... 163
9.2.2 Manufacturing Subsystem Configurations...164
9.2.3 Selection App roaches ... 169
9.3 AN EXAMPLE OF USING THE CORE PROCESS FOR PRELIMINARY DESIGN ... 172
9.3.1 Step 1: Manufacturing Strategy / Requirements Generation...175
9.3.2 Step 2: Defining Effectiveness Measures... 183
9.3.3 Steps 3 and 4: Defining Behavior and Structure Models... 185
9.3.4 Step 5: Trade-off A nalysis ... 189
9.3.5 S ensitivity A nalysis ... 19 0 9.3.6 P rocess Valida tion...192
9.3.7 Summary of the Preliminary Design Example... 194
9.4 MID-LEVEL DESIGN EXAMPLE ... 195
9 .4 .1 B a ckg ro u n d . ... 19 5 9.4.2 P roduct Inform ation ... 19 6 9.4.3 Step 1: Manufacturing Strategy and Requirements ... 196
9.4.4 Step 2: Defining Effectiveness Measures... 199
9.4.5 Steps 3 and 4: Defining Behavior and Structure Models...201
9.4.6 Step 5: Trade-off analysis ... 204
9.4.7 Interpreting the Results ... 204
9.5 SUMMARY / CONCLUSIONS...205
10.2 RECOMMENDATIONS FOR FUTURE WORK ... 209
10.2.1 The Manufacturing System Design Decomposition...209
10.2.2 Manufacturing Strategy...210
10.2.3 Performance Measurement...210
10.2.4 Behavior and Structure Modeling ... 211
10.2.5 Summary of Recommendations...211
APPENDIX A ... 212
A-1: MANUFACTURING SYSTEM DESIGN DECOMPOSITION (PAGE 1 OF 2)...212
A-2: LEAF FR/DP PAIRS...214
APPENDIX B ... 215
B-1: A GENERAL FORM OF THE MS MATRIX...215
B-2: Ms MATRIX FOR THE AXLE-MANUFACTURING SYSTEM DESIGN EXAMPLE...216
B-3: TEXT DESCRIPTIONS OF THE GENERAL FR/DP - STRATEGY RELATIONSHIPS...217
B-4: MR MATRIX FOR THE AXLE-MANUFACTURING SYSTEM DESIGN EXAMPLE...225
B-5: P MATRIX FOR THE AXLE-MANUFACTURING SYSTEM DESIGN EXAMPLE...226
B-6: MD MATRIX FOR THE AXLE-MANUFACTURING EXAMPLE ... 227
B-7: TEXT DESCRIPTIONS OF MD MATRIX ENTRIES ... 228
APPENDIX C ... 231
C-i: P MATRIX FOR CELL DESIGN EXAMPLE...231
C-2: MD MATRIX FOR THE CELL DESIGN EXAMPLE...232
GLO SSARY O F TERM S ... 233
List of Figures
Figure 2-1: Levels of strategy (adapted from Hayes and Wheelwright, 1984)...27
Figure 2-2: Non-price value -cost frontier (adapted from Porter, 1996)...28
Figure 2-3: Key elements of manufacturing competitiveness (Abernathy, Clark, and Kantrow, 19 8 1) ... 3 2 Figure 2-4: Framework for strategy (Duda et al., 1999b) ... 33
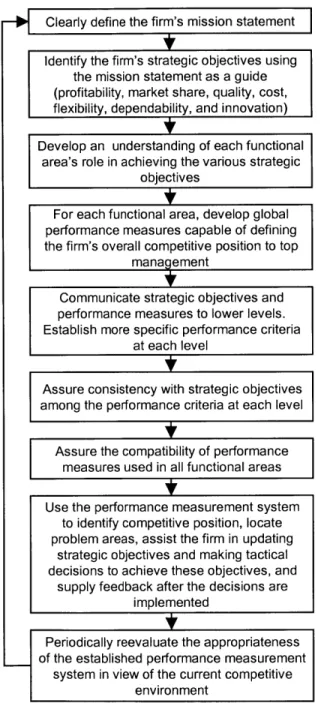
Figure 3-1: Performance measurement system design process (adapted from Wisner and F aw cett, 19 9 1) ... 39
Figure 3-2: The balanced scorecard (adapted from Kaplan and Norton, 1992)... 45
Figure 4-1: General model of the engineering design process ... 48
Figure 4-2: Manufacturing system -product matrix (adapted from Hayes and Wheelwright, 19 7 9 ) ... 5 1 Figure 5-1: Toyota Production System framework (TSSC, 1998)... 67
Figure 5-2: Toyota Production System framework (Monden, 1983)...68
Figure 5-3: "Lean" manufacturing system framework (Suzuki, 1999)...69
Figure 5-4: Hierarchy of objectives (Hopp and Spearman, 1996) ... 70
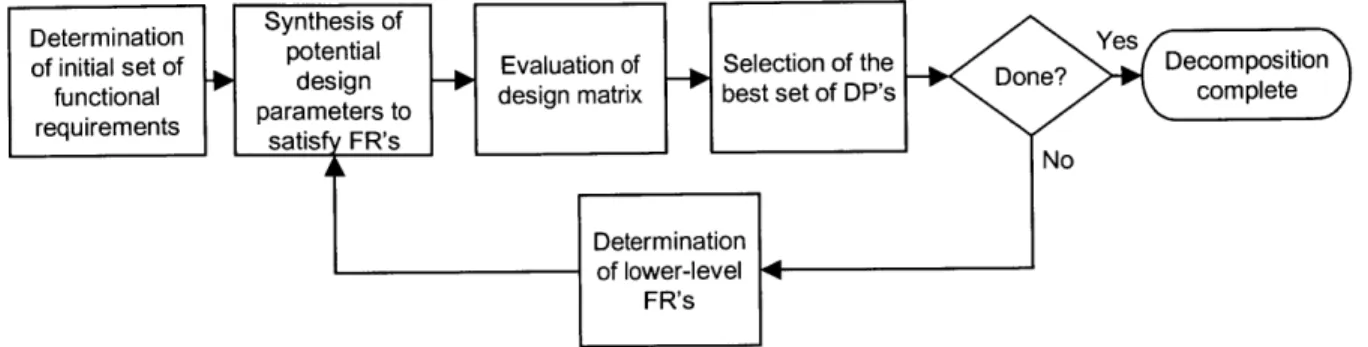
Figure 5-5: Axiomatic design decomposition process ... 73
Figure 5-6: Graphical representation of design matrix... 75
Figure 5-7: Manufacturing system design decomposition -Upper levels...80
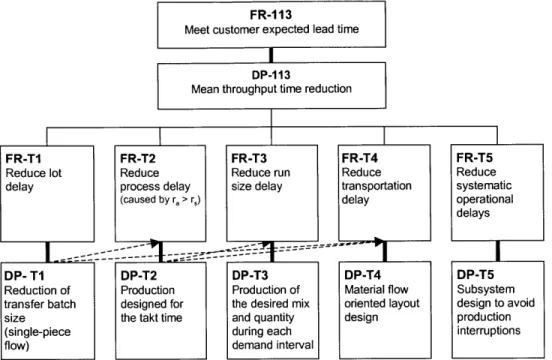
Figure 5-8: Decomposition of throughput time reduction into five delays ... 85
Figure 5-9: Lot delay exam ple ... 86
Figure 5-10: System state four minutes into the transportation time ... 87
Figure 5-11: Inventory due to run size delay... 88
Figure 5-12: Reduced inventory - reduced run size delay ... 89
Figure 5-13: Production state at the beginning of a shift ... 90
Figure 5-14: Production state four hours into the shift...90
Figure 6-1: Core systems engineering process (Oliver et al., 1997) ... 94
Figure 6-2: Process for trade-off analysis (Oliver et al., 1997)... 98
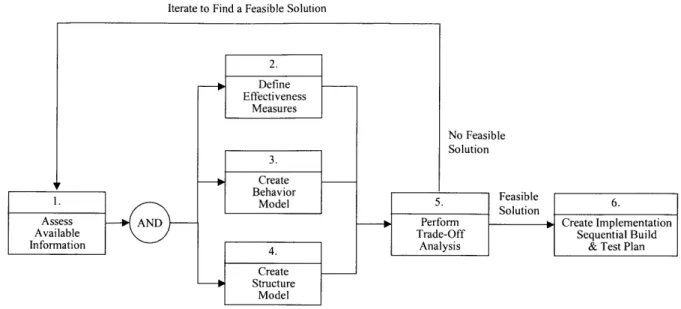
Figure 6-3: Core process applied to manufacturing system design... 100
Figure 6-5: Design team-focused view of behavior ... 106
Figure 6-6: System design-focused view of behavior ... 106
Figure 6-7: Applying the MSD process at different levels of detail ... 109
Figure 6-8: Value stream maps for two alternative system concepts...111
Figure 7-1: Using the MSDD to link strategy to system measurement and models ... 114
Figure 7-2: R elating the M SD D to cost...114
Figure 7-3: Relating the M SD D to quality...116
Figure 7-4: Relating the MSDD to delivery performance...116
Figure 7-5: Design equation for FR 111 - FR 113... 118
Figure 7-6: Relating the MSDD to product mix flexibility... 119
Figure 7-7: Relating the MSDD to volume flexibility ... 120
Figure 7-8: Relating the M SDD to innovativeness ... 121
Figure 7-9: Software tool showing mapping of strategy to MSDD ... 123
Figure 7-10: Window displaying strategy information for FR/DP Q-121 ... 123
Figure 7-11: General process for problem identification, communication, and resolution.... 130
Figure 8-1: Process for using the MSDD as an aid for trade-off analysis...140
Figure 8-2: Relating trade-off analysis to the core process... 141
Figure 8-3: Sample pairwise comparison matrix and weighting factors...142
Figure 8-4: Defining weights for objectives and requirements ... 145
Figure 8-5: Selecting relevant aspects of strategy using the software tool ... 146
Figure 8-6: An automatically generated comparison matrix...146
Figure 8-7: Software tool showing consistency check and calculated weights...147
Figure 8-8: One column of matrix Ms ... 149
Figure 8-9: A portion of an exam ple P m atrix ... 153
Figure 8-10: MSD software tool displaying the relative importance of each FR/DP/PM ... 154
Figure 8-11: Portion of an exam ple M D m atrix ... 155
Figure 8-12: Software tool showing mappings from design choice to FR/DP pairs...157
Figure 8-13: Software tool showing mappings from design choices to one FR/DP pair...158
Figure 8-14: Comparing multiple design alternatives ... 161
Figure 9-1: Suitable manufacturing configurations as a function of lot size (adapted from C hryssolouris, 1992)... 170
Figure 9-2: Framework for selecting a manufacturing system (Miltenberg, 1995) ... 171
Figure 9-3: Plant-w ide m aterial flow ... 173
Figure 9-4: Proposed material flow for new manufacturing system ... 174
Figure 9-5: Core manufacturing system design process...175
Figure 9-6: Pairwise comparison matrix and resulting weights ... 179
Figure 9-7: Changes to the general Ms matrix ... 180
Figure 9-8: Sample columns from the MR matrix ... 181
Figure 9-9: Overall relevance of FR/DP pairs with respect to strategic objectives ... 184
Figure 9-10: Overall relevance of FR/DP pairs with respect to the requirements ... 184
Figure 9-11: Portion of the M D m atrix ... 186
Figure 9-12: Matrices showing results of the comparison ... 189
Figure 9-13: Sensitivity scores ... 191
Figure 9-14: S matrix for validation example ... 193
Figure 9-15: Requirements for the validation example... 193
Figure 9-16: Comparison results for validation example ... 194
Figure 9-17: Part of the existing system for gear manufacturing... 196
Figure 9-18: Comparison matrix and the resulting weights and consistency measures...198
Figure 9-19: Non-zero portions of the MR matrix ... 199
Figure 9-20: Viewing the relative importance of the performance measures ... 200
Figure 9-21: Schematic view of a medium-sized cell ... 203
Figure 9-22: Non-zero rows of the MD matrix ... 204
List of Tables
Table 2-1: Competitive priorities (adapted from Rudberg, 1999)...29
Table 2-2: Manufacturing strategy decision categories (adapted from Hayes and Wheelwright, 19 8 4 ) ... 3 2 Table 3-1: Performance measures for each competitive priority ... 42
Table 3-2: Guidelines for effective performance measures ... 44
Table 7-1: High-level performance measures based on the MSDD... 127
Table 7-2: Quality performance measures based on the MSDD...128
Table 7-3: Performance measures for identifying and resolving problems based on the MSDD ... 1 2 9 Table 7-4: Direct performance measures for predictable output... 131
Table 7-5: Indirect performance measures for predictable output ... 132
Table 7-6: Performance measures for delay reduction...133
Table 7-7: Performance measures for direct and indirect labor costs ... 134
Table 8-1: Matrices used in the trade-off analysis process ... 140
Table 8-2: AHP judgment scale, adapted from (Saaty, 1994)...142
Table 8-3: Average values of the random index ... 143
Table 8-4: QFD WHAT vs. HOW relationship scale, adapted from (Prasad, 1998)...148
Table 8-5: Scale adapted for the proposed trade-off process ... 148
Table 8-6: QFD HOW vs. HOW correlation scale, adapted from (Prasad, 1998)...156
Table 9-1: Strategic objectives and requirem ents ... 178
Table 9-2: Key performance measures for axle manufacturing example... 185
Table 9-3: Strategic objectives and requirem ents ... 198
Table 9-4: Important performance measures for the cell design example ... 200
T able 9-5: D ifferent cell sizes ... 202
List of Acronyms
AGV: Automated Guided Vehicle AHP: Analytic Hierarchy Procedure CI: Consistency Index
CNC: Computer Numerically Controlled CR: Consistency Ratio
DP: Design Parameter
FMS: Flexible Manufacturing System FR: Functional Requirement
IDEF: Integrated computer-aided manufacturing DEFinition JIT: Just-In-Time
MRP: Manufacturing Resource Planning MSD: Manufacturing System Design
MSDD: Manufacturing System Design Decomposition MTTF: Mean Time to Fail
MTTR: Mean Time to Repair PM: Performance Measure
QFD: Quality Function Deployment ROI: Return On Investment
SPC: Statistical Process Control TPS: Toyota Production System TQM: Total Quality Management
Chapter 1
Introduction
In today's manufacturing environment, particularly in the automotive industry, there is a growing need for both managers and engineers to better understand how even low-level manufacturing system design decisions can impact a firm's ability to compete in an
ever-changing market. In recent decades, manufacturing firms have seen a growing emphasis placed on being responsive to the needs of the customer. Production costs must be kept low,
but customers are also demanding higher levels of quality, on-time delivery, and product variety. At the same time, product design life cycles are shortening, further increasing the need for responsive manufacturing system designs. As a company develops strategies for competing in a changing market environment, it must also develop the ability to design its manufacturing systems such that the manufacturing function will support the goals of the firm. Doing so can, however, be very difficult.
A manufacturing system can be defined as a collection of components (machines, equipment, people, etc.) bound by common material and information flow and working together to transform raw materials into marketable goods (adapted from Chryssolouris, 1992 and Wu, 1992). A typical automotive component manufacturing system includes a wide variety of operations, from metal forming processes to both manual and automated assembly operations. Integrating this variety of operations into one unified system that is capable of meeting all of the required demands requires effective communication among multiple disciplines and a methodology that enables the system designers to understand how design details interact and affect overall system performance.
1.1 Motivation: Problems in Existing Factories
Unsatisfactory manufacturing system performance often evolves as the result of a system design focus that is too localized, that is too narrow in scope, that is overly simplistic, that is on the means and not the ends, or that is otherwise not aligned to the firm's overall
manufacturing strategy. Historically, manufacturing systems and factories have tended to be designed in a somewhat ad hoc fashion, with each sub-system designed independently of all others. For example, in a factory involving both machining and assembly operations, it is frequently the case that the machining department was designed and implemented by a
completely different set of engineers and managers than those who might have designed and built a line to assemble the machined products. Furthermore, the machining department might be broken up into functional areas (i.e., a turning area, a grinding area, etc.) each of which is designed and managed by a separate group of people, possibly working under a different set of assumptions and goals. Shigeo Shingo stresses that such division leads to thinking with a limited view and to the optimization of operations rather than of the system as a whole (Shingo, 1988; Robinson, 1990). He emphasizes the value of systems-level thinking as a key contributor to successful manufacturing system design. Hopp and Spearman (1996) present a similar argument, describing this focus on local activities as a reductionist approach, where the focus is on breaking a complex system into its more simple components and then analyzing each component separately. They go on to point out that "too much emphasis on individual components can lead to a loss of perspective for the overall system," and that a more holistic approach can lead to better overall system performance.
The scope of different variables considered by the design team can critically impact system performance. In the previous example, each set of designers might only be thinking of optimizing their design in terms of local, easily measurable costs such as materials and direct labor. The result is that even though each sub-system might be designed to have a very high isolated efficiency or cost-effectiveness, the system as a whole could suffer from poor overall performance. This situation is sometimes referred to as the "Productivity Paradox," (Skinner, 1986) where performance measures for each department are increasing while the company's profitability declines.
Because of these problems, much effort has gone into trying to understand how to design manufacturing systems in a way that will result in the many subsystems and components working together to achieve the overall goals of the firm. Unfortunately, the difficulties inherent in designing a manufacturing system are sometimes dealt with through the proposal of seemingly simple solutions. For example, Zipkin (1991) describes the "romantic" view often taken towards the design of manufacturing systems. Terms such as "Just-in-time," "kanban," "lean," and "agile" are used to represent generic solutions to contemporary manufacturing problems. These solutions are often presented as being simple, trade-off-free
systems that can quickly and profoundly improve all aspects of operations. Schonberger (1990) describes kanban as "something that can be installed between any successive pair of
processes in 15 minutes, using a few containers and masking tape." However, efforts to implement such systems have often met with much resistance and even complete failure and rejection in industry. Although a kanban system can, perhaps, be installed in 15 minutes,
designing the manufacturing system in a way that will allow the kanban system to produce the desired results can be much more time-intensive and challenging.
This tendency towards buzzword solutions rests on the belief that there exists one "right" manufacturing and performance measurement system design solution, and that once this "best" practice is implemented, the firm's problems will be solved. In some cases, a small set of design "rules" is generated to describe this "best" practice. As a result, the focus often is placed on implementing specific "tools" and following the "rules," while the reasons why these tools are useful get lost or are not effectively communicated or even understood (Zipken, 1991; Hopp and Spearman, 1996; Cochran, 1999).
The work proposed in this thesis takes the view that designing a multi-disciplinary system with several interacting components in a way that supports a specific set of strategic
objectives is not a simple task and is not a task that can be accomplished by following just a few simple rules. The view taken here is that trade-offs will always exist in manufacturing system design, and that the best a firm can do is to clearly define a manufacturing strategy (i.e., a plan for how to create and maintain a competitive advantage) and then carefully and consistently make decisions and trade-offs that are consistent with this vision. The work herein is aimed at developing an approach to help managers and engineers better understand the relationships between a firm's manufacturing strategy, its performance measurement
system, and its manufacturing system design in order to facilitate the design of manufacturing systems aligned to high-level objectives.
1.2 Relation of Performance Measurement to Manufacturing System Design Often, the design difficulties described above can be traced to the discrepancy between an organization's manufacturing strategy and its system for performance measurement. The importance of effective performance measures in a manufacturing environment is well
documented. Measures of performance are critical to a company's success, as these measures not only monitor how well that company has performed, but also determine the direction of the company's future. Engineers will focus on making changes that will improve system
performance relative to these measures, and it is therefore critical that these performance measurements be aligned with the company's overall manufacturing strategy. In this way, performance measures function as a means for communicating strategic objectives throughout the organization. As a result, there exists a strong link between performance measurement and system design. Unfortunately, as the conditions in which manufacturing organizations operate have changed, methods for measuring system performance have often remained static.
Even when an organization desires to align its performance measurement with its manufacturing strategy, it is not always clear how to do so. Traditionally, managers have made manufacturing system design decisions based on attempts to quantify all performance factors in terms of costs. Financial measures such as return on investment and net present value can then be used to compare various alternatives. However, trying to accurately calculate such a figure can be extremely difficult and subject to debate. Factors such as quality and inventory can be particularly hard to quantify in terms of dollar figures. What is the cost of business lost due to poor quality or long lead times? How much new business would be gained with increased responsiveness and predictability? With the recognition of these challenges has come a tremendous increase of interest in developing more complete systems for performance measurement, with many measures remaining in non-financial terms. However, decision-making based on traditional cost accounting methods disregards such "intangibles" in favor of more easily measured financial data such as labor costs (Maskell, 1991). As a result, there is a need to understand how both financial and
non-financial performance measures can be incorporated into the decision-making process, so that systems can be designed to meet the goals of the company.
1.3 Problem Statement
To summarize, there is a need among manufacturing firms to ensure that manufacturing system design decisions are made so as to support the overall objectives of the firm. Doing so requires that
" Performance measures are aligned to the firm's strategic objectives
" Trade-offs regarding the performance of multiple design alternatives relative to these objectives and measures are understood
The performance measurement system used plays an important role in this communication. Once a company determines its competitive strategy (i.e., the basis on which it plans to compete: lowest cost, highest quality, excellent customer responsiveness, etc.), all decisions made at lower, operational levels (i.e., decisions regarding the details of the manufacturing
system design) must support these high-level objectives. By better understanding how
changes in the manufacturing environment and in the firm's manufacturing strategy create the need for changes in the manufacturing system design, and, correspondingly, how changes in
the manufacturing system design can either facilitate or prevent achievement of strategic objectives, managers and engineers will be better equipped to design and/or redesign factories to capitalize on changing market conditions.
1.4 Scope of Research
The goal of this research is to develop a design process that will enhance the ability of manufacturing managers and engineers to:
" Develop an effective set of performance measures aligned to the strategic objectives of the firm
" Assess the performance of manufacturing system design alternatives with respect to multiple evaluation criteria
" Develop both a qualitative and quantitative understanding of the design trade-offs faced
* Understand how these design decisions affect the system's ability to meet strategic objectives
In order to achieve this goal, a model of the manufacturing system design process is proposed. This model is based on a general process for the design of complex systems developed in (Oliver et al., 1997). A structured process for trade-off analysis is then developed to aid designers in identifying and analyzing the strengths and weaknesses of alternative system designs. An axiomatic design decomposition of a general set of functional requirements (FR's) and design parameters (DP's) for a manufacturing system is used to provide a formal means for relating a firm's strategy to its performance measurement system and to its manufacturing system design decisions. This manufacturing system design
interrelationships among the many elements of a manufacturing system design and for tracing the relevance of detailed design parameters to high-level system objectives.
Matrices are formed to express the relationships between strategic objectives, FR's and DP's, and the design alternatives. Combination of these matrices results in the generation of a comparison matrix showing the relative strengths and weaknesses of each design alternative. A software tool is developed to assist designers in managing, visualizing, and communicating the information required for this trade-off analysis. Examples of the application of this
process to the design of manufacturing systems at an automotive component supplier are reviewed. This software tool can help system designers to understand and to quantify the performance of different design alternatives with respect to the overall goals of the firm, allowing them to better design manufacturing systems to achieve the desired performance.
1.5 Organization of Thesis
This thesis begins with a review of background material and previous research performed in the key areas related to this work: manufacturing strategy, performance measurement, and manufacturing system design. Manufacturing strategy research is reviewed in Chapter 2 to show how manufacturing strategy fits in with the overall objectives of a company and to define a set of competitive priorities that comprise a strategy. Research on performance measurement for manufacturing is then reviewed in Chapter 3, with a focus on the
characteristics of an effective performance measurement system, the process for developing a system for performance measurement, and the characteristics of effective measures. Next, in Chapter 4, a generalized process for engineering design is reviewed. The application of this process to the design of manufacturing systems is discussed and observations are made regarding manufacturing system design practices observed in industry.
The next part of the thesis (Chapter 5-Chapter 9) presents a systems engineering-based approach to manufacturing system design, using an axiomatic design-based decomposition to link manufacturing strategy, performance measurement, and system design. First, the
development of this decomposition is discussed (in Chapter 5) including a review of similar frameworks and the axiomatic design process used to develop it. The upper levels of this decomposition are then reviewed. Chapter 6 proposes a general model of the manufacturing
engineering process is reviewed and its specific application to manufacturing system design is presented. The role of the manufacturing system design decomposition is then discussed in Chapters 7 and 8, with a particular emphasis on how the decomposition can be used to aid designers in thinking about manufacturing strategy, in developing a set of performance measures that will be consistent with this strategy, and in examining the trade-offs among design alternatives. Chapter 9 then presents detailed examples of the application of the proposed manufacturing system design process to illustrate its use and the role of the decomposition as a decision support tool.
Chapter 10 concludes the thesis, summarizing the work performed, the manufacturing system design process proposed, and the utility of the manufacturing system design
Chapter 2
Manufacturing Strategy
2.1 Overview
This thesis will draw from several areas of prior study, including applications of systems engineering and optimization, performance measurement, and manufacturing system design. All of this work can, however, be seen as just a small part of a much larger whole in the research on manufacturing strategy. This chapter will begin by reviewing manufacturing
strategy as a larger context for this research. Although a large body of work exists in each of the previously mentioned fields, a unified look at the connections between manufacturing
strategy, performance measurement, and manufacturing system design is lacking. This chapter provides a summary of research in manufacturing strategy. The following two chapters will
review the relevant literature in performance measurement and engineering design.
2.2 Introduction
Manufacturing strategy has been an important area of research since the publication of Wickham Skinner's 1969 paper on the subject. Although a great deal of work has been done since then in terms of understanding manufacturing strategy and the critical role it can play in the success or failure of a company, many issues remain unresolved. Consensus has been reached in the literature with regard to some aspects of manufacturing strategy while other aspects remain open to much debate. This chapter seeks to review the existing body of research on manufacturing strategy and to present a unified framework for thinking about its different components, in terms of both process and content. Additionally, it is hoped that this chapter will enhance the reader's understanding of how the research presented in this thesis fits into and contributes to the field of manufacturing strategy as a whole.
It would be useful to start by providing a definition of strategy in the context of manufacturing. Unfortunately, no clean and simple definition has been settled upon in the literature. Many authors note that the word strategy is used so often and so generally that it has lost much of its specific meaning. In efforts to define manufacturing strategy, researchers often choose to list its characteristics and to describe its nature. Hayes and Wheelwright
(1984) describe the following five characteristics as being representative of a strategy in a business or manufacturing setting:
Time horizon: Strategic activities involve an extended time horizon in terms of both
implementation and impact.
Impact: Strategic decisions will have a significant impact, although it may
take a long time to materialize.
Concentration of effort: An effective strategy requires focusing on a limited set of pursuits,
implicitly implying a reduced focus on other activities.
Pattern of decisions: Most strategies require that a series of a certain type of decisions be
made over time. These decisions must be supportive of each other and follow a consistent pattern.
Pervasiveness: A strategy involves a wide range of activities, requiring that all
levels of an organization act in a mutually reinforcing manner.
Others (e.g., Fine and Hax, 1985 and Porter, 1996) describe the goal of a strategy: the development and securing of a long-term, sustainable competitive advantage. With this rather vague definition in mind, this chapter first presents some ideas on the process of strategy formation followed by a more detailed discussion on the content of a manufacturing strategy and a framework for thinking about manufacturing strategy as part of a firm's overall strategy.
2.3 Hierarchy of Strategies
Historically, beginning with the work of Skinner (1969), manufacturing strategy formation has been viewed as a hierarchical, top-down process. This process has been
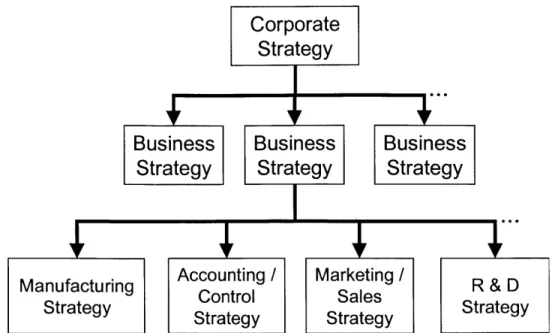
described as an "ends-ways-means" approach (Hayes, 1985) in that it starts with defining the ends to be achieved (i.e., the corporate-level objectives) then defines a plan or strategy (i.e., the "ways") for achieving these objectives, and concludes by determining the appropriate "means" for implementing the strategy. Examples of this basic top-down approach abound in the literature (Porter, 1980; Fine and Hax, 1985; etc.). One of the more widely recognized examples of a top-down approach to manufacturing strategy development is that developed by Hayes and Wheelwright (1984) and shown in Figure 2-1.
Corporate
Strategy
Business
Business
Business
Strategy
Strategy
Strategy
Manufacturing
ManfatungControl
Accounting! MarketingSalesR&D
R&DStrategy Stre Sateg Strategy
Strategy J1Strategy
Figure 2-1: Levels of strategy (adapted from Hayes and Wheelwright, 1984)
2.3.1 Corporate Strategy
Top-down approaches such as the one shown in Figure 2-1 generally begin with the definition of a corporate strategy. Andrews (1980) describes corporate strategy as "the pattern of decisions in a company that determines and reveals its objectives, purposes, or goals. [It] defines the businesses in which a company will compete, preferably in a way that focuses resources to convey distinctive competencies into competitive advantages." Creating such a strategy involves defining the mission of the firm, the range of business it is to pursue, and the nature of the contribution it intends to make to its various stakeholders. Corporate objectives may also be defined with respect to company growth, survival, profit, return on investment, or other financial measures (Hill, 1994).
2.3.2 Business Strategy
At the middle level of the hierarchy are the strategies for each business unit within the firm. These business strategies define (1) the scope of the business (what segments of the market will be addressed) and (2) the basis on which the business will achieve and maintain a competitive advantage. The second part of business strategy, defining the business'
competitive position, involves deciding on a position relative to several competitive priorities. Porter (1996) describes strategic positioning as emerging from three distinct but possibly overlapping sources: variety, needs, and access. Variety-based positioning is positioning
based on the choice of products or services to be offered. Needs-based positioning focuses instead on providing goods and/or services to meet the needs of a particular subset of customers. Access-based positioning segments customers based on various dimensions of product or service accessibility (geographical, internet-based, rural/urban, etc.).
Essentially, Porter and many others argue, the key to defining a position of strategic advantage lies in making decisions regarding the trade-offs among the various dimensions of competition. Porter uses the concept of the production frontier to illustrate this point (see Figure 2-2). This "frontier" represents the maximum value that a company can deliver at a given cost. A desirable strategic position would represent one point on this frontier. Shifting from one point to another would represent a change in strategy based on a change in the relative importance of cost and non-price value (Porter, 1996).
high "Productivity Frontier" (state of best practice)
5)
low
high Relative Cost Position low
Figure 2-2: Non-price value - cost frontier (adapted from Porter, 1996)
In reality, the problem of positioning is somewhat more complex, as there exist more than two dimensions to think about. Although it seems that each researcher defines his or her own set of competitive priorities to consider, there is a large degree of agreement regarding the key areas of importance. A literature survey by Leong et al. (1990) revealed a consensus on an appropriate set of five categories of competitive priorities: cost, quality, delivery performance, flexibility and innovativeness. Table 2-1 presents an overview of these five categories and some of the sub-categories discussed in the literature (Miltenburg, 1995; Fine and Hax, 1985; Hayes and Wheelwright, 1984; Miller and Roth, 1994; Rudberg, 1999).
Table 2-1: Competitive priorities (adapted from Rudberg, 1999) Category of Competitive Priority Sub-categories
Cost Quality
Manufacturing products with high conformance and performance
Delivery Performance Dependability
Speed of delivery
Flexibility Volume
Primary emphasis is on volume and Product mix
product mix flexibilities Change-over
Modification Rerouting Material Sequencing
Innovativeness Product
Ability to quickly introduce new Process
products/processes
Once competitive priorities have been determined, a firm must decide how to configure its resources so as to best support this position. Although defining the relative importance of the various dimensions allows for an infinite number of possibilities, empirical studies have shown that most businesses can be classified as having a configuration selected from a very limited set of 3-10 choices (see, for example, Miller and Ross, 1994; Ward et al., 1996; Richardson et al., 1985; or Kotha and Orne, 1989). Even though each researcher presents a different set of configurations, there are some basic trends across the literature.
Configurations can be divided into three basic categories, as presented by Stobaugh and Telesio (1983): technology-driven, market-intensive, and low cost. With a technology-driven configuration, the firm's focus is on providing high-tech products using the newest process technology. In these firms, time-to-market and strong research and development groups are of the highest importance. With a market-intensive configuration, the firm aims to keep a particular group of customers happy. This is achieved with superior delivery performance,
high conformance quality, and some degree of process, product, and volume flexibility. Finally, with a low-cost configuration, the company focuses on minimizing production costs with less emphasis on product variety and process flexibility. Each configuration results from a set of decisions made on how to develop capabilities and allocate resources so as to compete in a specific portion of the market. Choosing a configuration primarily involves selecting a limited set of competitive priorities (i.e. 1 or 2) to focus on above all others.
2.3.3 Functional Strategies
At the third level of Hayes and Wheelwright's hierarchy of strategies lie the functional strategies. Potential areas for functional strategies include marketing and sales,
manufacturing, R&D, distribution, field maintenance, etc. In the traditional top-down
approach, the role of the functional strategies is to support the decisions made at higher levels. As with higher-level strategies, a functional strategy requires a consistent pattern of decisions, and a central idea is that different business strategies will necessitate different patterns of decisions. In other words, trade-offs exist among the various possible decisions, and no one solution can satisfy the requirements of all possible strategies (Porter, 1996). Before
discussing in more detail the content of a manufacturing strategy, it is important to note that linkages exist among the various functional strategies. The result is that functional strategies cannot be developed in isolation of one another. Instead, a strategic fit should be sought among different functional areas (Porter, 1996). Porter defines three levels of strategic fit: consistent, reinforcing, and optimization of effort. These levels of fit represent the degree to which activities are aligned across an organization. A consistent fit "ensures that the
competitive advantages of activities cumulate and do not erode or cancel themselves out. It makes the strategy easier to communicate to customers, employees, and shareholders, and improves the implementation through single-mindedness in the corporation." (Porter, 1996) With a reinforcing fit, activities in some functional areas are designed to support activities in other areas. For example, decisions might be made in marketing to steer demand towards the mix of products that manufacturing is most adept at producing. In the ideal case, a firm would
achieve optimization of effort, where functional groups work together to reinforce behavior and activities leading towards the achievement of strategic objectives.
2.3.4 Manufacturing Strategy
As described previously, the manufacturing function is viewed as one potential area of competitive advantage, and a manufacturing strategy is therefore an important functional element of a company's strategy. Once the higher-level steps of market positioning and business configuration have been considered, a firm can focus on defining what each
functional area must do to achieve the desired strategic fit. In the case of the manufacturing functional area, Skinner (1969) refers to this step as defining the "manufacturing task," where doing so involves describing what must be accomplished by manufacturing in order to
compete. Reinforcing the existence of trade-offs in manufacturing system design, Hayes and Wheelwright state that an effective manufacturing strategy is not necessarily the one
promising maximum production efficiency, but is the one that best supports the business strategy. Recognizing that manufacturing encompasses a wide range of decisions, Abernathy, Clark, and Kantrow (1981) developed a framework (shown in Figure 2-3) for viewing the challenges faced by manufacturing managers.
Hayes and Wheelwright build upon this framework, stating that effective manufacturers focus their efforts on making improvements at the "micro" level (i.e., quadrants 3 and 4) rather than trying to blame problems on factors in quadrant 1 or 2. Additionally, they state that although quadrant 3 issues usually receive the most attention, several companies have leveraged quadrant 4 strengths to create a lasting competitive advantage. They go on to refine the "micro" level decisions into the categories shown in Table 2-2.
The "structural" categories shown in Table 2-2 are generally viewed as being long-term, high-impact decisions that require a significant investment and effort to implement.
"Infrastructural" decisions are regarded as being more "tactical" in nature as they typically involve a myriad of smaller ongoing decisions. Shi and Gregory (1998) added seven new categories to this list. New structural categories included geographic dispersion, horizontal coordination, and vertical coordination. New infrastructural categories presented were dynamic response, transfer of knowledge, management information system, and network capability building. Clearly, interactions exist among the various decision categories, and a good manufacturing strategy is defined as being one that is consistent, both internally (decisions do not conflict with one another) and externally (decisions support higher-level
strategies). Good manufacturing strategies are also measured by their ability to contribute to business strategy, directing attention to opportunities and providing the needed capabilities.
Structure ("hardware")
Infrastructure
("software")
Figure 2-3: Key elements of manufacturing competitiveness (Abernathy, Clark, and Kantrow, 1981)
Table 2-2: Manufacturing strategy decision categories (adapted from Hayes and Wheelwright, 1984)
Decision Category Decision Variables
Structural
Capacity Amount, timing, type
Facilities Size, location, focus
Process Technology Equipment, automation, linkages Vertical Integration Direction, extent, balance
Infrastructural
Manufacturing planning and control Computerization, centralization, sourcing
Quality Defect prevention, monitoring, intervention
Organization Structure, reporting levels, control
Workforce Skill level, wage policies, employment security Macro
(country)
Micro (company)
1. 2.
Fiscal/tax policies Culture
Monetary policies Traditions
Trade policies Religion
Industrial policies Values
Capital markets Social behavior
Political structure Organized labor
3. 4.
Business Market Selection Measurement and control systems Plant and equipment decisions Workforce policies
Capacity Vendor relationships
Facilities Management selection and
Process technology development policies
Vertical Integration Capital budgeting systems Organizational structure
2.4 A Unified Framework for Strategy
Reviewing the recent literature, it becomes clear that several different perspectives exist regarding manufacturing strategy. Researchers discuss capabilities, activities, configurations, positioning, fit, marketing, operational effectiveness, and a variety of other topics. While on the surface it may seem that some of these ideas are contradictory, these views can also be seen as complementary components of a larger framework. This framework, illustrated in Figure 2-4, was developed to bring together the disparate views found in the literature and to unite them with a common structure and vocabulary (Duda et al., 1999b).
The framework for strategy shown in Figure 2-4 was developed based on that of Hayes and Wheelwright (1984, see Figure 2-1) with some key modifications made to reflect additional concepts in manufacturing strategy. Although the top-down flow of strategies is preserved, this framework also shows the feedback necessary for the iterative nature of the strategy development process. This framework also emphasizes the importance of achieving strategic fit across the many different and separate functional areas.
Capab
Corporate
''~ - Strategy
Business Strategy
Positioning Configuration
ilities Cross-Functional Integration (Strategic Fit)
LR&D Product S Other
Continuous Improvement
As with Hayes and Wheelwright's framework, the framework shown in Figure 2-4 represents a process beginning with the development of a corporate level strategy to
determine the overall objectives of the company and, at a high level, how it intends to
compete in its various businesses. With a corporate strategy in place, a more specific strategy for each business unit can be developed. Although Figure 2-4 shows only one business strategy, a large corporation might be split into several business units, each with its own distinct strategy. As described previously, developing a business strategy involves defining a desired market position in terms of trade-offs among factors such as cost, conformance quality, product features, delivery performance, flexibility, etc. Choosing such a position
leads naturally to the definition of a basic business configuration and an organizational structure aimed at meeting the business' strategic objectives. At this level, a firm might decide, for example, that it wants to build an organization capable of providing a specialized product or service with a focus on a particular subset of customers. Alternatively, a firm might decide to offer a very wide range of products to a much larger segment of the market. In either case, the key is that the company chooses the basis on which it will compete and aligns its organizational structure according to this decision. The next step in the top-down process described in Figure 2-4 is the development of a cross-functional fit across activities performed in various branches of the business. In the context of this thesis, the focus will be on the manufacturing area and how decisions made here can support business-level objectives. One important feature of this framework is that it highlights the roles of continuous improvement and capabilities development in the overall strategy development process. Although some might claim that continuous improvement is a strategy in and of itself, several researchers argue that continuous improvement is most valuable to a company when it is focused on supporting a well-defined business strategy (Pilkington, 1998; Hayes and Pisano,
1994). In other words, continuous improvement activities should be performed to support and build upon a business' strategic objectives. This process of improving manufacturing and increasing competitive advantage leads naturally to the development of improved internal capabilities. By developing strong internal capabilities, some companies have been able to maintain an advantage over competitors in the same market position simply by executing that same strategy more effectively (Hayes and Upton, 1998). Hayes and Pisano (1994) stress the importance of the development of strategic capabilities within an organization, stating that
focusing on a few key areas of improvement and expertise can help to provide a firm with a competitive advantage and some strategic flexibility to continue to perform well in the face of changing market conditions and an evolving business strategy. In the framework presented here, this concept is represented by the feedback from manufacturing and other functional
areas to business strategy via capabilities development. The process of strategy development is iterative, and a company's strategy is sure to be re-evaluated and modified over time. Clearly, the strength of internal capabilities is an important factor to consider when contemplating a shift to a new position in the market.
2.5 Summary and Conclusions
This chapter has presented a brief review of the literature in manufacturing strategy. The focus has been on how manufacturing strategy fits in as part of a firm's top-down approach to defining overall objectives and the means to achieve them. An important topic covered was the review of different categories of competitive priorities (cost, quality, delivery
performance, flexibility, and innovativeness). The relative importance and the objectives set for each of these competitive priorities are important parts of a firm's strategy. The
fundamental basis of manufacturing strategy is making decisions regarding the relative importance of each competitive priority, as such decisions determine how the firm will compete in its marketplace.
There are some researchers who disagree with this view of strategy, claiming that by effectively imitating the "best practices" of lean manufacturing and the Toyota Production System a firm can overcome trade-offs and simultaneously achieve optimal performance with respect to all aspects of strategy (Schonberger, 1986; Womack and Jones, 1996; Johnson and Br6ms, 2000). This debate about the existence of trade-offs stems at least in part from the difficulty in trying to separate differences in strategy and prioritization from differences in execution. For example, it has been claimed that Toyota has been able to outperform its competitors in terms of cost, quality, flexibility, and delivery performance through superior manufacturing system design (Womack et al., 1990). Toyota's outstanding performance demonstrates that it has achieved excellent execution of its manufacturing goals, but achieving a high level of performance does not mean that trade-offs have been eliminated. Could Toyota further improve its product quality at the expense of higher cost? Could costs