Publisher’s version / Version de l'éditeur:
Journal of the Soil Mechanics and Foundations Division, 95, SM4, pp. 949-967,
1969-09-01
READ THESE TERMS AND CONDITIONS CAREFULLY BEFORE USING THIS WEBSITE. https://nrc-publications.canada.ca/eng/copyright
Vous avez des questions? Nous pouvons vous aider. Pour communiquer directement avec un auteur, consultez la
première page de la revue dans laquelle son article a été publié afin de trouver ses coordonnées. Si vous n’arrivez pas à les repérer, communiquez avec nous à [email protected].
Questions? Contact the NRC Publications Archive team at
[email protected]. If you wish to email the authors directly, please see the first page of the publication for their contact information.
NRC Publications Archive
Archives des publications du CNRC
This publication could be one of several versions: author’s original, accepted manuscript or the publisher’s version. / La version de cette publication peut être l’une des suivantes : la version prépublication de l’auteur, la version acceptée du manuscrit ou la version de l’éditeur.
Access and use of this website and the material on it are subject to the Terms and Conditions set forth at
Field studies of response of peat to plate loading
Forrest, J. B.; MacFarlane, I. C.
https://publications-cnrc.canada.ca/fra/droits
L’accès à ce site Web et l’utilisation de son contenu sont assujettis aux conditions présentées dans le site
LISEZ CES CONDITIONS ATTENTIVEMENT AVANT D’UTILISER CE SITE WEB.
NRC Publications Record / Notice d'Archives des publications de CNRC:
https://nrc-publications.canada.ca/eng/view/object/?id=c2403e29-0f27-49dd-9ddb-c51b8f8c8115
https://publications-cnrc.canada.ca/fra/voir/objet/?id=c2403e29-0f27-49dd-9ddb-c51b8f8c8115
N 2 l r 2
no. 412
'
c .
2
I
BLDG
NATIONAL
RESEARCH
COUNCIL
OFCANADA
CONSEIL
NATIONAL
DERECHERCHES
DLJCANADA
FIELD STUDIES OF RESPONSE OF PEAT TO
PLATE LOADING
BY
J. B. FORREST AND I. C. MACFARLANE
REPRINTED FROM
J O U R N A L O F T H E S O I L MECHANICS A N D FOUNDATIONS DIVISION ASCE. VOL. 95. NO. S M 4 . PROC. PAPER 6 6 5 2
JULY 1 9 6 9 . P. 949
-
967RESEARCH PAPER NO. 4 1 2
O F THE
DlVlSlON OF BUILDING RESEARCH
PRICE 25 CENTS
OTTAWA
ETUDES SUR P L A C E DE L A R E P O N S E DE L A TOURBE CONSOLIDEE S OMM AIR
E
L e s a u t e u r s p r C s e n t e n t l e s r 6 s u l t a t s d e s r e c h e r c h e s m e n 6 e s s u r p l a c e s u r l e s c a r a c t g r i s t i q u e s d e d e f o r - m a t i o n d ' u n e t o u r b e m o l l e d a n s l e v o i s i n a g e d ' u n e s o l u t i o n d e continuit6 du c h a r g e m e n t . 11s c o m p a r e n t l e s d i f f 6 r e n c e s d e t a s s e m e n t s u r p l a c e e t a u l a b o r a - t o i r e , a i n s i q u e l e s v i t e s s e s d e c h a r g e m e n t , l e s t a s - s e m e n t s o b s e r v 6 s e t l a diminution d e s p r e s s i o n s i n - t e r s t i t i e l l e s . L e s a u t e u r s 6 t u d i e n t e n s u i t e b r i g v e m e n t l e s l i m i t a t i o n s de l a t h 6 o r i e l i n e a i r e d e 1161asticit6.6652 July, 1969
A
!-J'z
5
D
SM 4Journal of the
SOIL MECHANICS AND FOUNDATIONS DIVISION
Proceedings of the American Society of
Civil
Engineers
FIELD STUDIES O F RESPONSE O F PEAT TO PLATE
LOADING^
By J. B. Forrest,' and I. C. MacFarlane
P e a t s a r e among the worst kinds of foundation m a t e r i a l that may be en- countered. Because of their extremely compressible nature in t h e i r natural state and their low s h e a r strengths, they a r e often unsuitable f o r supporting s t r u c t u r e s of any kind. Methods of dealing with construction over peat include such techniques a s : (1) Replacing the peat with inorganic m a t e r i a l s ; (2) c a r r y - ing the foundation supports down t o a better s t r a t u m ; o r (3) some f o r m of stabilization o r improvement of the peat properties in situ, such a s preloading. As the last-named method i s often the l e a s t expensive, i t h a s r e c e i v e d much attention of late, particularly with r e g a r d t o highway projects where very l a r g e a r e a s of peat o r organic s o i l s a r e encountered. The preloading technique consists essentially of subjecting the in situ peat t o a load in ex- c e s s of that t o be imposed by the final s t r u c t u r e . In t h i s way, settlements equal t o the expected magnitude underthe final loading, a r e s e c u r e d relatively quickly; the e x c e s s load i s then removed and the s t r u c t u r e completed. Efficient u s e of this technique r e q u i r e s the ability t o predict in advance t h e behavior of peat with particular reference to: (1) The final settlements to be expected under different loads; (2) the r a t e s a t which such settlements will occur; and (3) the strength c h a r a c t e r i s t i c s of the soil, a s these control the allowable loading. The f i r s t two considerations a r e controlled primarily by the consolidation c h a r a c t e r i s t i c s of the peat. Consolidation and i n c r e a s e i n s h e a r strength a r e related through r a t e of p o r e p r e s s u r e dissipation. Consolidation of a saturated s o i l i s a time-dependent volume reduction involving a d e c r e a s e in the water content of the soil. Any s o i l i s a s y s t e m of two o r t h r e e spatially co-existent phases: a solid phase; a liquid phase; and
Note.-Discussion open until December 1, 1969. To extend the closing date one month, a written request must be filed with the Executive S e c r e t a r y , ASCE. T h i s paper i s p a r t of the copyrighted J o u r n a l of the Soil Mechanics and Foundations Division, P r o - ceedings of the American Society of Civil Engineers, Vol. 95, No. SM4, J u l y , 1969.
Manuscript was submitted f o r review f o r possible publication on F e b r u a r y 9, 1968.
a Presented at the October 16-20, 1967, ASCE National Meeting on Water Resources Engineering, held a t New York, N.Y.
l R e s e a r c h Assoc. Engr., Univ. of New Mexico, Albuquerque, N.M., g u e s t worker with Div. of Building R e s e a r c h , Natl. R e s e a r c h Council of Canada, S u m m e r , 1966.
R e s e a r c h Officer, Soil Mech. Section, Div. of Building R e s e a r c h , Natl. Research Council of Canada, Ottawa.
950 July, 1969 SM 4 s o m e t i m e s (particularly f o r peat), a g a s phase. When t h e r e i s an i n c r e a s e of p r e s s u r e on such a s y s t e m i n equilibrium, t h e r e is a volume change with a n excape of fluid f r o m the s y s t e m . This p r o c e s s of volume reduction (consolida- tion) involves a t i m e lag.
Consolidation of inorganic s o i l s is thought t o be divided into two s t a g e s : the p r i m a r y consolidation stage (described by the classical concept of T e r - zaghi); and the secondary consolidation (or compression) stage. The t i m e lag in the p r i m a r y consolidation stage i s associated with the dissipation of e x c e s s pore w a t e r p r e s s u r e s and r e s u l t s f r o m the r e s i s t a n c e t o volume change offered by the escaping water. The t i m e lag in the secondary com- pression stage i s assoicated with plastic flow o r creep, and, in effect, i s due t o r e s i s t a n c e offered by the "solid" phase t o volume change i n the system.
, 0 0 1
0 1.0 2.0 3.0 4.0 5.0 6.0 7.0
C O N S O L I O A T I O N P R E S S U R E , K C I S Q CM
FIG. 1.-COEFFICIENT O F CONSOLIDATION VERSUS CONSOLIDATION PRESSURE The approach t o the consolidation p r o c e s s of peat has been generally s i m i - l a r t o that f o r clays that exhibit exceptionally l a r g e secondary compression effects. Most investigators have been preoccupied with the need t o obtain immediate r e s u l t s and have relied on this concept. A l i t e r a t u r e review (13)' clearly indicates that the two-stage concept of consolidation, one terminating
at a clearly defined point and the other continuing f o r a long period of t i m e , leaves something t o be desired with reference t o peats. The point a t which p r i m a r y consolidation ends and secondary compression begins i s obscure in most c a s e s .
Because application of the classical (Terzaghi) consolidationtheoryutilizes
Numerals in parentheses r e f e r to corresponding itenis in the Appendix I.-
SM 4 PLATE LOADING 951 curve fitting techniques (22), which require determination ofthe point of 100% p r i m a r y consolidation, the standard consolidation t e s t u s e d f o r inorganic s o i l s i s much m o r e difficult to i n t e r p r e t when used f o r peat. The shortcomings of t h i s theory when applied t o organic s o i l s a r e emphasized in Fig. 1, where val- ues of the (Terzaghi) coefficient of consolidation, c , (calculated using measured values of vertical permeability), have been plotted against consoli- dation p r e s s u r e f o r a sample of fibrouspeat. The extreme variation of c , with applied p r e s s u r e below 1.5 kg p e r s q c m i s p r i m a r i l y due to the d r a s t i c changes in coefficient of permeability, k, with consolidation. It i s within t h i s range of s t r e s s e s (below 1.5 kg p e r s q c m ) that most loadings applied to peat may be expected t o fall. S i m i l a r r e s u l t s have been reported by L e a (10). Although s o m e s u c c e s s has been reported (6,20) in predicting the magni- tudes of peat settlement f r o m laboratory results, other w r i t e r s (14,16,17,24) have not been able t o support t h i s claim. The prediction of r a t e s of settlement on the basis of laboratory work h a s proved an even m o r e difficult problem (1, 4,6,7,11,15,20).
The complexity of the consolidation r a t e phenomena i s illustrated by the work of Lake (8,9), Root (18) and Brawner (2), a l l of whom found that sand d r a i n s did not significantly affect the r a t e of settlement of peat although they did i n c r e a s e the r a t e of e x c e s s p o r e water p r e s s u r e dissipation. Consolidation and p o r e p r e s s u r e dissipation a r e directly related, however, in the c l a s s i c a l theory of consolidation.
It would appear, therefore, that the techniques available within the p r e s e n t framework of soil mechanics a r e not completely satisfactory when applied t o peats; the stress-strain-hydrodynamic relations f o r peats r e q u i r e f u r t h e r in- vestigation. This should deal not only with the s o i l behavior under usual con- ditions, s u c h a s unidimensional and hydrostatic compression, but should a l s o examine response interrelationships under the conditions occurring in the vicinities of loading boundaries. The pore p r e s s u r e distributions s e t up n e a r applied loads and their dissipation patterns should a l s o be observed.
This paper r e p r e s e n t s the r e s u l t s of a s m a l l - s c a l e field investigation c a r r i e d out on a 10-ft thick s t r a t u m of peat. R a t e s and magnitudes of settle- ment occurring a t different depths beneath a confined surface loading were measured. P o r e p r e s s u r e s w e r e recorded a t various points throughout the loaded peat s t r a t u m , and r a t e s of pore p r e s s u r e dissipation were compared with r a t e s of consolidation and loading. Field r e s u l t s were compared with r e s u l t s obtained f r o m a limited number of laboratory consolidation t e s t s .
SOIL CONDITIONS
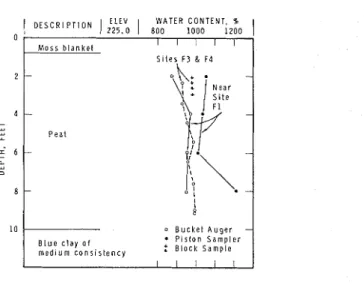
The s i t e s chosen f o r the field t e s t s were n e a r Ottawa, in a confined muskeg a r e a of general muskeg classification EI-FI, according t o the Radforth Sys- t e m (12). The soil profile i s shown in Fig. 2. The actual t e s t s i t e s w e r e char- acterized by low woody s h r u b s intermixed with patches of hummocky m o s s e s and s h o r t g r a s s e s . The loading t e s t s were conducted on g r a s s y FI muskeg, underlayed by nonwoody fine fibrous peat with specific gravity of solids of about 1.41 and organic content of f r o m 87% t o 93%. Variation of water content with depth, f o r different locations throughout the t e s t a r e a , i s shown in Fig. 2.
July, 1969
I
D E S C R l P T l O N1 :;l,VO
I
W A T E R ' O N T E N T ' % BOO 1000 12001
0 M o s s b l a n k e t I I I I I S i t e s . F 3 & F 4 - P e a t - 0 B u c k e l A u g e r B l u e c l a y a f P l s l o n S a m p l e r m e d i u m c o n s i s t e n c y:
B l o c k S a m p l e1
FIG. 2.-SOIL PROFILE IN THE VICINITY O F FIELD TESTS
off when the peat s a m p l e s were d r i e d a t 105" C f o r 2 days, to the dry weight of m a t e r i a l remaining.
TEST EQUIPMENT AND INSTRUMENTATION
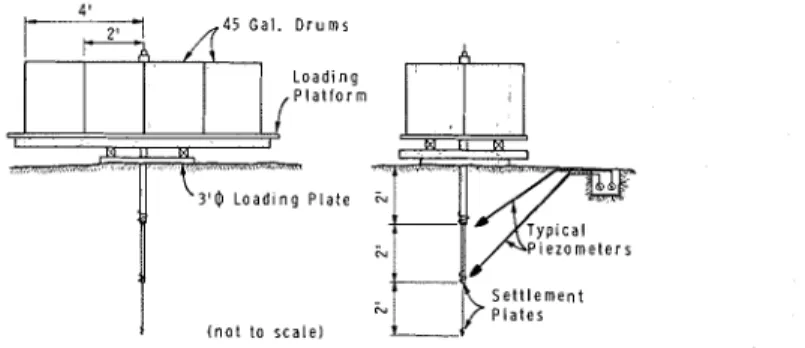
Loading.-Loads were applied t o the muskeg s u r f a c e through a 36-in.
diam c i r c u l a r wooden plate which supported a platform carrying eight 45-gal d r u m s (Fig. 3). The load was applied in two increments. The f i r s t increment, consisting of the weight of the plate, which supported the platform and 45-gal
drums, amounted t o approximately 0.037 kg p e r s q cm (76 psf). The second
increment of loading was applied by pumping the b a r r e l s full of water, thus
increasing the a v e r a g e contact p r e s s u r e by about 0.254 kg p e r sq c m (520 psf),
f o r a total load of approximately 0.291 kg p e r sq c m (596 psf).
Deformation Measurements .-Settlement was measured a t four elevations: a t the ground s u r f a c e ; and a t depths of approximately 2 ft, 4 ft, and 6 f t directly below the center of the plate. The gages (Fig. 3) were made up of t h r e e telescoping pipes with helical plates 2 in., 3 in., and 4-1/2 in. in diam- e t e r welded on t h e i r ends. Elevations were r e a d periodically with a p r e c i s e level a t the tops of the settlement r o d s and on the platform.
T o determine the effects of loading on the muskeg s u r f a c e surrounding the plate, two types of r e f e r e n c e pins were used. Large-diameter-head s t e e l pins, 4 in. long, w e r e placed flush with the top of the m a t in the vicinity of the loading plate and elevations w e r e taken periodically on the tops of these pins. During loading, regular observations were a l s o made of the tilting of s e v e r a l 3-ft long s t e e l lltilt" pins inserted 2 ft into the mat, 2.5 f t and 4.5 ft f r o m the center of the loading plate.
P o r e P v e s s u r e Measurements.-Pore p r e s s u r e s w e r e measured a t various locations beneath the plate, both during and a f t e r load application. "Geonorn piezometers, shortened t o one-third their initial effective lengths, w e r e pushed into the muskeg f r o m outside the periphery of the plate. The spacing of
SM 4 PLATE LOADING 9 53
piezometers was a follows: one each a t depths of 2 ft, 4 ft, and 6 ft under t h e
center of the plate; and one each a t depths of 2 ft and 4 ft under the p e r i m e t e r of the plate. The piezometers were connected by 1/4-in. nylon tubing t o Bourdon gages a t the muskeg surface, thus providing an essentially constant volume system. These nylon tubes w e r e kept completely buried in the peat, up t o the place where they entered a waterproofed wooden box which housed the gages.
This box enabled the gages to be situated below the water table, preventing them f r o m being subjected t o a negative gage p r e s s u r e , which might have brought any dissolved a i r in the p r e s s u r e s y s t e m out of solution. An additional benefit of placing the gages and gage lines below the groundwater table was the provision of a degree of insulation which wouldminimize t e m p e r a t u r e effects. Piezometer readings were observed only in conjunction with the second load
4 ' i- 93 "45 G a l . D r u m s 3 ' 0 L o a d l n g P l a t e N P l e z o m e l e r s S e t t l e m e n t P l a t e s ( n o t t o s c a l e 1
FIG. 3.-LOADING ARRANGEMENT AND INSTRUMENTATION
increment, a s the initial platform load was insufficient t o generate measurable p o r e p r e s s u r e s .
TEST PROCEDURES
Four field t e s t s , numbered F 1 t o F4, w e r e c a r r i e d out a t intervals of 3 weeks t o 2 months. The procedure was a s follows: the plate w a s placed on the muskeg s u r f a c e ; the settlement gages and piezometers placed in their d e s i r e d locations with r e f e r e n c e t o the plate; and the initial readings taken.
F o r loading t e s t s F 1 and F2, the loading plate was placed directly on the upper m o s s mat. T o exclude the compressionof this m a t e r i a l f r o m that of the peat proper, in t e s t s F 3 and F4 the living m o s s m a t was removed and the loading plate placed on a 2-in. thick cushion of sand laid over the r a w peat. The platform and 45-gal d r u m s w e r e then placed on the plate. After about 3 days, when settlement under the platform load had virtually ceased, the second load increment was applied by pumping the b a r r e l s full of water. Because i t was n e c e s s a r y t o pump water f r o m different s o u r c e s for the different load t e s t s , loading t i m e s for the second increment of loading varied considerably. C a r e had t o be taken during the loading procedure to avoid un- balancing the platform, which could r e s u l t in tilting, and eccentric load distribution.
9 54 July, 1969 SM 4 p r e s s u r e gage readings were taken every 5 min. After pumping was completed, readings were taken a t increasingly longer intervals, depending upon the r a t e of variation of the quantities being observed. Only field t e s t F 1 in- cluded an unloading and reloading cycle.
RESULTS
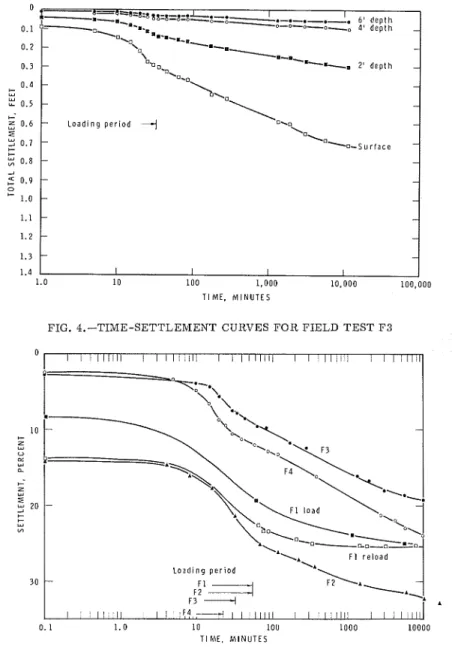
Defor?natio~zs.-Typical plots of settlement against time, after the s t a r t of major load application, a r e shown i n F i g . 4. The curves in this figure denote the settlments occurring during t e s t F3, a t four locations initially a t depths of 0 ft, 2 ft, 4 ft, and 6 f t beneath the center of the plate. The settlements do not s t a r t f r o m z e r o a t v e r y s m a l l t i m e s because the settlement that o c c u r r e d during the initial platform loading period i s included, whereas the t i m e s c a l e r e p r e s e n t s only the length of time following the s t a r t of the application of the second load. The period of loading i s a l s o shown in Fig. 4. The inclusion of the initial settlement with the settlement that occurred under the major load increment i s followed throughout t h i s paper.
In Fig. 5, the percentage settlement in the 0-ft t o 2-ft layer, during a l l four field t e s t s , i s plotted against the time a f t e r major increment of load application began. Settlement h e r e i s given a s a percentage of l a y e r thick- n e s s . The marked differences between the c u r v e s f o r t e s t s F 1 and F2 a s com- pared with t e s t s F 3 and F4 a r e due to the inclusion of the moss mat in the f o r m e r . Results f o r the 2-ft to 4-ft and the 4-ft t o 6-ft deep l a y e r s show l e s s difference and s o have been omitted f r o m Fig. 5. A reloading cycle c a r r i e d out during t e s t F 1 i s recorded in Fig. 5.
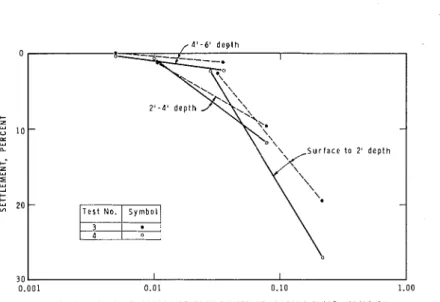
The a v e r a g e values of vertical s t r e s s under each load increment f o r each of the consolidating l a y e r s . i.e., 0 f t to 2 f t , 2 f t t o 4 ft, and 4 ft t o 6 ft, under the center of the plate, have been approximated by the linear theory of e l a s - ticity. The a v e r a g e s t r e s s occurring in each layer, assumed to be the calcu- lated vertical s t r e s s a t mid-depth, h a s been plotted in Fig. 6 against the final deformation of that l a y e r f o r t e s t s F 3 and F4.
Fig. 7 consists of plots, f o r t e s t F2, of surface settlement a t different t i m e s v e r s u s distance f r o m the centerline of the loading plate. Table 1 shows the change in inclination of thetwo s t e e l tiltpins placed 1 ft and 3 f t f r o m the edge of the plate. This figure shows that the s u r f a c e of the muskeg, in the vicinity of the plate, d e p r e s s e s under the effect of the plate loading, and that this effect d e c r e a s e s outward f r o m the plate. This behavior i s f u r t h e r demonstrated by that of the pins (Table I ) , which lean inward during loading but tend to regain their original straight position during rebound. T h e s e r e s u l t s indicate p r i - marily delayed elastic, a s opposed t o plastic, deformation of the surface of the peat in the vicinity of the plate. The membrane effect that the moss m a t
,
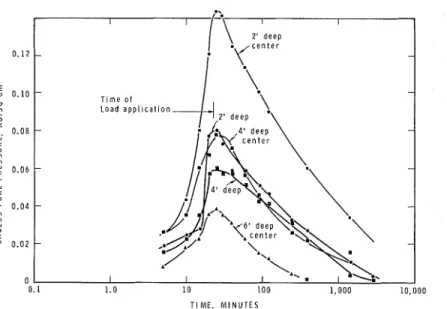
might be expected t o exhibit may account largely f o r this.Po)*e Pressuves.-Pore p r e s s u r e s f o r field t e s t F4 a r e shown in Fig. 8 f o r piezometers placed approximately 2 ft, 4 ft and 6 f t beneath the center of the ,
loading plate, and 2 f t and 4 ft below i t s edge. Loading time for t h i s t e s t i s a l s o indicated on the figure. Fig. 9 shows pore p r e s s u r e r e s u l t s , in t e s t s F3 and F4, f o r positions under the center of the loading plate. F o r field t e s t F4, a s h o r t e r loading period than f o r t e s t F3, resulted in higher p o r e p r e s - s u r e s . A s a l l piezometer readings reached t h e i r maximum values a t the s a m e time, i.e., immediately following the completion of loading, these readings
PLATE LOADING
FIG. 4.-TIME-SETTLEMENT CURVES FOR FIELD TEST F 3
-8:8 ~ % : % = d = E = ~ = ~ d
.-.-.-.
1
.
6 ' d e p t hI
L o a d i n g p e r i o d \ 0.1 0.2 0.3 0.4 u 0.5 0.6 .? 3 0.7 b- b-:
0.8 2 2 0.9 0 1.0 1.1 1.2 1.3 1.4 0. 1 1.0 10 100 1000 l o o 0 0 T I ME. M I N U T E S -D \ ~-"-..,,
..-.-.-.
--~-o-o-o-~ 4' d e p t h - --.-.
- 1.-._ - om o .-a-rn ? ' d e p t h - . n . o - -0 - - - - L o a d i n g p e r i o d+
0.0 - ' 0 - "ia-~urlace - - - - - - - - - - - - - I I I IFIG. 5.-TIME-SETTLEMENT CURVES FOR 0-FT-2-FT DEEP PEAT LAYER FOR
FIELD TESTS F1 TO F4
1.0 1 0 100 1,000 10,000 100,000
July, 1969
FIG. 6.-SETTLEMENT VERSUS CALCULATED AVERAGE VERTICAL STRESS FOR INDIVIDUAL SOIL LAYERS UNDER FIELD TESTS F 3 AND F 4
0 ,- Z y 1 0 LL u m t- Z u
5
t t ; 20 3 01
I 1 I I I II
1.0 2.0 3.0 4.0 5.0 6.0 D I S T A N C E F R O M P L A T EF
, FEETFIG. 7.-SETTLEMENT O F GROUND SURFACE DUE TO APPLIED LOADS TESTS F 2
0.001 0.01 0.10 1.00 V E R T I C A L I E L A S T I C I S T R E S S B E N E A T H C E N T E R O F L O A D I N G P L A T E . K G l S Q C M - - T e s t N o . S y m b o l 3 1 . 4 l o I I
SM 4 PLATE LOADING 957
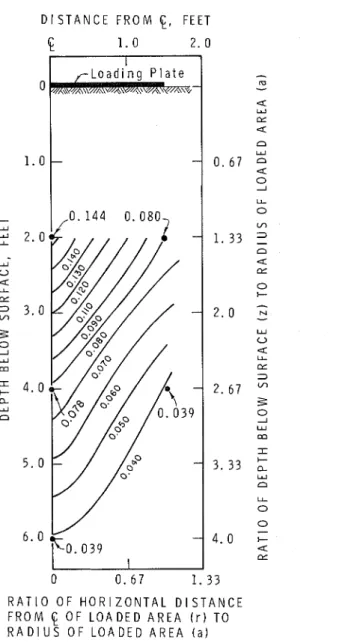
were used to examine the excess p o r e water p r e s s u r e that developed through- out the peat. Contours f o r t e s t F4, basedupon these values, a r e shown in Fig.
10.
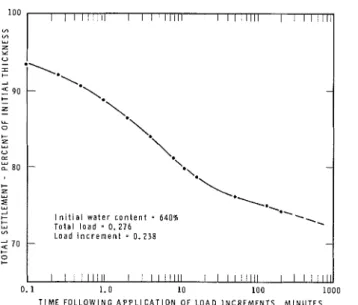
Laboratory Tests.-Seven oedometer-type consolidation t e s t s w e r e con- ducted f o r comparison with the field tests. The consolidation specimens w e r e 2.8 in. in d i a m e t e r and about 1 in. in thickness. Typical laboratory r e s u l t s a r e given in Figs. 11, 12and 13. Fig. 11 shows a typical settlement-time curve f o r a peat sample subjected to a l o a d increment corresponding to that of the major load increment applied in the field. Fig. 12 indicates the dissipation of pore water p r e s s u r e with t i m e under the load increment of Fig. 11. The peat s a m - ple f o r this t e s t was taken withapiston s a m p l e r f o r 3 ft below ground surface in the vicinity of field t e s t F1.
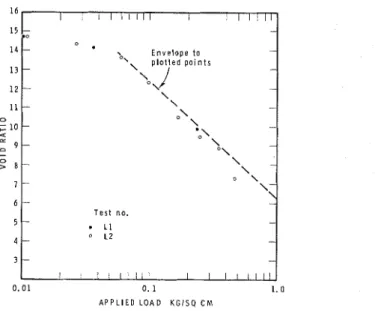
In Fig. 13, the void r a t i o i s plotted against applied vertical p r e s s u r e f o r two specimens taken f r o m a block sample s e c u r e d in the immediate vicinity of t e s t s i t e s F 3 and F4. P o r e p r e s s u r e s w e r e not measured during these t e s t s . One consolidation t e s t , which will be denoted L1, was conducted using load increments s i m i l a r to those applied t o the muskeg surface in t h e field;
another t e s t , L2, was c a r r i e d out using v e r y s m a l l load increments, in an attempt t o d i s c e r n if any influence resulted f r o m different r a t e s of loading. The best straight line fit t o the plotted points of t e s t L2 r e p r e s e n t s a f a i r - ly good approximation f o r the region of the virgin consolidation curve. The slope of this line compares favorably with the slope of a line drawn through the two points of t e s t L1. The effect of s a m p l e disturbance i s t o move these lines to the left; consequently, it i s appropriate t o d r a w a straight line enve- lope to the plotted points of Fig. 13. The slope of this envelope r e p r e s e n t s the best approximation of the compression index, C,, a s determined by laboratory tests f o r the peat a t s i t e s F 3 and F4.
T A B L E 1.-INWARD INCLINATION OF V E R T I C A L TILT PINS, IN DEGREES
EXAMINATION O F PROGRAM
This investigation was a pilot p r o g r a m designed to study the compression properties of peat by s m a l l - s c a l e field loading, and to evaluate instrumenta- tion techniques. The limitations imposed by this approach a r e : (1) Only a s m a l l region of the peat l a y e r was s t r e s s e d ; (2) the assumption of simple un- dimensional compression, even under the center of the plate, is not s t r i c t l y t r u e ; and (3) the rigidity of the plate p r e s e n t s an inconsistency with r e s p e c t
T i m e
(3)
Platform in place Barrels filled
1 day after loading
4 days after loading
11 days after loading 1 day after unloading
Location From Center Line O f Loading Plate
2-1/1 ft o f f center ( 1 ) 0 3 G 7-1/2 8 4 4-1/2 ft o f f center (2) 0 1 2 2 2 1
July, 1969 SM 4
TIME. MINUTES
FIG. 8.-PORE PFLESSUFE DISSIPATION A T POINTS UNDER CENTER AND EDGE O F
P L A T E DURING FIELD TEST F 4
0.1 1.0 10 100 1,000 10.000
TIME. MINUTES
FIG. 9,-PORE PFLESSURE DISSIPATION A T POINTS UNDER CENTER O F P L A T E
P L A T E LOADING D I S T A N C E F R O M
$,
F E E T'i
1 . 0 2 . 0 0 R A T I O O F H O R I Z O N T A L D I S T A N C E F R O M$
O F L O A D E D A R E A( r )
T O R A D I U S O F L O A D E D A R E A ( a )FIG. 10.-CONTOURS O F EXCESS P O R E W A T E R PRESSURE, I N KILOGRAMS P E R SQUARE CENTIMETER, DURING T E S T F 4 (AT COMPLETION O F LOADING)
July, 1969
FIG. 11.-TYPICAL SETTLEMENT-LOG TIME CURVE F O R LABORATORY
CONSOLIDATION T E S T S 100 m m LU Z Y U
:
J 4 9 0 + - Z - L L 0 + 2 LU U = :so + 2 LU5
+ + L., m $ 7 0 C 0 + 1 I l l l l l l l I l I l l l l i l I l l l l l l l l 1 I l l l l l l-\.
-\.
-1
.
\.
\.
-\. \.
-\*\.
1. I n i t i a l w a t e r c o n t e n t = 6 4 0 8 .*. \ T o t a l l o a d = 0. 276..
L o a d i n c r e m e n t-
0.238 - -+
u
0.1 1.0 I0 100 1000FIG. 12.-PORE PRESSURE DISSIPATION F O R TYPICAL LABORATORY CONSOLIDATION T E S T S T I M E F O L L O W I N G A P P L I C A T I O N OF L O A D I N C R E M E N T S . M I N U T E S 0.28 0.24.- io,20 Y 0.16 L., m = m 4 A
::
0.12 n L., E 0 0.08 0.04 I l l l l l l l I I I r l l l l l i l I l l l l l l I l l I I I I T I n i t i a l w a t e r c o n t e n t = 6 4 0 8 I n i t i a l l o a d = 0.038 k g l s q c m -\
L o a d i n c r e m e n t = 0.238 k g l s q c m - - - - - - - - - I I I l l l l l l I l l l l l l l l I I l l l l l l l I l l l l l l L *\ *\ 0.1 1.0 10 100 1000 T I M E , M I N U T E SSM 4 PLATE LOADING 961 t o the s t r e s s calculations, which were basedupona uniformly distributed s u r - face load.
On the positive side, however, the limited extent of the loaded surface: (1) Permitted a m o r e detailed t r e a t m e n t of the behavior of the peat-matrix in the boundary a r e a s of plate loading; (2) emphasized the effects of field loading r a t e s on p o r e p r e s s u r e dissipation; and (3) permitted, because of the f a s t s y s t e m response, m o r e information t o be s e c u r e d in a s h o r t period of time. The settlement gages and the pore p r e s s u r e measuring s y s t e m appeared to p e r f o r m quite satisfactorily. The l a r g e s u r f a c e a r e a s of the piezometers ( a s compared with the negligible volume changes required t o obtain readings on the Bourdon gages) r e s u l t e d i n satisfactory gage response. The only diffi- culty experienced with the settlement gage occurred a t the 6-ft depth, a t l a t e r stages of settlement, when the movements were very small. A slight tendency
T e s t no.
.
L 1 0 L 2 - 0 . 0 1 0 . 1 1 . 0 A P P L I E D L O A D K G l S O ChlFIG. 13.-VOID RATIO-LOG PRESSURE RELATIONSHIP F O R LABORATORY
CONSOLIDATION T E S T S
f o r the deepest r e f e r e n c e section t o "hang up" was overcome by maintaining a l a y e r of g r e a s e between the telescoping gage sections. The rapidity with which the field p o r e p r e s s u r e s were dissipated, indicated that closer control of the field loading r a t e would be desirable, a s t h i s p r e s e n t s an additional variable.
The combined response of soil l a y e r s that have variations in initial mois- t u r e content, preconsolidation p r e s s u r e , and possible other incongruencies a r e shown in Fig. 6. Although t h i s figure contains e r r o r s associated with an elastic approximation of s t r e s s , i t indicates (roughly) the relation between
settlement and load that exists in the field. If one t a k e s a smooth envelope to
the plotted points of Fig. 6 ( a slope of approximately 24O/0 settlement p e r log cycle of s t r e s s , and if typical values a r e used, e.g., initial water content of
962 July, 1969 SM 4 950%, a specific gravity of solids of 1.40, and a d e g r e e of saturation of 95%), the equivalent compression index, C,, a s defined i n s o i l mechanics l i t e r a t u r e , i s found t o be approximately 3.5. On the other hand, the laboratory value f o r the C,, a s determined f r o m the envelope t o the plotted points of Fig. 13, i s about 6.2. This l a t t e r value falls within the range of values determined during an extensive but a s yet unreported laboratory p r o g r a m c a r r i e d out a t the Division of Building R e s e a r c h , National R e s e a r c h Council of Canada by the second writer. The laboratory specimens used to produce the c u r v e s of Fig. 13 w e r e s e c u r e d in the immediate vicinity of the field t e s t s which supplied the data f o r Fig. 6. This wouldindicate that, f o r t h i s particular peat, total settlements predicted on the b a s i s of laboratory work might be about double those t o be expected in the field. Similar r e s u l t s were reported by Brawner (3).
The t i m e the load i s permitted t o remain on the soil before deformation readings a r e taken is obviously a c r i t i c a l factor. The deformations in Figs. 6 and 13 were observed following loading periods of 2 days f o r t h e laboratory t e s t s and 2 weeks f o r the field t e s t s . The total settlements observed during both the field and laboratory t e s t s w e r e about 135% of the settlements ob- s e r v e d during the periods of dominant e x c e s s p o r e p r e s s u r e dissipation. The plots in Figs. 4 and 5 a r e somewhat i r r e g u l a r , but not significantly different f r o m the typical laboratory curve in Fig. 11. These plots show s i m i - l a r response c h a r a c t e r i s t i c s for the peat a t different levels below the loaded s u r f a c e ; the only effect of depth i s t o reduce the magnitudes of response. Neither most of the laboratory c u r v e s nor the field plots of F i g s . 4 and 5 suggest an obvious division of settlement into p r i m a r y and secondary phases. The differences in r a t e s of settlement, a s denotedin Fig. 5: can be partly ex- plained by differences in applied loading r a t e s ; however, the slight variations in c h a r a c t e r of settlement f o r the different loads may be explained largely on the b a s i s of the incongruities of the in situ peat m a t e r i a l .
If the log-time curve-fitting method (22) w e r e appliedto the c u r v e s of Fig. 5, times of 100% p r i m a r y consolidation would be indicated, coinciding roughly with t i m e of field loading completion, which actually r e p r e s e n t s t i m e of max- imum pore p r e s s u r e s . The unloading and reloading cycle c a r r i e d out in t e s t F 1 indicates that rebound of about two-thirds the settlement that occurred un- d e r the major load increment i s recoverable. (The period of unloading was equal in t i m e t o the loading period.) The magnitude of settlement upon reloading approaches very nearly that experienced under the initial loading cycle. Thus, the behavior of the peat h a s s o m e of the c h a r a c t e r i s t i c s of delayed elasticity. The significance of t h i s very limited experiment i s to suggest that the most efficient u s e of the preloading technique would minimize the t i m e between
removal of the preload and completion of the final s t r u c t u r e .
Figs. 8 and 9 show pore p r e s s u r e dissipation during field testing t o be con- centrated over a period of about 3,000 minafter the commencement of loading. The p o r e p r e s s u r e s build up during the loading period, r e a c h their maximum value a t completion of loading, and then d e c r e a s e . The response curves of these figures a r e s i m i l a r in shape t o those reported by Lake (8).
Figs. 8 and 9 indicate that the shapes of the pore p r e s s u r e and log-time plots a r e s i m i l a r throughout the peat depth, t h e i r main difference being a d e c r e a s e in pore p r e s s u r e magnitude with depth. This a g r e e s with the s i m i - larity noted between the settlement and log-time plots f o r the different peat l a y e r s . No significant changes in the slopes of the settlement and log-time
SM 4 PLATE LOADING 963
plots of Figs. 4 and 5 occur a t t i m e s corresponding t o completion of e x c e s s
pore p r e s s u r e dissipation.
The differences between the magnitudes of the pore p r e s s u r e s generated in field t e s t s F 3 and F4 appear t o be due t o the difference in t i m e of load appli- cation. The e x c e s s p o r e p r e s s u r e s g e n e r a t e d i n f i e l d t e s t F4 a r e approximate- ly double those generated during field t e s t F3, and show a much m o r e pronounced "peakingn effect.
The lack of ally discernible tendency f o r pore p r e s s u r e response f r o m piezometers a t depth t o lag behind those n e a r e r the surface, would indicate that drainage under the particular conditions of these t e s t s i s p r i m a r i l y hori- zontal. This suggests that the peat a t a given time i s essentially a t the s a m e degree of consolidation throughout i t s depth. Thus, the fact that the field settlement c u r v e s of Figs. 4 and 5 do not lend themselves to choosing a n apparent division point between c l a s s i c p r i m a r y and secondary p h a s e s can- not be explained on the b a s i s of different d e g r e e s of consolidation occurring throughout the compressible l a y e r a t any given time.
This a l s o indicates how infrequently c a s e s will occur wherein r a t i o s s u c h a s those derived f r o m the so-called U s q u a r e lawn can be employed to r e l a t e t i m e of consolidation of peat in the field t o t i m e in any one-dimensional lab- o r a t o r y test. Incidentally, s o m e w r i t e r s have indicated that if a relationship of this nature can be established, then the exponent i s c l o s e r t o 1.5 (11). Therein the fact that no retardation of response in p o r e p r e s s u r e dissipation was experienced with depth, prevented of course, any scaling between t h e field r e s u l t s and the laboratory t e s t s completed to date.
The preceding explanation postulates a predominantly horizontal drainage. This probability i s strengthened by the observation that the permeability of
peat in the horizontal direction is generally much g r e a t e r than that in the
v e r t i c a l direction (5,15).
Fig. 10 i s based on measured p o r e p r e s s u r e s recorded whenload application f o r test F4 was completed. The contours a r e necessarily interpolated between points of measured pore p r e s s u r e and therefore do not exactly r e p r e s e n t the actual p o r e p r e s s u r e s between points of measurement. They do s e r v e , how- ever, a s a reasonably good indication of pore p r e s s u r e distribution.
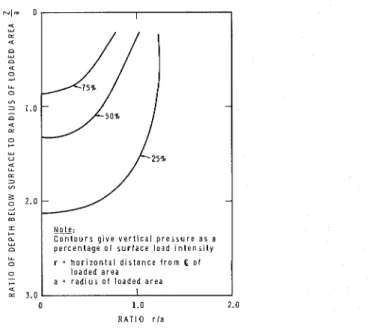
In Fig. 14 contours of constant vertical s t r e s s distribution, beneath a uni- formly loaded flexible c i r c u l a r foundation, resting upon an e l a s t i c half-space, a r e plotted. Although this does not precisely fit the field loading situation, the complexities of determining the s t r e s s e s a t some depth under a rigid plate make a m o r e a c c u r a t e treatment unjustified within the l i m i t s of t h i s investigation.
P o r e p r e s s u r e p a r a m e t e r
B
(21), relating i n c r e a s e i n p o r e p r e s s u r e t o in-c r e a s e in applied vertical p r e s s u r e , was not known forJhis particular peat a t
the time of the t e s t project.Assuming a value of 1 f o r B (which would be con-
sidered reasonable f o r normally consolidated clays), the e x c e s s p o r e p r e s - s u r e s generated in the peat due to the v e r t i c a l p r e s s u r e i n c r e a s e would be expected (before any drainage occurred) to equal the vertical s t r e s s a t that point. This a s s u m e s that the major principal s t r e s s and vertical s t r e s s coin- cide. This theoretically o c c u r s only under the center of the plate, but consid- ering t h i s inconsistency, only f u r t h e r emphasize the conclusions drawn. Thus, assuming undrained conditions, the s h a p e s of the contours of constant vertical s t r e s s in Fig. 14 would be expected t o correspond somewhat to those of t h e e x c e s s pore p r e s s u r e contours in Fig. 10.
964 July, 1969 SM 4 Comparison of the shapes of the contours shown in Fig. 10 with those of Fig. 14 reveals that the contours of the latter have much flatter inclinations. This i s possibly a result of f a s t e r dissipation of excess pore water p r e s s u r e occurring near the surface than a t depth. As Figs. 8 and 9 indicate similar times of pore p r e s s u r e dissipation throughout the depth of the peat layer, an explanation, purely on the basis of vertical drainage, of the steepness of the pore p r e s s u r e contours would appear unjustified.
The calculated vertical s t r e s s increases (using Fig. 14) that occur under the loading plate due t o loading, when compared with the measured excess pore pressures, show the generated pore p r e s s u r e to be in excess of the vertical s t r e s s e s calculated by the elastic theory. This trend becomes more apparent with depth, with the ratio of measured excess pore p r e s s u r e to cal- culated vertical s t r e s s increase approaching 2, a t a depth of 6 ft. This might
0 1.0 2.0
R A T I O r l a
FIG. 14.-CONTOURS O F CONSTANT VERTICAL STRESS IN HOMOGENEOUS ISO- T R O P I C ELASTIC SEMI-INFINITE MEDIUM WITH UNIFORMLY DISTRIBUTED LOAD O F D I A M E T E R 2 a ACTING UPON SURFACE [FROM SCOTT (19)l
indicate that in this material the s t r e s s applied a t the surface extends to a much g r e a t e r depth than that indicted by the elastic theory. The effect of the stiffer clay layer a t a depth of 10 f t is not considered sufficient t o cause such a l a r g e discrepancy.
A possible explanation f o r this might be Terzaghi's local shear hypothesis (23). This t e r m , "local s h e a r n i s used to explain such failures a s , f o r example, that caused by excessive settlement directly below a footing, but i s not associated with complete rupture of the supporting material. Regions of confined (local) s h e a r occur near the edges of the footing and large com- pressions occur in the material immediately beneath the footing base. This would result in a situation somewhere between that of unidimensional com-
SM 4 PLATE LOADING 965 pression, where the v e r t i c a l s t r e s s extends throughout the depth of the medium, and that of a body of limited extent r e s t i n g upon an ideally e l a s t i c half-space. In the l a t t e r c a s e , the s t r e s s e s d e c r e a s e rapidly with depth a s shown in Fig. 14, whereas in the actual situation, the distribution of s t r e s s following that of the e l a s t i c analogy i s prevented by local s h e a r f a c u r e in the vicinity of the plate edges. Another explanation might be that the B values f o r this peat a r e g r e a t e r than 1, approaching the value of 2 f o r the peat a t the 6-ft depth. T h i s possibility can be investigated by f u r t h e r laboratory work.
CONCLUSIONS
1. F o r both the laboratory and the f i e l d t e s t s a b o u t one-quarter of the total observed settlement took place following dissipation of m e a s u r e d excess p o r e p r e s s u r e s , but the e x c e s s pore p r e s s u r e phase in the laboratory consisted of a s m a l l e r percentage of total t e s t t i m e than in the field. G r e a t e r s t r u c t u r a l reorientation a s exhibited by consolidation takes place in the laboratory than in the field during the period following excess pore p r e s s u r e dissipation. T h i s can be explained partly by sampling disturbance and partly by the differences in the lengths of drainage paths which cause e a r l i e r dissipation of pore p r e s - s u r e s in the laboratory.
2. The compression index o r the slope of the void r a t i o and log effective p r e s s u r e c u r v e s f o r laboratory consolidation was about twice a s s t e e p a s that f o r the field case.
3. Any possibility of dividing settlements into p r i m a r y andsecondary con- solidation phases solely on the b a s i s of standard settlement and log-time plots did not a p p e a r feasible.
4. P o r e p r e s s u r e response, a s indicated by the build-up and dissipation of excess pore p r e s s u r e s , was relatively independent of depth below ground s u r - face, indicating p r i m a r i l y horizontal drainage.
5. The essentially horizontal drainage that o c c u r r e d in thefield prohibited the use of scaling laws t o predict field consolidation f r o m observation of oedometer t e s t behavior, a t l e a s t f o r loads of limited extent. The degree of consolidation in the field was relatively uniform throughout the depth of the consolidating s t r a t u m , which was apparently due to radial drainage.
6. P o r e p r e s s u r e s measured a t depth w e r e in e x c e s s of the magnitudes of vertical s t r e s s calculated using the e l a s t i c theory. This means a t l e a s t one of t h r e e things: (a) Yielding of the peat around the p e r i m e t e r of the plate c a u s e s v e r t i c a l s t r e s s e s below the plate t o be l a r g e r than those calculated using the e l a s t i c theory, i.e., zones of confined plastic flow made the theory of elasticity inapplicable; (b) s t r e s s e s applied t o the peat r e s u l t in developed pore p r e s s u r e s g r e a t e r than the i n c r e a s e in v e r t i c a l s t r e s s e s , i.e.,
B
> 1; o r (c) the occurence of l a r g e s t r a i n s , with t h e i r nonlinear effects, invalidates the l i n e a r theory of elasticity used t o calculate s t r e s s e s in organic s o i l s . The r e s u l t s of this project provide a b a s i s f o r the planning of f u r t h e r detailed investigations. The importance of horizontal drainage under field loads of limited extent was shown, a s was the importance of r a t e of field loading on p o r e p r e s s u r e generation and dissipation. The d e p a r t u r e of the peat-from the point of view of s t r e s s analysis-from e l a s t i c behavior, sug- g e s t s the advantages of using field p r e s s u r e t r a n s d u c e r s in p r e c i s e field966 July, 1969 SM 4 examinations. F u r t h e r examination of the consolidation p r o c e s s and even of application of the effective s t r e s s concept to highly organic s o i l s i s warranted.
ACKNOWLEDGMENTS
This paper i s a contribution of the Division of Building Research, National Research Council of Canada and i s published with the approval of R. F.
Legget, Director of the Division.
APPENDIX I.-REFERENCES
I . Anderson, K . O., and Hemstock, R. A., "Relating S o m e Engineering Properties of Muskeg to Some P r o b l e n ~ s of Field Construction," Proceerling.~, 5th Muskeg Research Conference, National Research Council of Canada, A C S S M Technical Memo 61, Ottawa, 1959, pp. 16-25. 2. Brawner, C . O., "The Muskeg Problem in B.C. Highway Construction," Proceerli11g.s. 4th
Muskeg Research Conference. National Research Council of Canada, A C S S M Technical Memo 53, Ottawa. 1958, pp. 45-53.
3. Brawner. C . 0.. "The Principle of Preconsolidation in Highway Construction over Muskeg,"
Hotrr1.s rr~icl E!rgi/~erri!r~ C'o,r.sfrtrcrion, Vol. 97, No. 9, 1959, pp. 99- 100, 102. 104.
4. Buisman. A . S . K., "Results of Long-duration Settlement Tests." Procec,dings. 1st International Conference on Soil Mechanics and Foundation Engineering, Vol. 1, 1936, pp. 1 0 3 1 0 6 .
5, Colley, B. E.. "Construction of Highways over Peat and Muck Areas." il,)rerican High~t~rry.~, Vol. 29. No. I, 1950. pp. 3 - 6 .
6. Goodman. L. J.. and Lee, C . N., "Laboratory and Field Data on Engineering Characteristics of S o m e Pent Soils," Proceer1i1rg.v. 8th Muskeg Rescarch Conference, National Research Council of Canada, A C S S M Technical M e m o 74, Ottawa, 1962, pp. 1 0 7 129.
7. Hillis, S . F.. and Brawner. C . 0 . . "The Compressibilily of Peat with Reference to Major High- way Construction in British Columbia," Proc~edbrg.~, 7th Muskeg Research Conference, National Rescarch Council of Canada. A C S S M Technical M e m o 71. Ottawa, 1961, pp. 204 227.
8. Lake, J . R., "Pore Pressure and Settlement Measurements During Small-Scale and Laboratory Experiments to Determine the Effectiveness of Vertical Sand Drains in Peal," Procerdi,ig.s, Conference on Pore Pressure and Suction in Soils, Butterworths, London, 1960, pp. 103- 107. 9. Lake, J. R., "Investigations of the Problem of Constructing Roads on Peal in Scotland," Pro-
eeer1i1ig.s. 7th Muskeg Research Conference, National Research Council of C a n a d a , A C S S M
Technical M e m o 71, Ottawa, 1961, pp. 133-168.
10. Lea. N. D., "Notes on the Mechanical Properties of Peat," Proceer1i1ig.s 4th Muskeg Research Conference. National Research Council of Canada, A C S S M Technical M e m o 54, Ottawa, 1958, pp. 53--57.
I I . Lea, N. D., and Brawner, C . 0 . . "Highway Design and Construction over Peat Deposits in the
'
Lower Mainland Region of British Columbia," Keseorclr Kecortl No. 7, Highway ResearchBoard, Washington, D.C., 1963, pp. 406-24.
12. MacFarlane, I. C.. "Guide to a Field Description of Muskeg," A C S S M Technical Memo 4 4 (revised), National Research Council of Canada, Ottawa, 1958.
13. MacFarlane, I. C., "The Consolidation of Peat: A Literature Review." Divhioii of Building
Keverircli Tecli~iicnl Paper !Yo. 195, National Research Council of Canada, Division of Building
Rescarch, Ottawa, 1965. (National Research Council of Canada 8393).
I?. Mickleborough. B. W., "Embankment Construction in Muskeg a t Prince Albert," Proceerl-
i~ig.s, 7th Muskeg Research Conference, National Research Council of Canada, A C S S M
SM 4 PLATE LOADING 967
15. Miyakawa, I., "Some Aspects of Road Construction in Peaty or Marshy Areas in Hokkaido, with Particular Reference to Filling Methods," Civil Engineering Research Institute, Hokkaido Development Bureau, Sapporo, Japan, 1960.
16. Ringeling, J . C. N., "Measuring Groundwater Pressures in a Layer of Peat Caused by an Imposed Load," Proteedi~rg.~, 1st International Conference on Soil Mechanics and Foundation Engineering, Cambridge, Mass., Vol. I , 1936, pp. 106- 11 1.
17. Ripley, C. F., and Leonoff, C. E., "Embankment Settlement Behavior on Deep Peat," Procerd-
irrg.s, 7th Muskeg Research Conference, National Research Council of Canada, ACSSM Techni-
cal Memo 7I,Ottawa, 1961, pp. 185-204.
18. Root, A. W., "California Experience in Construction of Highways Across Marsh Deposits."
Bulleri~r 173, Highway Research Board, Washington, D.C., 1958. pp. 46-66.
19. Scott, R. F., Princip1e.s o j Soil Mechor~ics. Addison-Wesley Publishing Co., Reading, Mass., 1963.
20. Shea, P. H., "Unusual Foundation Conditions in the Everglades," Tronsoc~ions, ASCE, Vol. 120. 1955. pp. 9 2 1 0 2 .
21. Skempton, A. W., "The Pore Pressure Coefficients A and B," Georechniylre, Vol. 4, No. 4, 1954. pp. 143- 147.
22. Taylor, D. W., Fiozdar~rerr1ol.s o j S o i l M e c h n ~ i c : ~ , John Wiley and Sons, Inc., New York, 1948. 23. Terzaghi, K., and Peck, R. B., Soil Mecho~ricc. ~ I J Drgitreerirrg Proelice. John Wiley and Sons
Inc., New York, 1948.
24. Ward, W. H., "A Slip in a Flood Defence Band Constructed on a Peat Bog," Proceedirrgs, 2nd International Conference on Soil Mechanics and Foundation Engineering, Rotterdam, Vol. 2, 1948, pp. 19-23.
APPENDIX 11.-NOTATION
The following symbols a r e used in this paper: n = r a d i u s of loaded a r e a ;
5
= p o r e p r e s s u r e coefficient; C, = compression index;c, = coefficient of consolidation;
k = coefficient of permeability;
Y = horizontal distance f r o m center line of loaded a r e a ; and
---
---
6652 STUDIES OF RESPONSE OF PEAT TO PLATE LOADING
KEY WORDS: consolidation; consolidation coefficient; elastic deformation;
elasticity; elastic theory; field data; field t e s t s ; loading r a t e ; organic soils;
1-1
Ipeat; permeability; p l a t e load t e s t s ; pore water p r e s s u r e s ; primary con-
solidation; secondary compression; settlement; soil mechanics; time settlement I
relationship I I
I ABSTRACT: This paper presents the results of a s e r i e s of small-scale field t e s t s I
.
c a r r i e d out to investigate the in situ deformational characteristics of a soft peat, I particularly in the vicinity of a load discontinuity. A 3-ft diam plate was used to I apply loads to the surface of a 10-ft thick s t r a t u m of nonwoody fine fibrous peat withI
a moisture content of about 9501,. Rates and magnitudes of settlement, and pore I Ip r e s s u r e s a t five positions were measured and compared. Field r e s u l t s were supple-
I
mented by data obtained from a limited number of oedometer-type laboratory con- I Isolidation t e s t s , conducted with and without pore p r e s s u r e measurements. The I
geometry of the settlement-logarithmic time plots i s described. Emphasis i s placed on the prevalence of horizontal drainage and i t s significance. The departure of soft I
organic m a t e r i a l s from the predicted behavior a s based upon the linear theory of I elasticity i s described, and possible r e a s o n s f o r lack of agreement a r e presented. I REFERENCE: F o r r e s t , J. B., and MacFarlane, I. C., "Field Studies of Response of I I
P e a t to Plate Loading," Journal of the Soil Mechanics and Foundations Division, I I
ASCE, Vol. 95, No. SM4, Proc. P a p e r 6652, July, 1969, pp. 949-967. I I