A COMPARATIVE STUDY OF PLANNED
AND
UNPLANNED RETAIL CENTERS
WITH
IMPLICATIONS FOR PLANNING
by
RICHARD RAMBACH GREEN
A.B., Harvard University
(1953)
SUBMITTED IN PARTIAL FULFILLMENT
OF THE REQUIREMENTS FOR THE
DEGREE OF MASTER IN
CITY PLANNING
at the
MASSACHUSETTS INSTITUTE OF
TECHNOLOGY
June, 1959
Signature of Author.
Department of City and Regional Planning
May 25,
1959
Certifiedby...
....
s....
...
Thesis Supervisor/
Accepted
by..
w.. d...p,,.n
...Chai
rn,
Departmental Comittee
on Graduate Students
Document Services
Cambridge, MA 02139 Ph: 617.253.2800 Email: docs@mit.edu http://libraries.mit.edu/docsDISCLAIMER
MISSING PAGE(S)
Page 239 is missing from the original
document.
i1
THESIS ABSTRACT
A COMPARATIVE STUDY OF PLANNED AND UNPLANNED RETAIL
CENTERS WITH IMPLICATIONS FOR PLANNING
by Richard Rambach Green
Submitted to the Department of City and Regional
Planning
on May 25,
1959
in partial fulfillment
of the requirements for the degree of Master
in City Planning*
The core of the
thesis
is the statement that
planned
shopi
centers in their
present
form do not represent
full retail coverage; unplanned retaT centers though often
blihted and
physically
unfunctional have a wider coverage
of'
retail
eand,
in a
sense,
offer more variety. If'
planners
are
to redevelop the older,
unplanned
centers,
alternatives
r t
ust current models of planned
centers must be found
in order to
provide for inclusion of
all
tp
0o
retail activity; for provision of "incubation"
space needi by new businesses; and for the keeping of' many
favorable factors that the older centers now have, and
which the
present-~day7plnned shopIng
enters.l
ack.
In order to validate the abovecertain background
information was included in Chapter One which deals with
classification and structure of retail centers in metropolitan
areas. It was necessary to demonstrate that there were
functional differences between planned and unplanned
retail centers. To this end, data was compiled for
forty-nine planned shopping centers and for seventy-four
unplanned retail centers.
The planned and unplanned centers were compared on the
basis of gross floor area broken-down to seventeen major
store categories. These categories were examined in the
light of the following three propositions:
1. That planned and unplanned business centers are
functionally different:
this difference should appear in
the different percentage of use by various types of retail
facilities when comparison is made of all planned and
un-planned centers. Further, it follows that this difference
will appear when comparison is made of similarly-sized
planned and unplanned centers.
2. That
unplanned
centers show a variation in
per-centage of use by types of retail facilities when comparison
is made on the basis of size differential.
3.
That planned centers show a variation of
per-centage of use by types of retail facilities when comparison
is made on the basis of size differential.
The analysis in Chapter Two concludes that the three
propositions are valid. At this point, the planning
implicalions of the study are discussed. This discussion,
in Chapter Three, concludes that the planned shopping
centers of today are limited function centers; they are
geared to high volume per square foot stores; they are
a product of the modern developer and planning thought in
the twenties and thirties; andfinally, they may not be
desired forms for redevelopment, although they have been
acclaimed as such.
The conclusion of the study upholds the original statement.
Planners are asked to develop new concepts and alternatives,
so that the planned center in the future will be a "planner's
centern not a "developer's center."
If A
Thesis Supervisor:
Roland Bradford Greeley
iv
TABLE OF CONTENTS
Title Page
Thesis Abstract
Table of Contents
List of Tables
Acknowledgements
Introduction...1Summary of Thesis...
8
Chapter 1: A Brief Review of the Classification
And Structure of Retail Centers In
Metropolitan Areas...,,.... 19
Chapter 2: A Comparative
Study
of Planned and
Unplanned Retail Centers...
49
Section 1: Propositions Restated...
49
Section 2: Gross Floor Area Differential
of Planned and Unplanned Centers
With Respect To Total Number
of
Soe...51
Section 3: The Changing Nature of Retail
Trade: The Supermarket As A
Case
Study...,...55
Section
4:
A Closer Look At Planned And
Presentation of Data Explained...
A Note On The Form Of The
Following Sections...
Section
7:
Analysis
Section
Section
8:
9:
Section 10:
Section
11:
Section 12:
Section 13:
Section 14:
Section 15:
Section 16:
Section
17:
of Non-Retail,
Non-ServiceSpace...
Analysis of Vacant Space...
Analysis of Space Devoted To
Food
Stores...
Analysis of Space Devoted To
General Merchandise Sales...
Analysis of Space Devoted To
Apparel
Stores...
...Analysis of Space Devoted To
Furniture, Appliances, And
Household
Goods...
Analysis of Space Devoted To
The Auto Retail Group...
Analysis of Space Devoted To
Hardware
Stores...
Analysis of Space Devoted To
Liquor Stores...
...Analysis of Space Devoted
To,
Drug and Proprietory Stores...
Analysis of Space Devoted To
Eating And Drinking Places...
Section
Section
5:
6:
67
74
75
82
88
94
101
107
113
119
123
127
132
vi
Section 18: Analysis of Space Devoted To
Other Retail Establishments...
136
Section 19: Analysis of Space Devoted To
Service And Repair Establishments... 141
Section 20: Analysis of Space Devoted To
Office
Use...
146
Section 21: Analysis of Space Devoted To
Banks. Post Offices, and Libraries..
152
Section 22: Analysis of Space Devoted To
Entertainment and Commercial
Recreation...
... ...157
Section
23:
Analysis of Space Devoted To
Automotive Service and Repair... 163
Section 24: RoxburyStudy...
168
Section 25: Conclusions of The Study...
175
Chapter
3:
Planning Implications of The
Study... 180
Appendix A: Organization of The Study...
185
Appendix B: Names, Locations, And Parking
Information For All Centers Studied
...194
Appendix C: Summary Tables For All Centers
Detailing GFA, Percentages
Of
Categories To Total GFA, And
Appendix D; Sample Data Sheet Showing Breakdown
Of Categories Into Major Store Types
For Some
Centers...
236
viii
LIST OF TABLES
Chapter 1:
Table 1: Classification By Number of Stores.... 25
Table 2: Canoyer'sScheme...
38
Table 3: Schematic Diagram Of Retail
Structure of Metropolitan Areas
(Kelley's
Scheme)...
40
Table
4:
Retail Structure Of Metropolitan
Economy(Kelley's
Scheme)...
41
Table
5:
Planned Shopping Centers
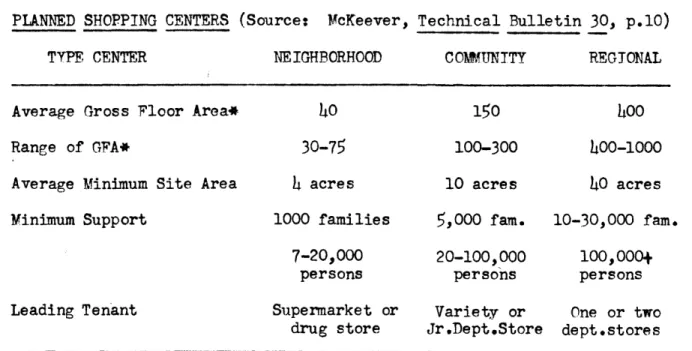
(McKeever's View)
...
4
Table
6:
Retail Structure and Neighborhood
Orientation(APHA
Ve)...45
Table 7: Survey of Planned Centers By
The Urban Land Institute...
47
Chapter 2:
Table 8: Unplanned Centers: Gross Floor
Area Measures...
.. ....52
Table
9:
Planned Centers: Gross Floor Area
Table 10:
Summary
of Tables 8 And
9...53
Table 11: "Character Sketch" Of Planned
Table 12:
Table
Table
Table
Table
Table
Table
Table
Table
Table
Table
Table
Table
Table
Table
Table
Table
Table
Table
Table
Table
Table
13:
14:
15:
16:
17:
18:
19:
20:
21:
22:
23:
24:
25:0
26:
27:
28:
29:
30:
31:
32:
33:
Illustrative Table On The
Presentation of The Data...
68
Number of Centers In Each GFA Range...
69
Non-Retail, Non-Service; Unplanned....80
Non-Retail, Non-Service: Planned...81
Vacancies: Unplanned...8
6Vacancies: Planned...87
Food: Unplanned...
...92
Food:
Planned...93
General Merchandise: Unplanned...99
General Merchandise: Planned...100
Apparel: Unplanned...105
Apparel: Planned....
. . ... *.l.106Furniture, Etc: Unplanned...111
Furniture, Etc: Planned...112
Auto Retail: Unplanned...117
Auto Retail: Planned...118
Hardware, Etc: Unplanned...121
Hardware, Etc: Planned...122
Liquor Stores: Unplanned...125
Liquor Stores: Planned...126
Drugstores, Etc: Unplanned...130
Drugstores, Etc: Planned...131
Table
34:
Eating and Drinking: Unplanned....
I
....
134
Table
Table
Table
Table
Table
Table
Table
Table
Table
Table
Table
Table
35:
36:
37:
38:
39:
40:
41:
142:
43:
4k :
45:
46:
Table 47:
Table
Table
Eating and Drinking: Planned...
Other Retail: Unplanned...
Other Retail: Planned...
Service and Repair: Unplanned...
Service and Repair: Planned...*...
Office: Unplanned...*.
Office: Planned...*... *
Banks, Etc: Unplanned...
Banks,
Etc:
Planned...
Recreation, Etc: Unplanned...
Recreation, Etc: Planned...
Automotive Service and Repair:
Unplanned...
...Automotive Service and Repair:
Roxbury Study Summarized...
Summary of
Study...
.Summary Tables(Appendix
C)...
x135
139
14o
1)44
145
150
151
155
156
161
162
166
167
169
178
204
k48:
149:
ACKNOWLEDGEMENTS
To my thesis advisor, Professor Roland B. Greeley,
goes my admiration and respect. His patience, pointed
questions and encouragement aided me immeasurably.
To Professor Frederick J. Adams and Professor John
T. Howard goes my sincere thanks for their advice and
patience during my many "changes of heart."
To the Faculty and Students of the Department of City
and Regional Planning goes my thanks for two years of
availability as consultants.
Miss Dulcie Jones is a "wonder woman." All my thanks1
Jim and Ellen Saalberg lent physical and moral support.
I will never forget their many kindnesses.
My wife, Barbara, served, slaved and suggested. Though
she was in the middle of writing her thesisshe did not
hesitate to help whenever needed, which was often. It was
appreciated; and she knows that without her I never would have
finished, since I have told her so. But only I know how
This thesis grew out of an unanswered question: What will happen to the future form of the metropolitan retail structure if the current trend
to planned shopping centers is continued? A great deal of literature on the subject states that planned shopping centers represent the best retail form.1 Further, many suggest that the older, unplanned centers be redevel-oped in the form of the planned shopping center.2
In spite of these reassurances, it was felt that a complete metropoli-tan retail structure composed of planned shopping centers as they now exist would be detrimental, rather than salutary. It is the intent of the
thesis to prove this point.
First of all, planned shopping centers have to be shown as function-ally different from unplanned, older retail centers; then the limited func-tion of planned shopping centers has to be demonstrated; finally, the
nature of unplanned centers has to be shown. At this point, the thesis
can be discussed. An added bonus, as it were, would be the comparative
study of planned and unplanned centers as they now exist.
Ratcliff has shown that certain stores tend to group together.) From this it might be assumed that each category of stores (food, apparel,
3The reader need only glance at some of the works in the bibliography to
find this general impression on the part of many writers. Cf., for example, Kelley, Hoyt, Nelson, and Smith.
2
Cf., Richard Lawrence Nelson and Frederick T. Aschman, Technical Bulletin
No. 22, "Conservation and Rehabilitation of Major Shopping Districts,"
UrbanLand Institute, Washington, D.C.,
1953;
Perimeter Plan for EnglewoodPlaza, Real Estate Research Corporation and Chicago Planning Coimmission,
T7
Commercial Development, Detroit City Plan Commission,1956.
3Richard
U. Ratcliff, The Problem of Retail Site Selection, Michigan
=MEM
general merchandise, etc.) had same describable relation to the center that
contained it. Under this assumption Gross Floor Area (GFA) might be used
as a common measure of centers, and the percentage of use by categories
might be used as a comparative tool. This tool, however, should probably
be related, as Stein and Bauer pointed out in 1934, to the fact that "every
community has certain conditions which differentiate it
from every other
community."
Without detailed knowledge of each shopping center's market
charac-teristics, such a study, however, might not be valuable. As Lillibridge
pointed out:
The only valid means of estimating the need for retail
facili-ties and the area they should occupy is analysis of annual
in-come and expenditures into units 6f purchasing power for the
population being ccnsidered.2
This type of study, however, would be almost impossible because of the
lack of necessary data; the time necessary to prepare the data, if it were
available; and the cost, in time and money, to program the data for
machine computation and correlation. Therefore, an assumption was made
that the retail structure is, at any given time, in balance. Under this
assumption the study might be undertaken using a measure of gross floor
area. In spite of the possible inaccuracies that marginal business
estab-lishments might cause, it was determined to continue the study under the
1
Clarence S. Stein and Catherine Bauer, "Store Buildings and Neighborhood
Shopping Centers," The Architectural Record, LXXV (February
1934)
p. 177.
2Robert M. Lillibridge, "Shopping Centers in Urban Redevelopment,"
Regjional
Shopping Centers
Planning Symposium, American Institute of
Plan-ners,
Chicago Regional Chapter, June 1952, p. 3h. (Reprinted from the
assumption of balance.1
It is the intent of this thesis to first demonstrate the validity of
the following propositions:
1. That planned and unplanned business centers are functionally
dif-ferent: this difference should appear in the different percentage of use
by various types of retail facilities when comparison is made of all
planned and unplanned centers. Further, it follows that this difference
will appear when comparison is made of similarly sized planned and unplanned
centers.
2. That unplanned centers show a variation in percentage of use by
types of retail facilities when comparison is made on the basis of size dif-ferential.
3. That planned centers show a variation of percentage of use by types of retail facilities.when canparison is made on the basis of size
differen-tial.
This comparative study will show that planned centers are functionally
different from unplanned centers; that planned centers are, in reality, limited function centers; and that unplanned centers have greater variety.
At this point, the framework for the thesis is solidified. It remains
then to discuss the thesis that:
Planned shopping centers in their present form do not represent full retail coverage; unplanned retail centers th often blighted and physi-1
During an interview with Mr. William Nash of ACTION, in Cambridge, in the summer of
1958,
it was stated that approximately 30 percent of all retailstores were uneconomic, and that they7 survived only because the owners were willing to take whatever small profits there were as a salary.
An-other factor was the possibility of there being rent-paving residences above the stores. Since the owner of the business might also own the
buil-ding, the rentals provided just enough income to the owner so that the
14
cally unfunctional have a wider coverage of retail tvpes and, in a sense, offer more variety. If planners are to redevelop the older, unplanned
centers, alternatives other than just current models of planned centers
must be found in order to provide for inclusion of all types of retail activity; for provision of "incubation" space needed by new businesses; and for the keeping of many favorable factors that the older centers now have, and which the present-day planned shopping centers lack.
To this end, this work is divided into three major sections:
Chapter 1
-A Brief Review of the Classification and Structure of
Re-tail Centers in Metropolitan Areas:
This review is intended to acquaint or reacquaint the reader with
various conceptual schemes and classifications of business centers.
Chapter 2
-A Canparative Study of Planned and Unplanned Retail
Centers:
The fundamental reason for this study is to demonstrate that, in fact,
planned and unplanned centers are functionally different; and that planned
centers have limited functions.
The data for the study was derived from three major sources: Baker
and Funaro, the Urban Land Institute's Technical Bulletin Number 30, Part 2, and the source material for the Boston Globe Map of Retail Centers prepared
by Dr. Kenneth Walter in 19h6-1917.1 The former two sources deal with the
1
Geoffrey Baker and Bruno Funaro, Shopping Centers, Progressive Architecture
Library, Reinhold, New York, 1951.
Homer Hoyt and J. Ross McKeever, "Shopping Centers Restudied," Technical
Bulletin Number 30, Part 2, Urban Land Institute, Washington, D.C., May
able. This information was reorganized to be comparable with the Boston Globe Map data which, although lacking statistical material on GFA, had
accurate 100 feet to the inch scale representations of 418 Metropolitan Bos-ton unplanned retail centers. It was thus necessary to measure each center
chosen as a representative type in order to establish the GFA. Altogether, seventy-four Metropolitan Boston centers were measured; and forty-nine planned shopping centers, from various parts of the country, were included for the study.1
Some explanation is necessary concerning the selection of centers with respect to their locations. Unplanned centers were selected from the Boston
Metropolitan Area for the following reasons:
1. It was assumed that the type of centers exhibited by the Boston
Metropolitan Area were reasonably similar to other metropolitan areas. Thus
generalizations could be made which had wider applicability than to just Boston alone.
2. Information was not readily available for other areas, while the Boston Globe Map presented a source which could be exploited.
3. Although the data was for the 1946-47 period, the material was
valuable because it presented the situation just as the planned shopping center building boom began. Further, the changes that occurred between
1959
and the earlier period (1946-47) were sufficiently small so as to make theBoston Globe Yap of Metropolitan Boston, prepared under the direction of
Robert LT.M.Ahern, Research Manager, Boston Globe, based on a field sur-vey by Dr. Kenneth Walter, 1946-1947, hereinafter cited as Boston Globe Map.
1
Appendices A-D give complete information on the centers; the methodology for the category classifications; and tabular, summary results.
6
the study applicable to the present. This assumption was based on a study of the Roxbury section of Boston made by the author and Mr. David Jokinen for the Boston City Planning Board in the sunmer of 1958 and covering the
period
1946-47
to 1958. The results of this study are briefly presented in Chapter 2 for comparative purposes.Planned centers were chosen from various areas and compared with
Bos-tonts unplanned centers. The assumptions for the validity of this process
are mentioned below:
1. Boston had only a few planned centers; thus only a very small
num-ber of centers could be studied if other sections of the country were not included.
2. Data was available for a variety of centers in other areas.
3.
It was assumed that metropolitan areas generally have the sanecharacteristics, if their size differential is not too wide. Under this
assumption, then, planned centers which were built in other areas of the
country would probably be similar, in the main, to planned centers that might be built in Boston. Thus, for comparative purposes, the planned and unplanned centers' differences could be logically described. It was
assumed that there would be some error in the process, but the error would be relatively minor, and that on the whole, the systems would be comparable.
Chapter 3
-The Planning Implications of A Comparative Study of
Planned Shopping Centers and Unplanned Retail Centers:
This chapter deals with the thesis as it has been formulated and as it results from the comparative study.
1. Gross Floor Area will be abbreviated to GFA.
2. The Boston etropolitan Area will be referred to as the BMA.
3. "The term /71anned7 Shopping Center has been loosely used covering
any-thing from a corner grocerv to a string of stores along the highway...
it (the term) refers to a group of commercial establishments planned, developed and managed as a unit, and related in location, size and types of shops to the surrounding area which it serves, generally in the out-lying suburban areas."Il
A NOTE ON THE EXCLUSION OF THE CENTRAL BUSINESS DISTRTCT FROM THE STUDY: The central business district is a subject in itself. Furthermore, no
data of the kind used in the study existed. These considerations,
there-fore, led to the exclusion of the central business district from the empiric
study.
lSeward H. Mott and Max S. Wehrly, Technical Bulletin 11, Urban Land
Chapter 1: A Brief Review of the Classification and Structure of Retail
Centers in Metropolitan Areas
1. There is general agreement that a retail structure exists, but
opinion varies widely as to what it is.
2. There are many means of classification of retail centers. Gross Floor Area seems to be the best means of classification because:
A. It is easily visualized
B. It fits into land use programming operations easily
0. It is an exact and manipulatable measure
D. In its component parts, gross floor area is significant in
detailing the center's "anatomy."
Chapter 2: A Comparative Study of Planned and Unplanned Retail Centers
1. The number of stores a retail center contains is not in itself a
reliable means of understanding or studying the center.
2. The supermarket is an interesting case example of the revolutionary change taking place in retail trade. It points up the danger of accepting
the trends of present development as the guiding principles of tomorrow.
3.
Differences between planned and unplanned retail centers arecon-ditioned by many factors. Some of these are:
A. The "oldness" of unplanned centers versus the "newness"
of planned centers.
B. The aspects of "natural" integration in unplanned
9
C. The unamortized character of planned centers versus the amortized character of unplanned centers.
D. The nucleated form of planned' centers versus the
nucleated or strip form of unplanned centers.
E. The general accessibility of unplanned centers to
public transportation, walk-in trade, and the
auto-mobile versus autanobile accessibility in planned
centers.
F. The differences of zoning regulations in suburban
and inlying areas.
G. The domination of chain stores in planned centers.
H. The surrounding off-street parking lot in the
planned center versus the curb, and the futile
efforts of unorganized attacks on the off-street parking problem in unplanned centers.
I. The single developer in planned centers versus the
many interests in unplanned centers.
4. The Summary of the study in Chapter 2 is presented, below, by
re-tail categories, and in most cases, the three propositions hold:
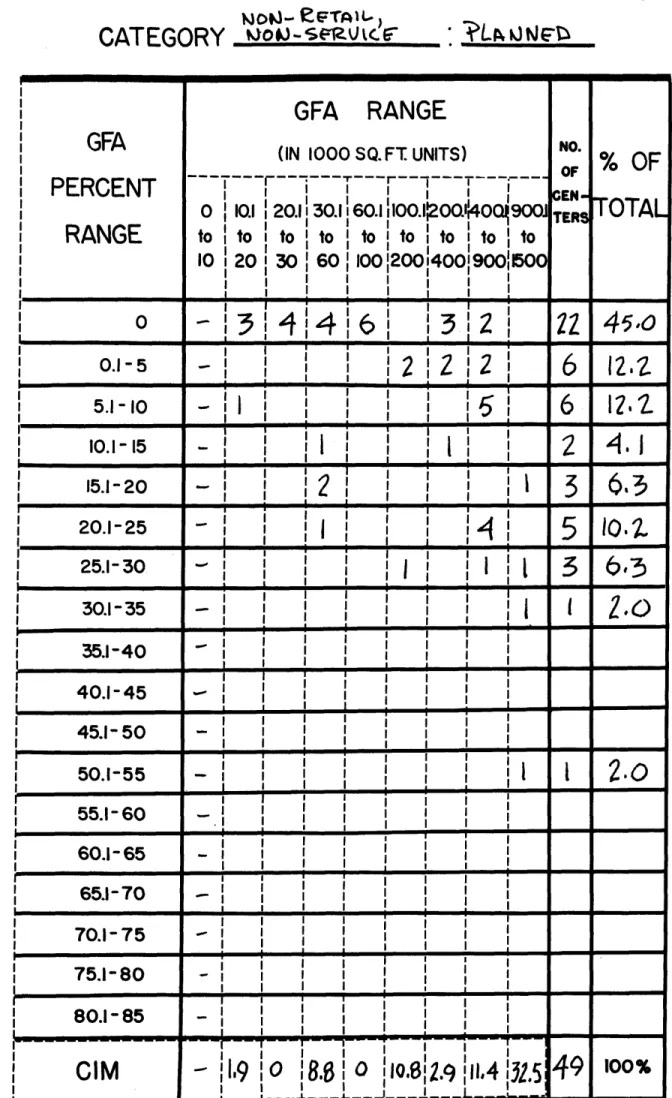
A. SPACE DEVCTED TO NON-RETAIL, NON-SERVICE WUNCTTONS:
(1) A functional difference exists between planned and
un-planned centers with regard to this category, since un-planned centers show a
greater percentage of this "non" use. This results from the inclusion of amenities and efficient store servicing space in planned centers, in addition to the exclusion of many functions such as wholesaling, social
F
(2) Unplanned centers show a consistent variation in
per-centage of space devoted to "non" functions because of the inclusion of canmunity-oriented facilities and the competition for space among many
types of land uses.
(3) Planned centers show less of a relationship in
percent-age of "non" use to total gross floor area because of the "whim" of the developer or designer.
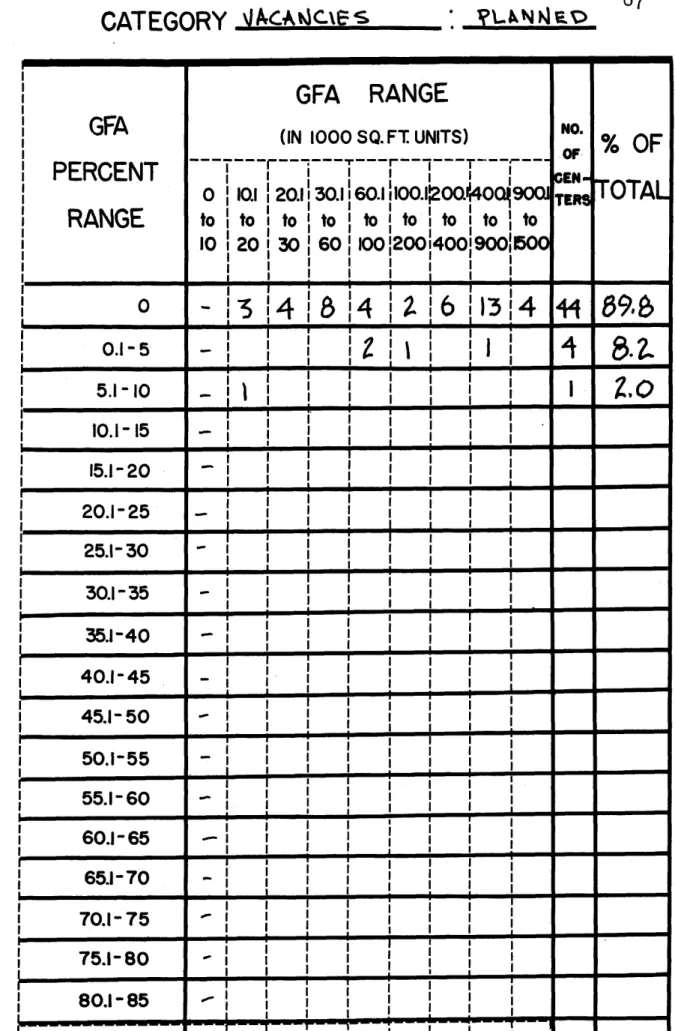
B. VACANT SPACE:
(1) A functional difference exists between planned and
un-planned centers. Planned centers show little vacancy, due to conservative
estimates of market potential. Unplanned centers show less vacancies than
expected, but have higher percentages than planned centers. Marginal busi-ness, unfavorable neighborhood changes, and small, awkward stores in some
centers accounts for this.
(2) Vacancies in unplanned centers show definite relation-ship to gross floor area. The smaller centers are more sensitive to change than the larger centers.
(3) Planned centers show no definite relationship of
vacan-cies to gross floor area.
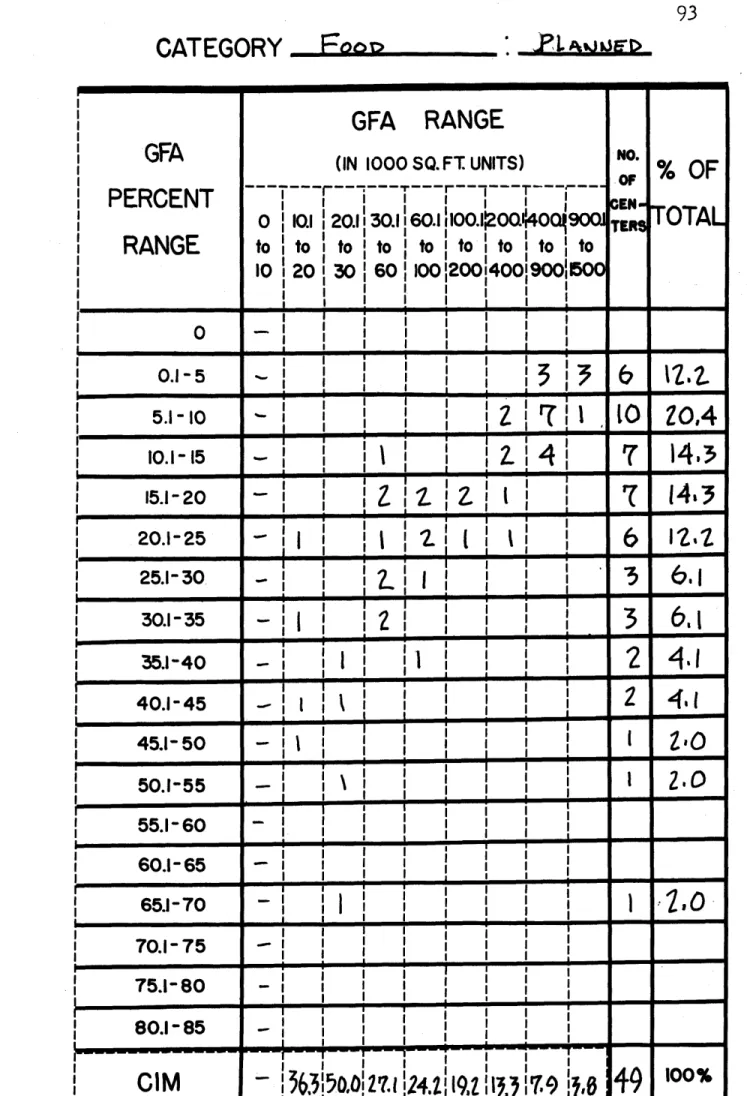
C. SPACE DEVOTED TO rOOD STORES:
(1) There are functional differences in the types of food stores in planned and unplanned centers. Functional differences in the
percentages that these stores occupy in different size centers seem to result from the supermarket as the major food store in planned centers.
(2) Unplanned centers exhibit decreasing percentages of space
devoted to food stores as centers increase in size.
11
(3) Planned centers similarly show decreasing percentages of
space devoted to this use as centers increase in size.
D. SPACE DEVOTED TO GENERAL MERCHANDISE:
(1) There is functional differentiation between planned and
unplanned centers. Planned centers are consciously built around these types of stores, which result from growing suburban populations, higher suburban incomes, availability, and lower cost of suburban land.
(2) Unplanned centers show an increase of percentage in general merchandise as centers increase in size from above 30,000 square feet. Below this figure there are no general merchandise stores.
(3) In planned centers, general merchandise is much more
important than in unplanned centers. It makes its appearance at the 20,000 square foot size center and becomes significant at the 30,000 square foot center. Percentage increases as centers increase in size.
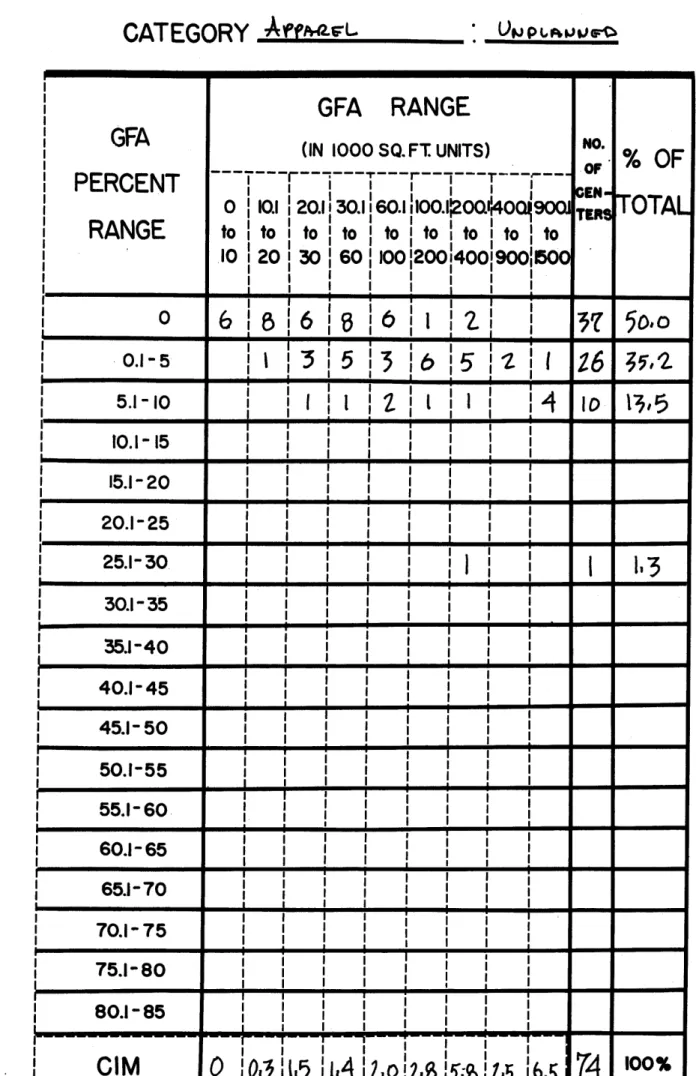
E. SPACE DEVOTED TO APPAREL STORES:
(1) A finctional difference exists between planned and un-planned centers with regard to apparel stores. These stores are highly
compatible with general merchandise stores and can be expected as a high
percentage of use when general merchandise stores are present in a center.
The functiohal difference is underlined by the fact that
50
percent of the unplanned centers lacked apparel stores as opposed to only a 12.4 percentlack in planned centers. Other causal factors f or the differences)are
higher suburban incomes and "fashion-consciousness" in the middle class. (2) Unplanned centers have relatively constant percentages of use devoted to apparel stores, except in the very largest centers where the percentage increases somewhat.
(3) Planned centers show a rapid increase of percentage of apparel store use up to the 400,000 square foot centers. Above this point, there is a decline caused by the over-competition of the full-line
depart-ment store.
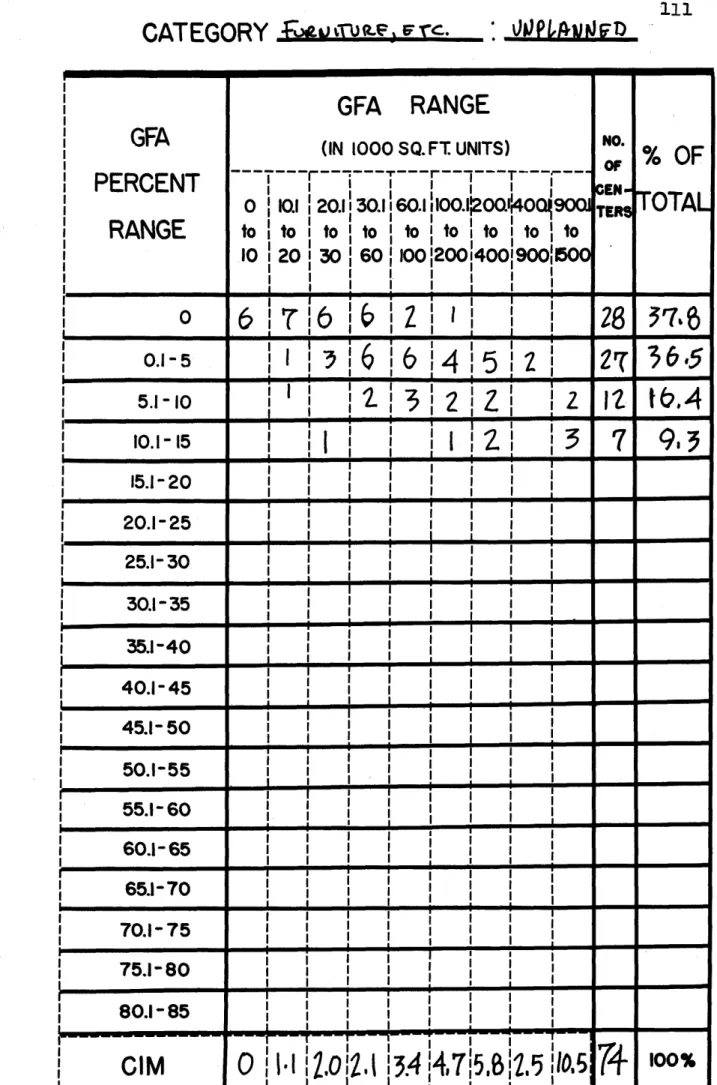
F. SPACE DEVOTED TO VURNITURE AND HOUSEHOLD GOODS, ETC.:
(1) There is a functional difference between planned and
unplanned centers regarding this use. Furniture stores probably are the
causal factor, since they are large space users and have low sales per
square foot. Thus the rents in planned centers are generally too high for them, and they tend to remain in older locations.
(2) In unplanned centers this use increases in percentage
as center size increases.
(3) In planned centers furniture stores are not significant. The balk of the use is taken up by household and appliance stores. The
use appears at intermediate GFAs where it is a higher percentage of use
than in the larger centers, which tend to have relatively constant
percent-ages. The probable reasons are rent and departnnt store ccmpetition.
G. SPACE DFVOTED TO THE AUTO RFTATL GROUP:
(1) There is a functional difference between planned and un-planned centers. This difference results from the incompatibility of auto retail uses in planned centers, conscious exclusion from planned centers by
the developer and suburban zoning ordinances, more peripheral locations of
the planned centers, and the higher space rents in planned centers.
(2) In unplanned centers there is a trend for percentage of use to decrease as centers increase in size. This is conditioned by the physical form of centers and their location with respect to major streets.
13
(3) Tn planned centers percentages devoted to this use tend
to remain at low constant levels regardless of center size, except that the smaller centers lack this use. This is attributed to the inclusion of a gas station in intermediate and larger size centers for customer con-venience.
H. SPACE DEVCTED TO HARDWARE STORES:
(1) There is a slight functional difference between planned
and unplanned centers with regard to this use. This is caused by the
modern variety store in planned centers which tends to compete with the hardware store.
(2) In unplanned centers the percentage of space devoted to this use increases slightly as center size increases.
(3) In planned centers the percentage of space devoted to
this use decreases as centers increase in size.
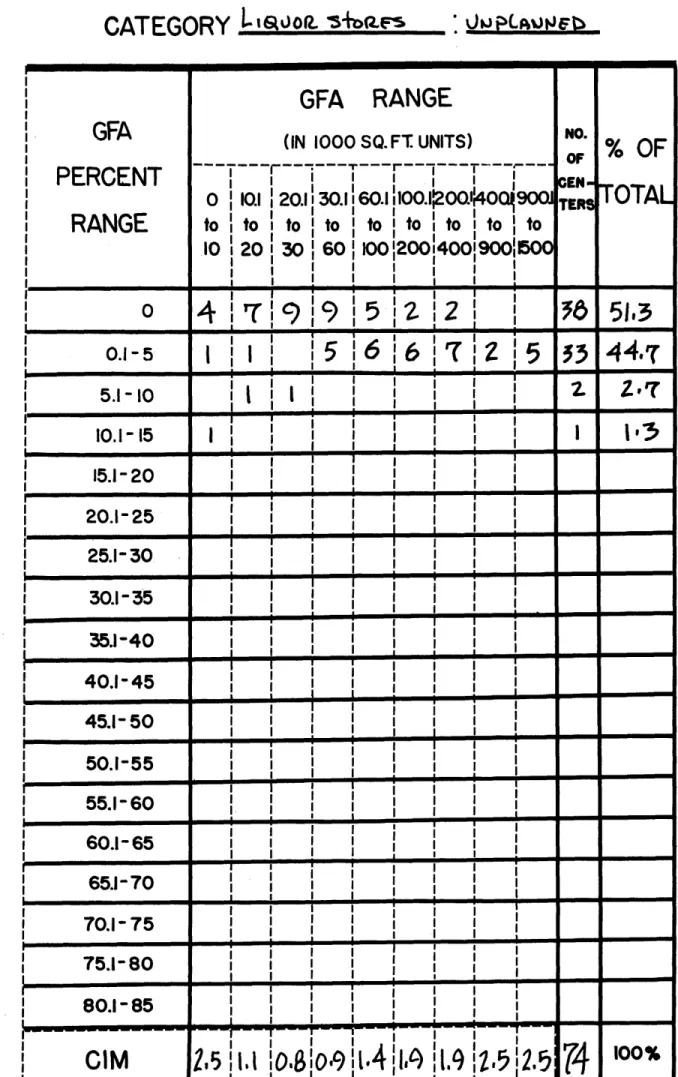
I. SPACE DEVOTED TO LIQUOR STORES:
(1) There is a functional difference between planned and
unplanned centers, since unplanned centers have slightly higher percent-ages of space devoted to this use. location of unplanned centers in areas where liquor is a more important factor of social life accounts for this.
(2) Percentage of space devoted to this use is fairly con-stant with respect to center size in unplanned centers.
(3) Percentage of space devoted to liquor stores is fairly
constant as gross floor area increases in planned centers.
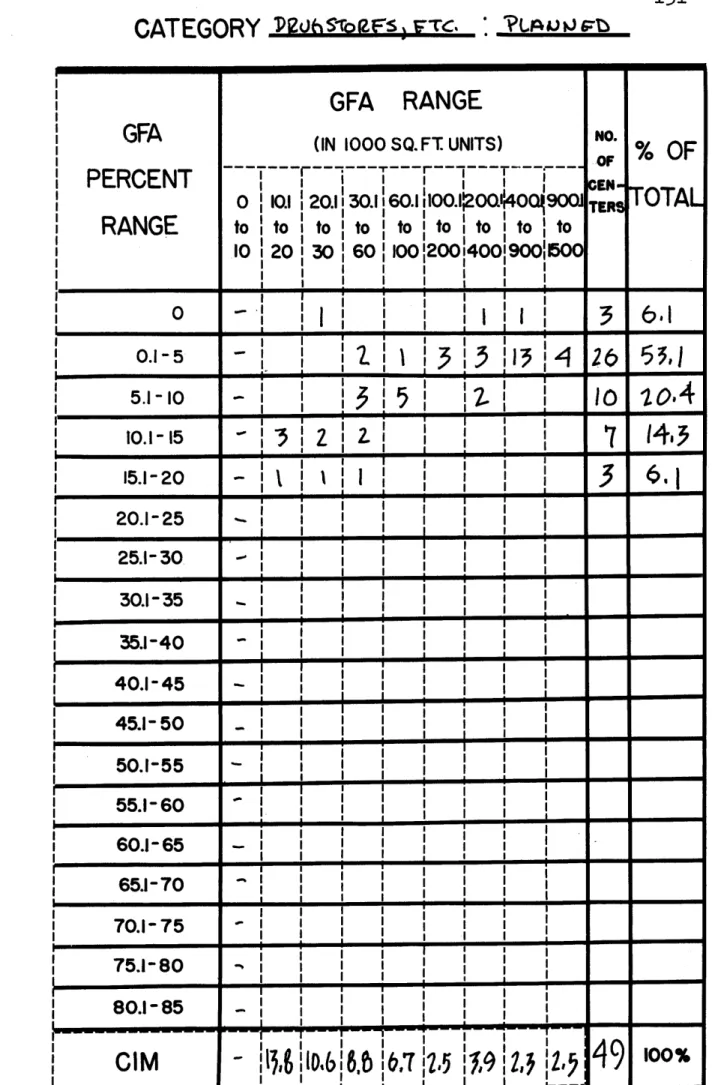
J. SPACE DEVCTED TO DRUGSTORES, ETC.
(1) There is very little functional difference between
devoted to the use. This is best explained by the larger size of modern drugstores when compared with older ones since the number of drugstores is
apt to be equal in smaller planned and unplanned centers.
(2) Unplanned centers show a decrease in percentage of space devoted to this use as centers increase up to 60,000 square feet. Beyond this point space devoted to the use is constant as a percentage of gross floor area.
(3) Planned centers exhibit a decrease in drugstore space as a percentage of gross floor area up to 100,000 square-foot size centers.
Beyond this point the percentages devoted to this use remain constant.
K. SPACE DEVOTED TO EAT ING AND DRINKING PLACES:
(1) There is a functional difference between planned and
unplanned centers in that unplanned centers show slightly higher
percent-ages of use. This difference is conditioned by location of places of
em-ployment and the absence of bars and taverns in planned centers.
1. SPACE DEVOTED TO OTHER RETAIL ESTABLTSHENTS:
(1) Due to income disparities of the suburban population
versus inlying population, the smaller planned centers show higher
percent-age of space devoted to other retail (specialty goods) types than do
un-planned centers. As centers, un-planned and unun-planned, grow larger, the dis-parities of income distribution are lessened, since the market area also
increases, and percentages of use become more nearly constant.
(2) Unplanned centers show no variation of percentage with respect to size of center.
15
(3)
Planned centers decrease in percentage of space devoted to other retail uses as size of center increases up to 100,000 square feet.Beyond this point, percentage remains relatively constant. Conscious
in-tegration of compatible stare types and higher family incomes in suburban neighborhoods are the causes.
M. SPACE DEVOTED TO SERVICE AND REPAIR ESTABLISHMENTS:
(1) Functional differences exist between planned and
un-planned centers as far as service stores are concerned. Unplanned centers
have higher percentages devoted to service stores resulting from the rent-paying abilities of these stores; the lower credit ratings of these stores;
the quantities of small, unusable retail space in unplanned centers; and
the minimization of space devoted to low credit-rating firms by developers
of planned centers. Service stores appear in almost every center because
of the universality of demand for them.
(2) Service stores are convenience stores and are oriented
to the neighborhood. This accounts for the higher percentages devoted to this use in the smaller unplanned centers.
(3) Planned centers of the smaller size have higher
percent-ages of space devoted to this use, as might be expected. Above the
200,000 square foot size of center, the use remains a constant percentage of gross floor area becguse of limitations imposed by the developers.
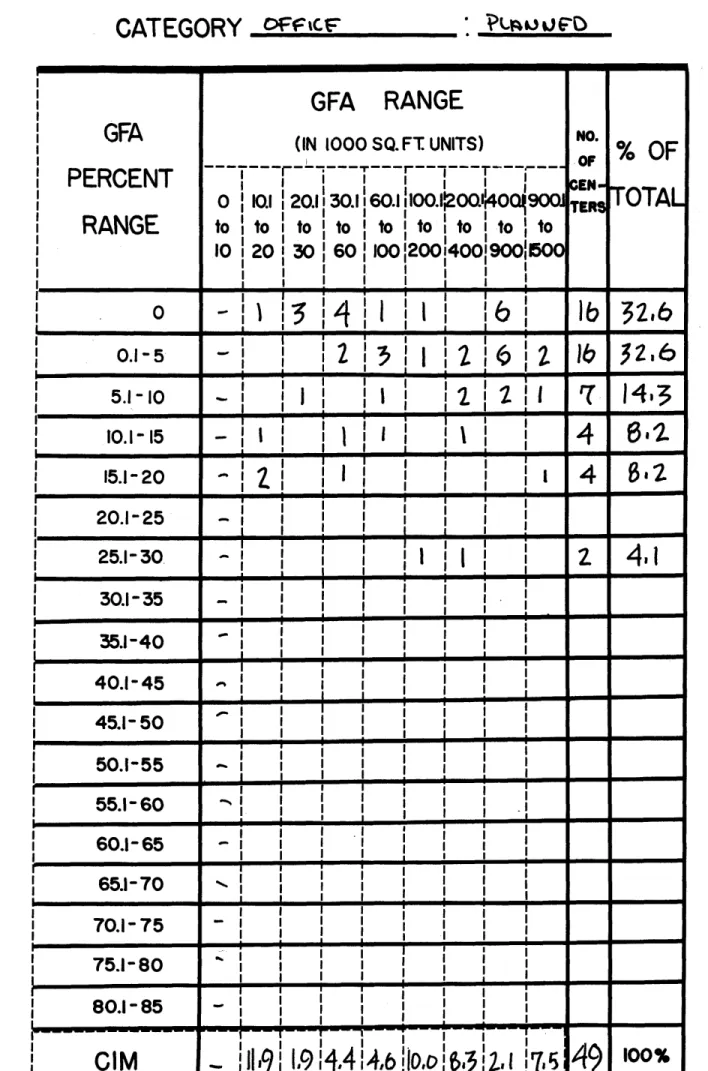
N. SPACE DEVOTED TO OFFICE USE:
(1) The trend towards professional specialization, higher
suburban incomes, and conscious building of "class" centers explain why
planned centers have generally higher percentages of space devoted to
(2) Unplanned centers show a general increase of percentage
of office use as center size increases due to the larger market area
requirements of office users in the inlying areas with lower per capita
incomes.
(3) Planned centers show no apparent relation of percent-age of office use to size of center, since developers choose whether or not to include professional and other offices.
0. SPACE DEVOTED TO BANKS, POST OFFICES AND PUBLIC LIBRARIES:
(1) The functional differences in planned and unplanned
centers result from the location of district post offices in larger un-planned centers, the location of public libraries near public transporta-tion, and the location of banks with respect to incomes.
(2) The percentage of space devoted to this use increases as unplanned centers increase in size.
(3) The percentage of space devoted to this use remains rela-tively constant as planned centers increase in size.
P. SPACE DEVOTED TO ENTERTAINMENT AND COMMERCIAL RECREATTON:
(1) Functional differences in planned and unplanned centers
in the allocation of space for commercial recreation and entertainment
results from factors such as the relative demise of the motion picture theatre, the advent of bowling as an acceptable family sport, and the exclu sion from planned centers of those types of recreation places that might "cheapen" the center.
Q
SPACE DEVCTED TO AUTOMOTIVE SERVICE AND REPAIR:(1) Automotive services and repair uses are consciously
17
not to the advantage of the individual entrepreneur of this type of use to locate in planned centers because of their higher rentals, peripheral loc-ations and lack of public transportation. This accouints, then, for the fact that the planned centers studied did not have one square foot of space devoted to this type of use, while unplanned centers often showed high per-centages.
(2) Unplanned centers have little percentage of this use when the center is small. The intermediate-sized centers show the highest percentages of this use because the three factors of rent, location, and
need for long-term parking are optimized from the point of view of the
entrepreneur.
(3) Planned centers contain no space devoted to this use.
This completes a summary of the factual study presented in Chapter 2.
Chapter 3: Planning Implications of the Study
1. Planned shopping centers represent a threat, in the long run, to the retail structure if they are used continually as model forms in
redev-elopment.
2. Planned centers lack many essential components that unplanned
cen-ters contain.
3. Unplanned centers have prcblems, but these problems must be solved
with imagination, and not by applying, as a "rule of thumb," the planned
shopping center-type in every case.
4. The planned center is, today, a developer's concept, and not a con-.
cept of the urban planner.
5.
Alternatives and solutions should be applied to the individual
re-tail center by recognition of the fall range of needs in a market area,
not by neglecting them, as do the planned centers.
CHAPTER 1: A BRIEF REVIEW OF THE CLASSIFICATION AND STRUCTURE
CHAPTER 1
A BRIEF REVIEW OF THE CLASSIFICATTON AND STRUCTURE
OF RETAIL CENTERS IN METROPOLITAN AREAS
Mitchell and Rapkin in their book Urban Traffic explain as part of
their thesis that travel is structured. At one point in their discussion they speculate on the possibility that because the human being in society
leads a structured life, traffic as an activity may also be similarly
struc-tured, being based, after all, on the human being.1 This speculation seems
to be a reasonable approach. Perhaps it could be an explanation for the
structural manifestations of metropolitan retail agglomerations. At any
rate, such an idea is interesting, although unproven. The majority of
theorists, however, see the metropolitan retail pattern as an ordered eco-nomic structure. Thus Ratcliff writes:
A fundamental assumption is that as cities grow and mature,
there tends to evolve a rational pattern or basic structure com-posed of the several functional areas...which comprise the
urban community; that although there are many departures, this pattern tends toward the most efficient and profitable
utiliza-ticn of the land; and that the same basic tendencies appear in
all cities, though often obscured or thwarted by irrational real
estate development or special topographic conditions. This hypothesis is generally accepted as demonstrable by urban
ecolo-gists and land economists.... 2
He continues:
If it can be assumed that urbanism is basically an economic
phenomenon, it is a logical deduction that the internal organiz-ation of cities has evolved as a mechanism to facilitate the
functioning of economic activities. 3
1Robert B. Mitchell and Chester Rapkin, Urban Traffic: A Function of Land Use, Columbia University Press, New York, 195,p.6-9. ~~
2Rtcliff, op.cit., p.2. 3_bid.,
20
The city as a whole is considered by some to be structured. Thus
Bur-gess' Concentric Zone Theory, Hoyt's Sector Theory, and McKenzie's Multiple
Nuclei Theory, all well-known, present conceptual schemes of an ordered physical environment, though all differ in particulars.1 Stressing the
economic function of city structure, Chapin states that "supply and demand
forces of the urban land market...operate to determine the location of
various functional use areas and the siting of specific land uses in the
urban area."2 Eugene Kelley, in Shopping Centers, gives a good account of
the evolution of this line of thought. 3
One of the problems in attempting to set up the theoretidal background for a structured retail network within the retropolitan area is that the major portion of theory has been devoted to regional rather than
intra-city analysis. The region, though defined in many ways, is usually the
space occupied within boundaries comprising an area larger than the metro-politan city. When the theoreticians discuss smaller segments of a region,
which could be city-size, they usually discuss the location of a town or specific industry. However, it seems implicit in most of the analysis
that what is true for the larger region is also true for the smaller metro-politan area or city. If the metrometro-politan area were considered as the
1Ernest W. Burgess, "The Growth of the City," The City, University of
Chicago Press, Chicago, 1925.
-Homer Hoyt, The Structure and Growth of lesidential Neighborhoods in
Ameri-can Cities, Federal Housing Administration, Washington, D.C., 19T9. R.D. McKenzie, The Metropolitan Community, McGraw Hill, New York, 1933.
2F. Stuart Chapin, Jr., Urban Land Use Planning, Harpers, New York, 1957,
p. 19.
3
Eugene J. Kelley, Shopping Centers, The ENO Foundation for Highway Traf-fic Control, Saugatuck, Connecticut, 1956, pp.13-hO.
21
region, then the functional parts of the metropolitan area could be
sub-jected to analysis similar to Lsch's work.
1Hoover, a theoretician, does devote one chapter to the
"Economic
Structure of Communities." In it he asserts that:
Characteristic patterns of internal urban structure arise
from the different requirements of various land uses with
respect to transfer and intrinsic qualities of
land...commer-cial and service facilities needing contact with the
metro-politan area as a whole are mainly at the focus of local
tran-sit routes; retailing of convenience goods and other activities
serving
on1 neighborhoods are
strung along main commuting
arteries...
While industry and agriculture are market-oriented, locating where
they can dispose of their goods to efficient wholesalers or brokers;
com-merce, in the sense of retailing, by its nature is located with respect to
population along transportation routes and, as an inevitable result, to the
position in the environment that places it within reach of the greatest
num-ber of people. The Central Business District can be explained in these
terms. However, another important factor for the location of retail trade
is the positioning of buying power. Thus, in many cases, the best location
is not in the center of population, but somewhere else; namely, the center
of greatest
expenditure.
This can partially explain the growth of planned
suburban shopping centers. Thus Paul E. Smith writes:
Suburbia consists of those family
units which have better than
average incomes, higher than average home ownership, and
big-ger than average families.
31
August L~sch, The Economics of Location, trans. William H. Woglom with the
assistance of Wolfgang F. Stolper from the Second Revised Edition, Yale
University Press, New Haven,
1954.
2
Edgar M. Hoover, The Location of Economic Activity, McGraw Hill, New york,
1948, pp.lh0-lhl.
3
Paul E. Smith,
Shopping
Centers-Planning and Management, The National
Re-tail Dry Goods Association, New
York
195F,~preface.
22
He continues:
This is the cream of all America's market. Today it's the sub-urbs that largely determine the fashions and fads, not the cities themselves....As their customers are moving to the out-lying districts, retailers are following them.1
It is not the intent in this chapter to bring about a discussion of the changing pattern; rather the primary interest here will be on a more static
picture of the retail structure.
Smith mentions the conceptual scheme of balance as a determinant for the network of business centers. Roughly, retail and service stores depend on the freely competitive market for their location. This market
is determined by number of existing stores, influence of other sales areas,
consumer habits, selling and promotional ability of merchants, the need for
certain types of merchandise, income levels, and local economic conditions.
The entire system is almays in balance during any instantaneous period of time, but over time the balance shifts causing some stores to flourish and
others to go into bankruptcy. 2
The tendency for agglomeration of stores has been partially explained by Nelson's theory of cumulative generation: "A given number of stores
dealing in the same merchandise will do more business if they are located adjacent or in proximity to each other than if they are widely scattered."3
The rationale for the statement is that grouped business of the same type draws on a larger market area because of greater choice of goods concen-trated in one location, and because natural competition keeps prices at
l~ih, op.cit.
2Ibid.,
p.67-68.
3
Richard Lawrence Nelson, The Selection of Retail Locations, F.W. Dodge Corporation, New York, 197
p.58.
lower levels. Thus the price competition and convenience to the shopper in offering greater selection at one location aids the grouped stores in increasing their business.
Nelson also, by his rule of retail compatibility, accounts for agglom-eration by different, though compatible, businesses:
Two compatible businesses located in close proximity will show an increase in business volume directly proportionate to
the incidence of total customer interchange between them,
in-versely proportionate to the ratio of the business volume of the larger store to that of the smaller store, and directly proportionate to the sum of the ratios of purposeful purchasing
to total purchasing in each of the two stores.1
This does not mean that the stores create a market where none existed, but
only that they are tapping an existing potential which was unexploited.
Tf Nelson's hypothesis is correct, then agglomeration of stores be-comes practical because it bebe-comes profitable. Given a free economy, the
profit motive should then produce agglomerative tendencies in retail trade. One has only to look at any city to see such tendencies translated into physical fact.
The framework presented has thus far detailed some generalities con-cerning the retail structure. From this point, a closer look at the physical structure itself is in order, but first, a brief review of
clas-sification systems is sketched.
Copeland devised a system of division of retail goods into three groups -- shopping goods, specialty goods, and convenience goods.2 This system is in common use today to delineate business centers on the basis
1
I§elsor, p.66. Purposeful purchasing is defined as the major purpose of a
shopping trip.
2
Ratcliff, p.62, citing M.T. Copeland, The Principles of Merchandising,
214
of buying habits. ASPO defines two of the three as follows:
Shopping Goods are those items which are bought infrequently and are often high-priced. The term...implies that a potential pur-chaser may be expected to compare the prices and qualities of a number of items prior to his final selection. Expensive watches
and
jewelry,
television sets, large and expensive pieces offurniture and the like are examples of shopping goods.
Convenience Goods are goods purchased frequently and at more or ss regular intervals. Food, drugs, hardware, and many items of
clothing and accessories are classified as convenience goods.1
No one has adequately defined specialty goods. Roughly one could say
that these are items which are bought infrequently, are expensive, and may require more comparison than shopping goods. Thus, diamond rings are an example of specialty goods.
There is no precise agreement as to what the first two terms mean exactly, and quotations could he given ad infinitum to illustrate the con-flicting views. However, the concept of a division of retail goods is im-portant because it colors the view of many authors as to the function of particular centers.
Another basis for a breakdown or classification of retail groupings is in the basis of the number of stores contained. Thus, as an illustrative example, Applebaum and Schapker classified centers in Cincinnati by the scheme presented in Table 1.2 One can think of many similar breakdowns of centers by number, such as, for example, the well-known Boston Globe Map. In general, this system lends itself to all kinds of "pie cutting."
lPlanning Advisory Service, "Information Report No.
17;
NeighborhoodThisi-ness tricts," American Society of Planning Officials, Chicago, August
1955, p.l.
2
William Applebaum and Bernard Schapker, A Quarter Century of Change in Cincinnati Business Centers, Cincinnati
Enquirer,
1956, p.7.TABLE 1
TYPE CENTER TOTAL NO. BUSINESS SHOPPING GOODS
ESTABLISHMENTS ESTABLIS1MENTS
Large 100 plus 30 plus
Medium 0-100 10-29
Small 3-39 0-9
Small centers consist "essentially of stores carrying
convenience goods or shops providing the most common
services for a small neighborhood."
Medium centers are "...intennediate in character and importance."
Large centers have "many diversified types of business
establishments and serve large communities."
Another method of classification of business centers is by the form that they take. Thus the terms nucleations, compact clusters, string streets, string development, isolated stores, cruciforms, and the like are
often used to classify centers.
Leslie H. Graef defines compact centers as those having a length to width of less than three to one, with more than five stores per cluster
(un-interrupted store frontage) on two practically equal thoroughfares and ex-tending more than 600 feet in any one direction. A small compact center is one having less than fifteen stores and extending, on the average, not more than three blocks. Core centers have a length to width ratio of less than
three to one with less than five stores per cluster, but are not located on
equally important streets; one is usually a major street and the other is of
less importance.
Extended centers, which are compact centers with a "tail," have a length to width ratio of less than three to one with less than four point
26
five (4.5) stores per cluster. Near the nucleus there is a major inter-section. Occasionally the store cluster is greater than
h.5
but the lengthto width ratio is too great to include the center in the compact category.
Finally, the string complex has a length to width ratio of more than
five to one,
with
less than three
point five
(3.5)
stcres per cluster.
This type occurs on
a major street extending usually more than 600 feet.
1Still another means of classification of centers is by their
relation-ship to market area.
Such
systems include
the common terms neighborhood
center, community center, regional center,
district center. An ordered
hierarchy i s sometimes i ndicated by adjectives such as "Primary, Major,
Tntermediate, Minor, and Local."
2Another means of classification is the system of arrangement of
cen-ters from the largest center, always the Central Business District. This
system starts with the Central Business District, moves outward to the intermediate-positioned centers, and finally to outlying or suburban
cen-ters.
The intermediate and outlying centers may be of equal size, though
both are by definition smaller than the Central Business District. Filling
the gaps in the market areas of these centers are even smaller centers scattered about the landscape with some relationship to the population
and/or income density.
The classification of business centers by size, usually gross floor area (GFA), but sometimes by ground coverage only, is another system. Fere 1
Leslie F. Graef, A Study of Urban Business Centers With Emphasis on
Re-tail String Developmient, unpublished M.C.P. thesis, Massachusetts Tnstitute
of Technology, Cambridge, 1954, pp.97-98.
2Boston Globe Map.
27
the largest center
is
the center with the most floor-space and so on down
the line. Such a system is used in Chapter 2 of this work.
Another scheme involves the positioning of centers with respect to
transportation. Thus there may be highway-oriented centers, major street
intersection centers, public transit-stop or terminal centers, inter-urban
highway centers, and minor or residential street centers or blocks.
A final means of classification is by front footage devoted to retail
use in a given area. This system, howver, is generally out of favor as it
is not a very accurate indicator.
In strict fact, all such systems consider the retail structure to be
an ordered arrangement. Without such an assumption there would be no point
in classification. Although there may be other systems of classification,
the above review covers the major ones. Some of the total conceptions of
retail structures may now be examined.
Ratcliff discusses the structure by identifying the Central Business
District as having separate parts from which string streets emenate, leading,
eventually, to outlying districts.
1More specifically, the Central Business District consists of a central
shopping area which is 100 percent intensive because it is the most
acces-sible spot to the greatest number of persons. Here are located the large
department stores, variety stores, smart apparel stores, specialty shops,
drug stores, and restaurants.
2The second area of the Central Business District is the less intensive
1
Ratcliff, pp.8-17.
2
-Iw1
28
central shopping area, which, because it is not at the exact center of
accessibility, has a lesser attraction for high rent payers. Here are
located popularly priced department stores, men's wear, furniture stores,
family apparel stores, sporting goods stores, and the more popularly priced
restaurants. A part of this district may be sub-classified as the
enter-tainment area.1
The third area of the Central Business District is the low grade
busi-ness area and contains pawn shops, food stores, pool and beer halls, bur-lesque houses, auto supplies, repair services, and cheap restaurants.2
The final area of the Central Business District is located where the
central area tapers off in the direction of the better suburbs. This area
is the specialty shop area, containing such stores as very fashionable
jewelry and apparel stores catering to the so-called "carriage trade."3
The string streets are not precisely defined, but the nature of the
uses depends on traffic or the location with respect to residential
devel-opment. Often the patrons are merely passing, i.e., transients.h Here
Ratcliff cites Malcolm T. Proudfoot in defining string streets. The string
street has two divisions, namely, principal business thoroughfares
charac-teristically having dense traffic, large size shopping and convenience goods
stores, and ample curb parking; and neighborhood business streets
charac-teristically having significance primarily for the surrounding residential
development, within walking distance, and containing convenience goods
'Ratcliff, p.8.
2-Ibid. .
stores and minor shopping goods stores.
The nucleated development takes two forms: the first, the outlying business center, contains shopping goods and convenience stores and is
transportation-oriented; the second, isolated store clusters, contain two or more complementary rather than competitive convenience goods stores.1
To sum up then, Ratcliff considers the retail structure in terms of a
functionally differentiated central area; nucleated outlying business
cen-ters; principal business thoroughfares; and community business areas
divi-ded into neighborhood business streets, isolated store clusters, and single isolated retail stores. The Central Business District is viewed as essen-tially nucleated, rather than a string street development. Ratcliff then
generalizes by stating:
Regardless of the usefulness of extended subclassification of retail conformation, it does appear that there are two basic
forms -- the nucleation (which describes the central business district as well as outlying clusters) and the string street.
The essential difference between the two is the lack of internal
organization in the case of the string street as compared with the more definite pattern in arrangement of uses which charac-terizes the nucleation.
This pattern is not a haphazard design but has appeared in
response to definite needs and demands. Tt is as much a part
of the mechanism of distribution as the railroad or motor truck,
and the underlying arrangement of its component parts is equally rational. The specialization of function...showing relative
importance of the several commodity groups in different types of
retail clusters /exists in his data7. A more particularized
examination woula probably reveal 'unctional differences among
the retail areas which are reflections of the habits and require-ments of special consumer groups. A final demonstration of the economic foundation of the retail structure can be found with
respect to the vehicular transportation system and the
residen-tial areas.2
1
Ratcliff, p.12, citing Malcolm T. Proudfoot, Intra-City Business Census Statistics for Philadelphia, Pennsylvania, U.S. Department of Commerce,
Washihgton, D.C., 1935, pp.3l
2