HAL Id: hal-01938089
https://hal.archives-ouvertes.fr/hal-01938089
Submitted on 12 Jul 2019
HAL is a multi-disciplinary open access
archive for the deposit and dissemination of sci-entific research documents, whether they are pub-lished or not. The documents may come from teaching and research institutions in France or
L’archive ouverte pluridisciplinaire HAL, est destinée au dépôt et à la diffusion de documents scientifiques de niveau recherche, publiés ou non, émanant des établissements d’enseignement et de recherche français ou étrangers, des laboratoires
Microporous/Mesoporous Materials: The Case of
Mesoporous FAU-Y Zeolites
Anne Galarneau, Dirk Mehlhorn, Flavien Guenneau, Benoit Coasne, François
Villemot, Delphine Minoux, Cindy Aquino, Jean-Pierre Dath
To cite this version:
Anne Galarneau, Dirk Mehlhorn, Flavien Guenneau, Benoit Coasne, François Villemot, et al.. Specific Surface Area Determination for Microporous/Mesoporous Materials: The Case of Meso-porous FAU-Y Zeolites. Langmuir, American Chemical Society, 2018, 34 (47), pp.14134-14142. �10.1021/acs.langmuir.8b02144�. �hal-01938089�
Specific surface area determinations for microporous/mesoporous
materials: the case of mesoporous FAU-Y zeolites
Anne Galarneau
1*, Dirk Mehlhorn,
1Flavien Guenneau,
2Benoit Coasne,
3Francois
Villemot,
4Delphine Minoux,
5Cindy Aquino,
5Jean-Pierre Dath.
51ICGM UMR 5253 CNRS - Univ Montpellier - ENSCM, ENSCM 240 Av Pr E. Jeanbrau, 34296
Montpellier cedex 5, France.
2Sorbonne Université, CNRS, Collège de France, Laboratoire de Chimie de la Matière
Condensée, LCMCP, F-75005 Paris, France.
3Laboratoire Interdisciplinaire de Physique (LIPhy), CNRS and University Grenoble Alpes, 140
rue de la Physique, Domaine Universitaire, BP 87, 38402 Saint Martin d’Heres Cedex.
4CEA/Saclay, NIMBE, LIONS, 91191 Gif sur Yvette Cedex, France.
5Total Research&Technology Feluy, Belgium.
*E-mail: anne.galarneau@enscm.fr
Keywords: micropore surface, mesopore surface, t-plot, BET equation, hierarchical material,
nitrogen isotherm, H-Y, MCM-41
ABSTRACT: A methodology for determining from N2 adsorption isotherms at 77 K the
micropore, mesopore, and external surface areas of hierarchical microporous/mesoporous
3 4 5 6 7 8 9 10 11 12 13 14 15 16 17 18 19 20 21 22 23 24 25 26 27 28 29 30 31 32 33 34 35 36 37 38 39 40 41 42 43 44 45 46 47 48 49 50 51 52 53 54 55 56
materials is described. For FAU-Y zeolite, the microporous surface area calculated using the Rouquerol criterion and the BET equation is in accord with the geometrical surface determined by the chord length distribution method. Therefore BET surface area (SBET) is well representative
of micropore surface areas of microporous materials and of total surface area of microporous/mesoporous materials. Mechanical mixtures of mesoporous MCM-41 and microporous FAU-Y powders of known surface areas were used to calculate the respective surface areas by weighted linear combination and the results were compared to the values obtained by the t-plot method. The first slope of the t-plot determined the mesopore + external surface areas (Smes+ext). The linear fit of the first slope is in general in the range 0.01 < p/p0 < 0.17
and contains the volumes and relative pressures at which all micropores are filled (p/p0 > 0.10).
Overestimation of Smes+ext values was evident and appropriate corrections were provided.
External surface areas (Sext) were obtained from the second slope of the t-plot, without noting an
overestimation of Sext, thus allowing the determination of mesopore surface areas (Smes) by
difference. Micropore surface areas were calculated by subtracting Smes+ext from the total surface
area, SBET. As an example, this methodology was applied to the characterization a family of
hierarchical microporous/mesoporous FAU-Y (FAUmes) synthesized from H-FAU-Y (H-Y, Si/Al = 15) using C18TAB as surfactant and different NaOH/Si ratio (0.05 < NaOH/Si < 0.25). By increasing the NaOH/Si ratio in synthesis of FAUmes, it was shown that as the micropore surface area decreases, the mesopore surface area increases, while the micropore + mesopore surface area remains constant. This methodology allows accurate characterization of the surface areas of microporous/mesoporous materials.
3 4 5 6 7 8 9 10 11 12 13 14 15 16 17 18 19 20 21 22 23 24 25 26 27 28 29 30 31 32 33 34 35 36 37 38 39 40 41 42 43 44 45 46 47 48 49 50 51 52 53 54
INTRODUCTION
Microporous materials such as zeolites, metal-organic frameworks, and porous carbons are widely used in catalysis, separation, selective adsorption, and metal decontamination.1,2 These
applications benefit from the large surface areas and small pore sizes of these materials, leading to strong interactions with the surface. However, these materials suffer from internal diffusion limitation due to the small size of their pores, which limits their efficiency.1 In Order to increase
the transport in microporous materials, mesopores have been created to produce micro-/mesoporous materials.3-7 One simple way to create mesopores in microporous zeolites consists
of a post-treatment in basic medium with alkyltrimethylammonium surfactants.8-10 Such
hierarchical structures retain the micropores needed for a specific application and provide improved transport properties due to the presence of mesopores. The portions of micropore and mesopore surfaces are key factors to better understand these materials, which most of the time are characterized by their specific surface areas.
There are two main tools to calculate specific surface areas from adsorption measurements: the BET equation and the t-plot method, both being subject to controversy for materials containing micropores.11-16 The t-plot method is a widely used procedure to estimate the
total surface area as well as the external surface area of materials. In this method, the average thickness of an adsorbed film is first determined for a reference material containing no porosity, or only macroporosity, and having the same surface chemistry as the studied porous material. Then the so-called t-plot is created by plotting the adsorbed volume at a given pressure against the average thickness of the adsorbate film (t) obtained at the same pressure for the non-porous
3 4 5 6 7 8 9 10 11 12 13 14 15 16 17 18 19 20 21 22 23 24 25 26 27 28 29 30 31 32 33 34 35 36 37 38 39 40 41 42 43 44 45 46 47 48 49 50 51 52 53 54 55 56
reference material.15,16 For mesoporous materials, the adsorbed volume (V) varies linearly with
the film thickness (t) and passes through the origin. The total surface area (Stot) is directly given
by the slope of the first linear fit at low pressure with V = Stot t. Once all pores are filled,
adsorption occurs only on the external surface of the material and leads to a second linear fit at high pressure, the slope of which allows the determination of the external surface (Sext) with V =
Sext t.
For materials containing micropores, the first linear fit of the t-plot at low pressure most of the time does not pass through the origin or is not linear at very low pressure.15 The first linear
fit is done using several data points and the intercept with the Y-axis is usually taken to be the micropore volume. However, it was demonstrated experimentally in a previous publication12 that
the t-plot method underestimates the micropore volume when it exceed more than 10% of the total pore volume. By modeling, it also was highlighted that the t-plot method overestimates the surface areas of hierarchical microporous/mesoporous materials, such as mesoporous MOF structures (CuBTC).13 One goal of the present study is to verify experimentally this observation
of overestimation of surface area by t-plot analysis.
To analyze carefully micropore and mesopore surface areas in a material by the t-plot method, it is of prime importance to use a good reference isotherm with the same surface chemistry as the analyzed materials. Different models of film thickness (e.g., Harkins and Jura, Halsey, Lecloux, etc) have been proposed in the literature.16 But none of them are accurate for
porous silica. As shown previously for purely mesoporous MCM-41 silica with a mesopore diameter of 4 nm, the t-plots do not pass through the origin.12 Consequently, reference isotherms
for materials of similar surface chemistry first need to be established. Toward this end, reference isotherms have been recorded for different types of non-porous12 and macroporous silica17 and all
3 4 5 6 7 8 9 10 11 12 13 14 15 16 17 18 19 20 21 22 23 24 25 26 27 28 29 30 31 32 33 34 35 36 37 38 39 40 41 42 43 44 45 46 47 48 49 50 51 52 53 54
Another way to calculate total surface area is to fit the adsorption data to the BET equation. This is a routine characterization technique for porous materials.11,14-16 The BET
specific surface area (SBET) is usually assessed from adsorption experiments prior to capillary
condensation of the fluid. The hypothesis of the BET model is that (1) adsorption occurs on energetically homogeneous sites and (2) molecules can adsorbed on each other.11,14-16 In this case,
the adsorption energy for all molecules adsorbed above the first layer is constant and equal to the cohesion energy in the bulk liquid. The pressure range used to estimate the BET surface should follow the Rouquerol criterion,11,14,15,18 which makes use of the adsorption data up to the p/p
0
pressure where V(1-p/p0) exhibits a maximum. Adsorption beyond this value represents the point
where the adsorbed amount increases less rapidly with pressure in comparison to the first adsorbed layer.15
The resulting monolayer capacity Vm obtained from the BET plot provides a reasonable
estimate of the geometrical surface when Vm is converted to surface area using the common value
of 0.162 nm2 for the molecular cross section of nitrogen.15 However, care should be taken when
using this approach. Depending on the surface chemistry of the material, the ovoid nitrogen molecules can pack differently on the surface. The effective cross sections for nitrogen, for instance, can varying from 0.135 nm2 for hydroxylated silica surfaces to 0.162 nm2 for
hydrophobic surfaces.19
The present study is in two parts. The first part concerns the use of the BET equation and the t-plot method to assess surface areas for micro-/mesoporous materials. The surface area determined by the BET equation for microporous FAU-Y zeolite is compared to the geometrical calculation of the surface by chord length distribution. The surface areas for micro-/mesoporous samples are compared to the areas determined by linear combination of the adsorption data for mechanical mixtures of FAU-Y and MCM-41 with known micropore and mesopore surface
3 4 5 6 7 8 9 10 11 12 13 14 15 16 17 18 19 20 21 22 23 24 25 26 27 28 29 30 31 32 33 34 35 36 37 38 39 40 41 42 43 44 45 46 47 48 49 50 51 52 53 54 55 56
areas, respectively. A methodology is proposed to decouple the micropore, mesopore and external surface areas of the materials.
In the second part of this study, the corrected surface areas determined from the t-plots of mechanical mixtures of MCM-41 and FAU-Y are used to obtain the micropore and mesopore surfaces of a family of hierarchical micro-/mesoporous FAU-Y materials (denoted FAUmes) synthesized by post-treatment of FAU-Y in presence of octadecyltrimethylammonium (C18TAB) surfactant in basic medium at different NaOH/Si ratios (0.05 < NaOH/Si < 0.25).
EXPERIMENTAL SECTION
Synthesis of mesoporous FAU-Y (FAUmes). In a beaker (250 mL), x g of NaOH pellets
(x = 0.199 – 1.998 g) was added to 180 g of H2O and the mixture was magnetically stirred until
complete dissolution at room temperature (25 °C). Then 7.843 g of octadecyltrimethylammonium bromide (C18TAB) was added and stirring was continued until dissolution was again complete. The magnetic stirrer was then replaced by an endless screw stirrer, which is more gentle and necessary to keep the particle size and shape of the initial particles. The endless screw stirrer was described previously for the pseudomorphic transformation of silica particles into MCM-41 particles.20 Then 12g of the parent dealuminated H-FAU-Y zeolite (Si/Al = 15), obtained from
Zeolyst under the trade name CBV720, was then added and the mixture stirred for 1-2 h at room temperature (25 °C) to obtain a homogeneous white suspension. The suspension was then transferred into a Teflon-lined stainless-steel autoclave (250 mL) and kept under static conditions for 20 hours at 115 °C. The resulting mixture was then filtered and washed with water until neutral pH. The sample was dried in an oven at 80 °C for 12 h and calcined at 550 °C for 8 h
3 4 5 6 7 8 9 10 11 12 13 14 15 16 17 18 19 20 21 22 23 24 25 26 27 28 29 30 31 32 33 34 35 36 37 38 39 40 41 42 43 44 45 46 47 48 49 50 51 52 53 54
(heating rate 5 °C/min). The molar ratios of the reaction mixtures were 1.0 FAU-Y / 0.10 C18TAB / n NaOH / 50 H2O (n = 0.025 – 0.25).
Synthesis of MCM-41. Al-MCM-41(C16, Si/Al = 15), used in the preparation of
mechanical mixtures of FAU-Y and MCM-41, was synthesized as follows. NaAlO2 (Carlo Erba)
was added to an alkaline solution containing cetyltrimethylammonium bromide surfactant (C16TAB) (Aldrich). The mixture was stirred at 50 °C until complete dissolution before adding Aerosil 200 silica (Degussa) and stirring for 1 h. The composition of the mixture in molar ratio is 1 SiO2 / 0.07 NaAlO2 / 0.1 C16TAB / 0.25 NaOH / 50 H2O. The slurry was then placed in a
stainless-steel autoclave and heated at 115 °C for 24 h. The resulting material was then filtered and washed until neutral pH, dried at 80 °C, and calcined at 550 °C for 8 h under air-flow.
Materials Characterization. N2 adsorption isotherms at 77 K were measured on a
Belsorb apparatus using 200-300 mg samples outgassed in vacuum at 250 °C for 12 h before analysis. Ar adsorption isotherms at 87 K were obtained on a Quantachrome Autosorb-1C apparatus. The 50-mg samples were outgassed under vacuum at 200 °C for 20 h before analysis.
RESULTS AND DISCUSSION
Surface areas of FAU-Y and MCM-41. The nitrogen sorption isotherms at 77 K of FAU-Y and
MCM-41 are reported in Figure 1 and t-plot curves are provided in Figure 2. The surface areas of FAU-Y and MCM-41 were determined using the BET equation and the t-plot method.
3 4 5 6 7 8 9 10 11 12 13 14 15 16 17 18 19 20 21 22 23 24 25 26 27 28 29 30 31 32 33 34 35 36 37 38 39 40 41 42 43 44 45 46 47 48 49 50 51 52 53 54 55 56
b a
d c
Figure 1. Nitrogen sorption isotherms at 77 K of (a) H-FAU-Y (Si/Al = 15) (CBV720), (b)
Al-MCM-41(C16) (Si/Al = 15) and hierarchical microporous/mesoporous Na-FAU-Y (Si/Al = 15), named FAUmes, synthesized from H-FAU-Y and C18TAB surfactant with different NaOH/Si ratio (c) FAUmes – NaOH/Si = 0.10 and (d) FAUmes – NaOH/Si = 0.25.
3 4 5 6 7 8 9 10 11 12 13 14 15 16 17 18 19 20 21 22 23 24 25 26 27 28 29 30 31 32 33 34 35 36 37 38 39 40 41 42 43 44 45 46 47 48 49 50 51 52 53 54
Vtot Smes+ext Sext b Sext Vtot Vmic-FAU-Y Vmic-tpt a Vtot Vmic Smes+ext Sext d Vtot Vmic Smes+ext Sext c
Figure 2. t-plot curves of (a) H-FAU-Y (Si/Al = 15) (CBV720), (b) Al-MCM-41(C16) (Si/Al =
15) and hierarchical microporous/mesoporous Na-FAU-Y (Si/Al = 15) synthesized from H-FAU-Y and C18TAB surfactant with different NaOH/Si ratio (c) FAUmes(C18) – NaOH/Si = 0.10 and (d) FAUmes(C18) – NaOH/Si = 0.25. t-plots were produced using (crosses) Aerosil 200 as reference isotherm and fitted by Eq. 5-7 for the pressure range 0.01 < p/p0 < 0.80. For the low
3 4 5 6 7 8 9 10 11 12 13 14 15 16 17 18 19 20 21 22 23 24 25 26 27 28 29 30 31 32 33 34 35 36 37 38 39 40 41 42 43 44 45 46 47 48 49 50 51 52 53 54 55 56
pressure range (p/p0 < 0.01) t-plots were produced using (circles) LiChrospher 1000 (Si1000) as
reference isotherm described by Jaroniec et al.17 (see supporting informations for the equations).
The BET surface areas have been calculated using the Rouquerol criterion.11 The Rouquerol plot,
which is V(1-p/p0) as a function of p/p0, has been plotted to identify the first maximum pressure
useful for a linear fit to the BET equation (Eq. 1).
(1)
The adsorption data are then fit to the BET equation (Eq. 1) by a linear regression (y = ax + b). The slope a and the intercept b are used to calculate the monolayer volume (Vm) and then the
BET surface area (SBET) with the following equations (Eq. 2,3):
Vm = 1/(a+b) (2)
(3)
where VN2 is the molar gas volume, NA is Avogadro number, and σN2 is the cross-section of the
N2 molecule, which corresponds experimentally to (Eq. 4) for σN2 = 0.162 nm2:
SBET (m2/g) = 4.36 Vm (mL STP) (4) 3 4 5 6 7 8 9 10 11 12 13 14 15 16 17 18 19 20 21 22 23 24 25 26 27 28 29 30 31 32 33 34 35 36 37 38 39 40 41 42 43 44 45 46 47 48 49 50 51 52 53 54
For MCM-41, the BET surface area was 843 m2/g.
The use of BET equation for microporous materials surface analysis is subject to controversy. However, computational studies of hierarchical micro-/mesoporous MOF materials (e.g., CuBTC) demonstrated that the BET surface area is well representative of the total surface area (micropore + mesopore + external surface areas). Moreover, the BET surface area is in agreement with the accessible surface area calculated by chord length distribution (Schord = 2187
m2/g and S
BET = 2108 m2/g),18 provided the Rouquerol criterion is respected. Similar results have
been obtained for a purely microporous MOF (Schord = 1979 m2/g and SBET = 1958 m2/g).18 it is
therefore possible to use a BET calculation to determine the total surface area for materials containing microporosity.
The nitrogen isotherm at 77 K for FAU-Y has been recorded (Figure 1) and the BET surface area has been calculated taking into account the Rouquerol criterion. SBET for FAU-Y is
937 m2/g. This value is close, but slightly lower than the accessible total surface area of FAU-Y
calculated by computational chord length distribution (Schord = 1259 m2/g). The reported surface
area of FAU-Y accessible to water molecules (0.28 nm kinetic diameter) is 1211 m2/g, in
accordance with the chord length distribution calculation of this study.21 The experimentally
calculated SBET from the N2 isotherm is lower (SBET = 937 m2/g), which can be explained by the
use of the larger nitrogen molecule (0.364 nm kinetic diameter).
The BET surface area of FAU-Y was also determined from Ar isotherms at 87 K (SBET =
821 m2/g). This latter value is lower than the one obtained with N
2. Ar has a similar kinetic
diameter (0.34 nm) as N2,22 but Ar is a globular nonpolar molecule that leads essentially to
non-specific interactions with all types of adsorbents. On the other hand, N2 has a particular ovoid
shape and is quandrupolar, leading to specific interactions with hydroxylated surfaces. One hypothesis is that the ovoid shape of N2 allows nitrogen to partially enter the sodalite cages
3 4 5 6 7 8 9 10 11 12 13 14 15 16 17 18 19 20 21 22 23 24 25 26 27 28 29 30 31 32 33 34 35 36 37 38 39 40 41 42 43 44 45 46 47 48 49 50 51 52 53 54 55 56
(window aperture approx. 0.28 nm). Argon apparently only probes the supercages of FAU-Y (window aperture 0.74 nm). Thus, the total micropore + external surface area of FAU-Y, as determined using the BET equation, is 937 m2/g and 821 m2/g, respectively, when nitrogen and
argon are used as adsorbates.
The second way to calculate the surface areas of porous materials is by the t-plot method, which plots the volume adsorbed as a function of the thickness (t) of the adsorbed film.15,16 In
order to obtain accurate t-plot curves, the choice of a reference isotherm with a surface chemistry similar to the studied material is essential. A non-porous silica (Aerosil-200) was used in this study as a reference isotherm over the partial pressure range 0.009 < p/p0 < 0.80. For this range of
pressure, the Aerosil 200 reference isotherm is in good agreement with the reference isotherms reported by Jaroniec et al.17 for the macroporous silica LiChrospher Si-1000, as well as other
forms of standard adsorption isotherms.17 For our study, the Aerosil 200 reference isotherm was
fit by parts to Eqs. 5-7 below. In comparison to the fitting procedure we reported in a previous publication,12 the present fitting results were in better agreement with the data presented by
Jaroniec et al.17 These new fits were preferred for this study.
Equations 5-7 were used to transform p/p0 into adsorbate layer thickness t:
0.009 < p/p0 < 0.12 t = 1.62973 + 76.4748 (p/p0) - 2171.7914 (p/p0)2 + 41734.77357 (p/p0)3 - 465290.41181 (p/p0)4 + 2.72432.106 (p/p 0)5 - 6.43708.106 (p/p0)6 (5) 0.13 < p/p0 < 0.60 t = 3.07721 + 5.64019 (p/p0) (6) 3 4 5 6 7 8 9 10 11 12 13 14 15 16 17 18 19 20 21 22 23 24 25 26 27 28 29 30 31 32 33 34 35 36 37 38 39 40 41 42 43 44 45 46 47 48 49 50 51 52 53 54
0.60 < p/p0 < 0.80
t = 4592.05803 - 38117.31548 (p/p0) + 131602.19741 (p/p0)2 - 241680.40239 (p/p0)3 +
249079.8569 (p/p0)4 - 136632.44762 (p/p0)5 + 31182.4149 (p/p0)6 (7)
In order to obtain mesopore + external surface areas (Smes+ext), the first linear t-plot fit was
carried out at low t with the equation:
S(m2/g) = Slope/(ρ
N2gas/ ρN2liq) (8)
corresponding experimentally to:
S(m2/g) = (Slope/646) 104 (9)
For external surface area determinations (Sext), the second linear fit of the t-plot (Figure 2) was
performed at t below 0.92 nm; that is, at pressures below p/p0 = 0.8 where the domain of validity
is observed for the t-plot curve obtained for Aerosil-200. Sext is calculated from the slope of the
second linear fit at high t (Eq. 9).
The t-plot curve of MCM-41 shows two slopes (Figure 2), one before the condensation step due to mesopore filling and one after due to the adsorption on the external surface. The first slope represents the total surface area (mesopore + external surface), which is equivalent to BET the surface area for mesoporous materials, and the second slope at high pressure represents the external surface area. The mesopore surface area is calculated by difference between the total surface area and the external surface area. This can be done by two ways: the subtraction of the external surface area from the total surface area determined by (i) the BET equation or (ii) by the
3 4 5 6 7 8 9 10 11 12 13 14 15 16 17 18 19 20 21 22 23 24 25 26 27 28 29 30 31 32 33 34 35 36 37 38 39 40 41 42 43 44 45 46 47 48 49 50 51 52 53 54 55 56
t-plot. The total pore volume (or mesopore volume in the case of MCM-41) is obtained when the experimental points start being inferior to the second linear fit of the t-plot at high pressure (high t, Figure 2). The external surface of MCM-41 is 143 m2/g. A good correlation was found for
MCM-41 between BET surface area (843 m2/g) and mesopore + external surface area (823 m2/g)
determined by t-plot. The error in surface area determination is therefore ± 20 m2/g or around 2.5
% of the measured surface areas. The mesopore surface (Smes) of MCM-41 is then calculated by
difference between SBET and Sext (Smes = 700 m2/g) or between Smes+ext and Sext (Smes = 680 m2/g).
The total or mesopore volume of MCM-41 (V = 0.66 mL/g) was taken as the point where the second slope of the t-plot departs from the experimental data (Figure 2).
In order to calculate the micropore surface area of FAU-Y, the external surface was first determined from the t-plot. The use of t-plot method for calculating the surface areas of microporous materials is subject to controversy13,15 and only external surface area calculation is
recommended using the fit at high pressure (or high film thickness).15 T-plot of FAU-Y was
determined (Figure 2) and Sext for FAU-Y was calculated (85 m2/g). The micropore surface (Smic)
of FAU-Y was then obtained by the difference between SBET and Sext, which provided the value
Smic = 852 m2/g. The micropore volume of FAU-Y is difficult to assess by the t-plot method due
to the compressibility of nitrogen in micropores,15 which, contrary to nitrogen in mesopores,
leads to a non-constant nitrogen film thickness for a given pressure. The thickness of the film increases with decreasing micropore diameter.15 For materials containing micropores, the
intercept of the first slope with the Y-axis usually is used to determine the micropore volume. But as shown by computational studies for pure microporous or micro-/mesoporous materials, t-plots underestimate micropore volumes15 and overestimate surface areas.13 The underestimation of
micropore volume by t-plot method has been demonstrated experimentally for materials
3 4 5 6 7 8 9 10 11 12 13 14 15 16 17 18 19 20 21 22 23 24 25 26 27 28 29 30 31 32 33 34 35 36 37 38 39 40 41 42 43 44 45 46 47 48 49 50 51 52 53 54
measure exactly the micropore volume by t-plot as a few small mesopores (2- 4 nm) arise in the material through dealumination, leading to additional volume. However the examination of the nitrogen adsorption at very low pressure expressed as log(p/p0) (Figure S1) allows better
identification of these small mesopores. The micropore volume (Vmic) of FAU-Y has been
assumed to be filled completely at p/p0 = 0.1 (Vmic = 0.317 mL/g). Thus, the intercept of the first
slope of the t-plot with the Y-axis (Figure 2) for this purely micoporous material is misleading, because it corresponds instead to the underestimated value of (Vmic)tpt = 0.232 mL/g.12
By careful use of BET equations and t-plot methods, it was possible to assess the different surface areas for purely mesoporous materials and purely microporous materials. For mesoporous MCM-41, the two types of surface areas were Smes = 680-700 m2/g and Sext = 143 m2/g, whereas
for FAU-Y, surface areas were Smic = 852 m2/g and Sext = 85 m2/g.
Surface areas of mechanical mixtures of FAU-Y and MCM-41. As said previously, for
micro-/mesoporous materials, it has been shown by modeling that the t-plot method overestimates surface areas.13 To experimentally verify this conclusion, mechanical mixtures with different
weighted portions of FAU-Y and MCM-41 with known micropore and mesopore surfaces, respectively, have been prepared by simple powders mixing without grinding and analyzed by nitrogen adsorption at 77 K. The micropore and mesopore surface areas of the mixtures have been calculated independently by linear combination and compared to the results of the t-plot analysis (Figures 3, S3). 3 4 5 6 7 8 9 10 11 12 13 14 15 16 17 18 19 20 21 22 23 24 25 26 27 28 29 30 31 32 33 34 35 36 37 38 39 40 41 42 43 44 45 46 47 48 49 50 51 52 53 54 55 56
Figure 3. For mechanical mixtures of MCM-41 and FAU-Y, comparison of mesopore + external
surface areas Smes+ext determined by t-plot method (Smes+ext)tpt and calculated by linear
combination (Smes+ext)calc as a function of the ratio of micropore volume to total pore volume
determined by t-plot (Vmic/Vtot)tpt. (Smes+ext)calc were determined by 3 different ways: (1) by
subtracting the weighted micropore surface of FAU-Y from SBET of the mixture (circles), (2) by
adding the weighted Sext of the mixture to the weighted mesoporous surface Smes of MCM-41
calculated either from (i) SBET-Sext (triangles) or (ii) from Smes+ext-Sext (squares). The dashed line
represents the fits of these points, which will be used to correct the (Smes+ext)tpt of hierarchical
microporous/mesoporous FAU-Y (FAUmes) materials.
3 4 5 6 7 8 9 10 11 12 13 14 15 16 17 18 19 20 21 22 23 24 25 26 27 28 29 30 31 32 33 34 35 36 37 38 39 40 41 42 43 44 45 46 47 48 49 50 51 52 53 54
The external surface areas (Sext)calc and the mesopore + external surface areas
(Smes+ext)calc of the mechanical mixtures of MCM-41 and FAU-Y were first calculated by
weighted linear combination of the two types of surface areas. The “calculated” mesopore + external surface areas, (Smes+ext)calc, were determined in three different ways: (1) by subtracting
the weighted micropore surface of FAU-Y from the total surface SBET of the mixture (Figures 3,
S3, circles), (2) by adding the weighted Sext of the mixture to the weighted mesoporous surface
Smes of MCM-41 calculated either from (i) SBET-Sext (Figures 3, S3, triangles) or (ii) from Smes+ext
-Sext (Figures 3, S3, squares). All of these approaches to calculate (Smes+ext)calc for the mechanical
mixtures are in good agreement (Figures 3, S3). The slightly lower values of (Smes+ext)calc
calculated by method 1 (Figures 3, S3, circles) are due to a small contribution of the mesopore surface in Smic of FAU-Y due to the fact that FAU-Y is a dealuminated zeolite and contains a
small volume (0.036 mL/g) of small mesopores (diameter between 2 – 4 nm).
For the mechanical mixtures of FAU-Y and MCM-41, the mesopore + external surface areas (Smes+ext)tpt and micropore volumes (Vmic)tpt were then determined from the first linear fit
of the t-plot at low t (Figure S2). The linear fit of the first slope is in general in the range 0.01 < p/p0 < 0.17, corresponding to 0.2 < t < 0.4 nm, and contains the volumes and relative pressures at
which all micropores are filled (ie. p/p0 > 0.10, corresponding to t > 0.36 nm). The micropore
volume (Vmic)tpt was obtained from the intercept of the first linear fit (low t) with the Y-axis and
(Smes+ext)tpt was calculated from the slope of this first fit (low t) with Eq. 9. The external surface
area (Sext)tpt was determined using Eq. 9 and the second linear fit of the t-plot (Figure S2)
performed at high t below 0.92 nm. The second linear fit corresponded to pressures below p/p0 =
0.8 where the domain of validity was observed for the t-plot curve for the Aerosil-200 silica reference. 3 4 5 6 7 8 9 10 11 12 13 14 15 16 17 18 19 20 21 22 23 24 25 26 27 28 29 30 31 32 33 34 35 36 37 38 39 40 41 42 43 44 45 46 47 48 49 50 51 52 53 54 55 56
The comparison between t-plot analysis for (Sext)tpt and (Smes+ext)tpt, and linear
combination calculations for (Sext)calc and (Smes+ext)calc (Figures 3 and S3), reveals that the
values for the external surface areas are equivalent. Although there is no overestimation of external surface areas by t-plot analysis (Figure S3), the Smes+ext determined by t-plot (Smes+ext)tpt
overestimates the “calculated” value of Smes+ext ((Smes+ext)calc) determined by linear combination
for materials presenting a micropore surface area higher than 200 m2/g (Figures 3 and S3).
To better quantify the overestimation of (Smes+ext)tpt by the t-plot method, the ratio
(Smes+ext)calc/(Smes+ext)tpt was represented as a function of the fraction of micropore volume
(Vmic/Vtot) contained in the mechanical mixtures as determined by t-plot ((Vmic/Vtot)tpt) (Figure
3). As explained previously, the total pore volume (Vtot) was taken from the t-plot (Figure S2)
when the second fit (high t) deviates from the experimental points as previously demonstrated by modeling.15 The micropore volume is given by the intercept of the first fit of the t-plot (low t)
with the Y-axis (Figure S2). The highest ratio (Vmic/Vtot)tpt observed by t-plot is for pure FAU-Y
and corresponds to (Vmic/Vtot)tpt = 70%, not 100% due to the underestimation of micropore
volume.12 As a result, this graph (Figure 3) shows that the t-plot method gives accurate results for
Smes+ext ((Smes+ext)calc = (Smes+ext)tpt) for materials containing less than 30% of micropore volume
(0 < (Vmic/Vtot)tpt < 30 %). For larger amounts of micropore volume, Smes+ext is overestimated by
the t-plot method, and the overestimation increases linearly with increase in the micropore volume until a maximum is reached (Vmic/Vtot)tpt > 55 % (Figure 3).
The following equations (Eq. 10 – 12) have are provided to correct (Smes+ext)tpt
determined by t-plot method for microporous/mesoporous materials:
(Vmic/Vtot)tpt < 30%: (Smes+ext)calc /(Smes+ext)tpt = 1 (10)
3 4 5 6 7 8 9 10 11 12 13 14 15 16 17 18 19 20 21 22 23 24 25 26 27 28 29 30 31 32 33 34 35 36 37 38 39 40 41 42 43 44 45 46 47 48 49 50 51 52 53 54
(Vmic/Vtot)tpt > 55%: (Smes+ext)calc /(Smes+ext)tpt = 0.38 (12)
with (Vmic/Vtot)tpt expressed in %.
Surface areas of a family of hierarchical mesoporous FAU-Y. In order to improve transport
properties of zeolite crystals mesopores can be created.1-10 In 2005, an attractive procedure was
proposed consisting of the transformation of a silica-rich FAU-Y into mesoporous FAU-Y by a post-treatment in an alkaline solution containing alkyltrimethylammonium bromide surfactants (CnTAB). This created homogeneous ordered mesopores as in MCM-41 materials inside the FAU-Y crystals.8-10 In the present study, mesoporous FAU-Y materials (named FAUmes) were
synthesized using C18TAB surfactant with different NaOH/Si ratio (0.025 < NaOH/Si < 0.25). Their nitrogen isotherms at 77 K have been performed (Figure 1) and their BET surface areas and t-plots have been analyzed (Figures 2 and S4) to calculate their external, micropore and mesopores surface areas taking into account the corrections of (Smes+ext)tpt (Eq. 10 -12) provided
by the results for mechanical mixtures of FAU-Y and MCM-41.
(Smes+ext)tpt surface areas were calculated from the slope (Eq. 9) of the first linear fit of the
t-plot. The linear fit of the first slope was in general in the range 0.01 < p/p0 < 0.17
(corresponding to 0.2 < t < 0.4 nm) and contains the volumes and relative pressures at which all micropores are filled (ie. p/p0 > 0.10, corresponding to t > 0.36 nm) (Figures 2, S4). (Vmic)tpt
micropore volumes were measured at the intercept of the Y-axis with this first linear fit. (Sext)tpt
surface areas were calculated from the slope (Eq. 9) of the second linear fit. The linear fit of the second slope was in general in the range 0.65 < p/p0 < 0.82 (corresponding to 0.7 < t < 0.9 nm)
and contains the volumes and relative pressures below p/p0 < 0.80 (corresponding to t < 0.92
nm), where the domain of validity was observed for the t-plot curve for the Aerosil-200 silica
3 4 5 6 7 8 9 10 11 12 13 14 15 16 17 18 19 20 21 22 23 24 25 26 27 28 29 30 31 32 33 34 35 36 37 38 39 40 41 42 43 44 45 46 47 48 49 50 51 52 53 54 55 56
reference. The total pore volumes (Vtot)tpt were taken from the second linear fit of the t-plot
where it leaves the experimental data points (Table 1). The above equations (Eq. 10-12) have been applied to (Smes+ext)tpt to obtain corrected values named (Smes+ext)cor (Table 1).
The transformation of FAU-Y into FAUmes depends of the NaOH/Si ratio used in the synthesis. The step at p/p0 around 0.4 in the nitrogen isotherms (Figure 1) is characteristic of the
formation of ordered mesopores of ca. 4 nm in the materials due to micelle-templating. This step is observed for 0.0625 < NaOH/Si < 0.25 revealing the transformation of FAU-Y into FAUmes for this range of NaOH/Si ratio. Too low NaOH/Si ratio, such as NaOH/Si = 0.05, does not allow for the transformation into FAUmes. External surface areas for Y and untransformed FAU-Y (0 < NaOH/Si < 0.05) were around 100 m2/g and decrease to ca. 30 m2/g for FAUmes (0.0625
< NaOH/Si < 0.25). Initial FAU-Y particles are built by an aggregation of crystals of different size and morphology around 1 μm diameter forming aggregates of ca. 10 μm. The transformation of FAU-Y into FAUmes occurs also in between the crystal aggregates and on the outer surface the crystals leading to a slight increase of particles diameter of ca. 30 μm23 and, therefore, to a
decrease of external surface areas by a factor 3 to 4. Mesopore surface areas (Smes)cor have been
calculated by difference between corrected Smes+ext surface areas (Smes+ext)cor and external surface
areas (Sext)tpt: (Smes)cor = (Smes+ext)cor – (Sext)tpt (Table 1).
To assess micropore surface areas of FAUmes materials by subtracting (Smes+ext)cor from
the total surface area, the total surface areas of the materials have been calculated by BET equation (SBET) using the Rouquerol criterion11 (Figures 4, S5) to determine the highest p/p0
pressure to use in the fit of the BET equation.
3 4 5 6 7 8 9 10 11 12 13 14 15 16 17 18 19 20 21 22 23 24 25 26 27 28 29 30 31 32 33 34 35 36 37 38 39 40 41 42 43 44 45 46 47 48 49 50 51 52 53 54
0.10
0.075
0.05
0
0.2
0.4
0.6
0.8
1
Figure 4. Examples of Rouquerol plots of hierarchical microporous/mesoporous FAUmes
synthesized from H-FAU-Y with C18TAB surfactant and different NaOH/Si ratio (NaOH/Si = 0.05, 0.075, 0.10, indicated on each curves) to determine the highest p/p0 pressure (corresponding
to the crossing between red and blue lines) to use in the fit of the BET equation to calculate SBET.
The total surface areas (SBET) is constant (937 m2/g) for FAU-Y and for untransformed
FAU-Y (0 < NaOH/Si < 0.05), whereas SBET increases from 894 to 956 m2/g with increase of
NaOH/Si ratio for 0.075 < NaOH/Si < 0.125 and then remains constant (949 m2/g) for higher
values of NaOH/Si (0.125 < NaOH/Si < 0.25) (Table 1). The SBET surface areas calculated from
nitrogen adsorption isotherms are sensitive to the surface chemistry of the materials, as the
cross-3 4 5 6 7 8 9 10 11 12 13 14 15 16 17 18 19 20 21 22 23 24 25 26 27 28 29 30 31 32 33 34 35 36 37 38 39 40 41 42 43 44 45 46 47 48 49 50 51 52 53 54 55 56
section of N2 molecules can vary from 0.135 nm2 for a hydrophilic surface to 0.162 nm2 for a
hydrophobic surface depending on the orientation of the molecule with the surface.19 The latter
cross-section (0.162 nm2) is typically used in S
BET calculation (Eq. 3,4).
In order to evaluate surface hydrophilicity, SBET surface areas were also assessed from Ar
isotherms at 87 K. The SBET calculated from the Ar isotherms were constant (780 m2/g) except
for untransformed FAU-Y materials (0 < NaOH/Si < 0.05), which show the highest surface areas (820 m2/g). To analyze the micropore + mesopore surface areas of the materials, the external
surface areas (Sext)tpt were subtracted from the total surface areas (SBET) (Figure S6). The
resulting micropore + mesopore surface areas for FAUmes materials determined from Ar isotherms were constant (740 m2/g) for all NaOH/Si ratio (0 < NaOH/Si < 0.25), whereas the
micropore + mesopore surface areas determined from nitrogen isotherms increase from 855 to 930 m2/g with increase in NaOH/Si ratio in the range 0 < NaOH/Si < 0.125 and then remain
constant (920 m2/g) for higher NaOH/Si ratio (0.125 < NaOH/Si < 0.25) (Figure S6).
The Ar isotherm results show that the progressive increase of micropore + mesopore surface area observed from N2 isotherms for the 0.05 < NaOH/Si < 0.125 samples is due to a
change of the orientation of the nitrogen molecules on the surface. The progressive increase in the hydrophilic character of the surface during the transformation into FAUmes arises from an increase in the density of silanol groups on the surface of the materials.1 FAU-Y and
untransformed FAU-Y (0 < NaOH/Si < 0.05) feature a hydrophobic surface as silanol groups are isolated and nitrogen molecules are lying on the surface giving a cross-section of 0.162 nm2. By
increasing the NaOH/Si ratio, silanol groups are formed1 and the interactions between silanol
groups increase, increasing the hydrophilic character of the surface of FAUmes materials. N2
molecules are progressively oriented more perpendicularly to the surface and N2 molecules
cross-3 4 5 6 7 8 9 10 11 12 13 14 15 16 17 18 19 20 21 22 23 24 25 26 27 28 29 30 31 32 33 34 35 36 37 38 39 40 41 42 43 44 45 46 47 48 49 50 51 52 53 54
character of the materials (FAUmes synthesized with 0.125 < NaOH/Si < 0.25) corresponding to 920 m2/g instead of 855 m2/g can be estimated by assuming a constant BET surface area for all
materials (as demonstrated by Ar adsorption). The N2 molecule cross-section would become
0.1404 nm2 instead of 0.162 nm2.
Corrections of SBET determined by nitrogen have been done with this new nitrogen
cross-section for FAUmes synthesized with 0.075 < NaOH/Si < 0.25 and called SBET* (Table 1). The
micropore, mesopore and micropore + mesopore surface areas have been calculated for all materials using either SBET or SBET* taking also into account corrections of Smes+ext determined by
t-plot method (Smes+ext)cor. SBET was used for materials synthesized with 0 < NaOH/Si < 0.0625
and SBET* for 0.075 < NaOH/Si < 0.25. The micropore surface areas have been calculated from
the difference of total surface areas (SBET or SBET*) with (Smes+ext)cor and named (Smic)cor or
(Smic*)cor, respectively (Table 1). The mesopore surface areas were calculated by subtracting
(Sext)tpt from (Smes+ext)cor and named (Smes)cor (Table 1). The micropore + mesopore surface
areas have been calculated by difference of SBET or SBET* with external surface areas (Sext)tpt
(Figure 5). 3 4 5 6 7 8 9 10 11 12 13 14 15 16 17 18 19 20 21 22 23 24 25 26 27 28 29 30 31 32 33 34 35 36 37 38 39 40 41 42 43 44 45 46 47 48 49 50 51 52 53 54 55 56
0
0.05 0.1
0.15 0.2
0.25
S
BET- S
extS
mesS
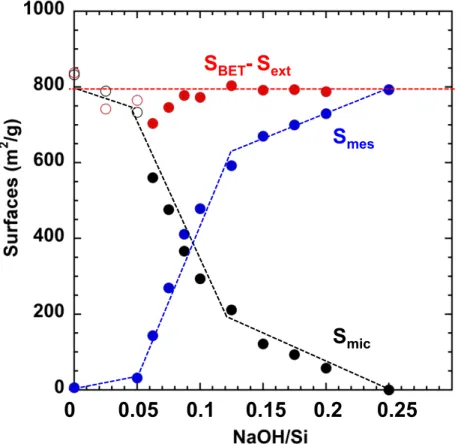
micFigure 5. Micropore (Smic)cor and mesopore (Smes)cor surface areas of hierarchical
microporous/mesoporous FAU-Y (FAUmes) synthesized from H-FAU-Y with C18TAB surfactant and different NaOH/Si ratio determined by t-plot analysis and corrections (Eq. 10-12). The micropore + mesopore surface areas of FAUmes (SBET-Sext) has been determined by
subtracted the external surface (Sext)tpt from SBET or SBET*. SBET or SBET*was calculated with
nitrogen cross-section of 0.162 or 0.1404 nm2 for FAUmes synthesized with NaOH/Si = 0 –
0.0625 and 0.075 - 0.25, respectively.
Surface area calculations for FAUmes materials show that the micropore surface areas
3 4 5 6 7 8 9 10 11 12 13 14 15 16 17 18 19 20 21 22 23 24 25 26 27 28 29 30 31 32 33 34 35 36 37 38 39 40 41 42 43 44 45 46 47 48 49 50 51 52 53 54
NaOH/Si ratio in the synthesis, while the micropore +mesopore surface areas remain constant
(Figure 5). The transformation of FAU-Y into mesoporous FAU-Y occurs with the same surface
area (micropore + mesopore surface areas) as FAU-Y (937 m2/g). The microporous surface is
replaced by a mesoporous structure of similar surface area (954 m2/g for FAUmes synthesized
with NaOH/Si = 0.25 with almost no microporosity). The transformation of FAU-Y into FAUmes is accompanied by an increase of the surface hydrophilicity. A FAUmes material featuring an equivalent micropore and mesopore surface area should be obtained with NaOH/Si = 0.095 in the synthesis (Figure 5) and would feature an intermediate hydrophobicity/hydrophilicity in between FAU-Y and amorphous ordered mesoporous material as the one synthesized with NaOH/Si = 0.25 (Figure S6).
CONCLUSIONS
A methodology to decouple total, external, mesopore and micropore surface areas for micro-/mesoporous materials using the t-plot method and BET equation has been provided. SBET can be
used to evaluate the total surface areas (microporous + mesoporous + external surface) of micro-/mesoporous materials if the Rouquerol criterion is well respected. By using mechanical mixtures of FAU-Y and MCM-41 materials of experimentally determined micropore and mesopore surface areas, respectively, it was shown that mesoporous + external surface areas (Smes+ext) determined
by the t-plot are overestimated for materials containing more than 30% of micropore volume. Corrections for the overestimation of Smes+ext have been provided. This methodology has been
applied to decouple the micropore and the mesopore surface areas of a family of hierarchical micro-/mesoporous FAU-Y (FAUmes) synthesized from FAU-Y in presence of
3 4 5 6 7 8 9 10 11 12 13 14 15 16 17 18 19 20 21 22 23 24 25 26 27 28 29 30 31 32 33 34 35 36 37 38 39 40 41 42 43 44 45 46 47 48 49 50 51 52 53 54 55 56
octadecyltrimethyl ammonium bromide and different NaOH/Si ratios (0 < NaOH/Si < 0.25). These characterizations of FAUmes show that the micropore surface area decreases and the mesopore surface area increases with the increase of NaOH/Si ratio, while the micropore + mesopore surface area remains constant. An equivalent micropore surface area and mesopore surface area is expected for a FAUmes material synthesized with NaOH/Si = 0.095. Comparisons of BET surface areas of FAUmes materials determined by N2 isotherms at 77 K and Ar isotherms
at 87 K show that FAU-Y features a hydrophobic character and that by transforming FAU-Y into FAUmes the hydrophilicity of the surface increases with the increase of NaOH/Si, especially in between 0.065 < NaOH/Si < 0.11, and then the surface remains hydrophilic for 0.125 < NaOH/Si < 0.25. The combination of t-plot method and BET equation is a powerful tool to evaluate independently the micropore and mesopore surface areas of micro-/mesoporous materials. Equations given in this study to correct the overestimation of mesopore surface areas determined by t-plot method for hierarchical microporous/mesoporous materials apply to nitrogen isotherms at 77 K. However, these are not suitable for Ar adsorption at 87 K. Similar work will be performed to assess the micropore and mesopore surface areas from Ar isotherms in a future work.
ACKNOWLEDGMENTS
The authors thank TOTAL S. A. for financial support, F. Fajula for fruitful discussions, J-M. Goupil for discussions on t-plot standard isotherms comparison, M. Thommes for Ar adsorption isotherms at 87 K measurements and J. Rodriguez for low pressure nitrogen isotherms at 77 K. We thank Professor Thomas J. Pinnavaia for help in editing the text to improve English grammar.
3 4 5 6 7 8 9 10 11 12 13 14 15 16 17 18 19 20 21 22 23 24 25 26 27 28 29 30 31 32 33 34 35 36 37 38 39 40 41 42 43 44 45 46 47 48 49 50 51 52 53 54
two important researchers in fundamental adsorption and the characterization of porous solids, who passed away recently (2016 and 2017, respectively).
Supporting informations: Additional t-plots of mechanical mixture of FAU-Y and MCM-41
and of mesoporous FAU-y (FAUmes). Additional Rouquerol plots. Comparison of mesopore + external surface areas of the mechanical mixtures of FAU-Y and MCM-41 as a function of micropore surface area. Equations for the relationship between thickness t and p/p0 for the
analysis of the low pressure part (p/p0 < 0.01) of the isotherms.
3 4 5 6 7 8 9 10 11 12 13 14 15 16 17 18 19 20 21 22 23 24 25 26 27 28 29 30 31 32 33 34 35 36 37 38 39 40 41 42 43 44 45 46 47 48 49 50 51 52 53 54 55 56
Table 1. Textural features of hierarchical mesoporous FAU-Y (FAUmes) synthesized with
C18TAB surfactant and different NaOH/Si ratios produced from nitrogen sorption isotherms at 77 K. Total, mesopore and micropore volumes and surface areas have been calculated using BET equation and t-plot analysis (tpt) and corrected values of t-plot (cor). For t-plot analysis Aerosil 200 was used as reference isotherm.
NaOH/Si SBET m2/g SBET* m2/g Vtot tpt mL/g Vmic tpt mL/g Smes+ext tpt m2/g Vmic cor mL/g Vmes cor mL/g Smes+ext cor m2/g Smes cor m2/g Smic cor m2/g Smic* cor m2/g Sext tpt m2/g 0 937 0.431 0.265 276 0.371 0.060 105 6 832 99 0.025 868 0.383 0.258 208 0.361 0.022 79 -47 789 126 0.05 861 0.437 0.233 278 0.326 0.111 128 32 733 96 0.0625 885 0.479 0.222 339 0.311 0.168 206 143 679 63 0.075 894 775 0.534 0.209 391 0.280 0.254 298 269 596 476 29 0.0875 923 780 0.592 0.190 474 0.242 0.350 433 411 490 366 22 0.10 926 802 0.634 0.180 509 0.222 0.411 509 479 417 293 30 0.125 957 829 0.714 0.149 618 0.170 0.544 618 592 339 211 26 0.15 949 822 0.766 0.116 701 0.122 0.644 701 670 248 121 31 0.175 960 832 0.782 0.102 739 0.103 0.678 739 700 221 93 39 0.20 956 828 0.790 0.085 771 0.085 0.705 771 730 185 58 41 0.25 954 827 0.811 0.057 827 0.057 0.754 827 793 127 0 34
*with SBET calculated with nitrogen surface 0.1404 nm2 for 0.075 < NaOH < 0.25
3 4 5 6 7 8 9 10 11 12 13 14 15 16 17 18 19 20 21 22 23 24 25 26 27 28 29 30 31 32 33 34 35 36 37 38 39 40 41 42 43 44 45 46 47 48 49 50 51 52 53 54
REFERENCES
(1) Kazakov, M. O.; Nadeina, K. A.; Danilova, I. G.; Dik, P. P.; Klimov, O. V.; Pereyna, V. Yu.; Gerasimov, E. Yu.; Dobryakova, I. V.; Knyazeva, E. E.; Ivanova, I. I.; Noskov, A. S. Hydrocracking of Vacuum Gas Oil over NiMo/γ-Al2O3: Effect of Mesoporosity Introduced by
Zeolite Y Recrystallization, Catal. Today, 2017, in press
https://doi.org/10.1016/j.cattod.2017.08.048
(2) Bellussi, G. ; Millini, R. ; Pollesel, P.; Perego, C. Zeolite science and technology at Eni, New
J. Chem., 2016, 40 (5), 4061-4077.
(3) Serrano, D. P.; Escola, J. M.; Sanz, R.; Garcia, R. A.; Peral, A.; Moreno, I.; Linares, M. Hierarchical ZSM-5 zeolite with uniform mesopores and improved catalytic properties, New J.
Chem., 2016, 40 (5), 4206-4216.
(4) Ivanova, I. I.; Knyazeva, E. E. Micro–mesoporous materials obtained by zeolite recrystallization: synthesis, characterization and catalytic applications, Chem. Soc. Rev., 2013, 42
(9), 3671-3688.
(5) Perez-Ramirez, J.; Mitchell, S.; Verboekend, D.; Milina, M.; Michels, N-L.; Krumeich, F.; Marti, N.; Erdmann, M. Expanding the Horizons of Hierarchical Zeolites: Beyond Laboratory Curiosity towards Industrial Realization, ChemCatChem, 2011, 3, 1731-1734.
3 4 5 6 7 8 9 10 11 12 13 14 15 16 17 18 19 20 21 22 23 24 25 26 27 28 29 30 31 32 33 34 35 36 37 38 39 40 41 42 43 44 45 46 47 48 49 50 51 52 53 54 55 56
(6) Mitchell, S.; Michels, N-L.; Kunze, K.; Perez-Ramirez, J. Visualization of hierarchically structured zeolite bodies from macro to nano length scales, Nat. Chem., 2012, 4 (10), 825 – 831.
(7) De Jong, K. P.; Zecevic, J.; Friedrich, H.; de Jongh, P. E.; Bulut, M.; van Donk, S.; Kenmogne, R.; Finiels, A.; Hulea, V.; Fajula, F. Zeolite Y with trimodal porosity as ideal hydrocracking catalysts, Angew. Chem., 2010, 49-52, 10074-10078.
(8) Ying, J.; Garcia-Martinez, J. Mesostructured zeolitic materials, and methods of making and using the same US patent 2005, US20050239634.
(9) Li, K.; Valla, J.; Garcia-Martinez, J. Realizing the Commercial Potential of Hierarchical Zeolites: New Opportunities in Catalytic Cracking, ChemCatChem., 2014, 6, 46-66.
(10) Linares, N.; Sachse, A.; Serrano, E.; Grau-Atienza, A.; De Oliveira Jardim, E.; Silvestre-Albero, J.; Cordeiro, M. A. L.; Fauth, F.; Beobide, G.; Castillo, O.; García-Martínez, J. In Situ Time-Resolved Observation of the Development of Intracrystalline Mesoporosity in USY Zeolite, Chem. Mater., 2016, 28 (24), 8971-8979.
(11) Rouquerol, J.; Llewellyn, P.; Rouquerol, F. Is the BET equation applicable to microporous adsorbents? Stud. Surf. Sci. Catal., 2007, 160, 49-56.
3 4 5 6 7 8 9 10 11 12 13 14 15 16 17 18 19 20 21 22 23 24 25 26 27 28 29 30 31 32 33 34 35 36 37 38 39 40 41 42 43 44 45 46 47 48 49 50 51 52 53 54
(12) Galarneau, A.; Villemot, F.; Rodriguez, J.; Fajula, F.; Coasne, B. Validity of the t-plot Method to Assess Microporosity in Hierarchical Micro/Mesoporous Materials, Langmuir, 2014,
30 (44), 13266-13274.
(13) Villemot, F.; Galarneau, A.; Coasne, B. Adsorption-based characterization of hierarchical metal–organic frameworks, Adsorption, 2014, 20 (2-3), 349-357.
(14) Thommes, M.; Kaneko, K.; Neimark, A. V.; Olivier J. P.; Rodriguez-Reinoso, F.; Rouquerol, J.; Sing, K. S. W. Physisorption of gases, with special reference to the evaluation of surface area and pore size distribution (IUPAC technical report), Pure Appl. Chem., 2015, 87
(9-10), 1051-1069.
(15) Coasne, B.; Galarneau, A.; Pellenq, R. J. M.; Di Renzo F., Adsorption, intrusion and freezing in porous silica: the view from the nanoscale, Chem. Soc. Rev., 2013, 42(9), 3821 – 3832.
(16) Gregg, S. J.; Sing, K. S. W. Adsorption, Surface area and porosity, Academic Press, London, 1982.
(17) Jaroniek, M.; Kruk, M.; Olivier, J. P. Standard Nitrogen Adsorption Data for Characterization of Nanoporous Silicas, Langmuir, 1999, 15 (16), 5410-5413.
(18) Villemot, F.; Galarneau, A.; Coasne, B. Adsorption and Dynamics in Hierarchical
Metal-3 4 5 6 7 8 9 10 11 12 13 14 15 16 17 18 19 20 21 22 23 24 25 26 27 28 29 30 31 32 33 34 35 36 37 38 39 40 41 42 43 44 45 46 47 48 49 50 51 52 53 54 55 56
Organic Frameworks, J. Phys. Chem. C, 2014, 118, 7423-7433.
(19) Galarneau, A.; Desplantier, D.; Dutartre, R.; Di Renzo, F. Micelle-templated silicates as a test bed for methods of mesopore size evaluation, Microporous Mesoporous Mater., 1999, 27
(2-3), 297-308.
(20) Galarneau, A.; Iapichella, J.; Bonhomme, K.; Di Renzo, F.; Kooyman, P.; Terasaki, O.; Fajula, F. Controlling the morphology of mesostructured silicas by pseudomorphic transformation : a route towards application, Adv. Funct. Mater., 2006, 16, 1657-1667.
(21) Foster, M. D.; Rivin, I.; Treacy M. M. J.; Delgado Friedrichs, O. A geometric solution to the Largest-Free-Sphere problem in zeolite frameworks, Microporous Mesoporous Materials, 2006,
90, 32-38.
(22) Sing, K. S. W.; Williams, R. T. The Use of Molecular Probes for the Characterization of Nanoporous Adsorbents, Part. Part. Syst. Charact., 2004, 21, 71-79.
(23) Galarneau, A.; Guenneau, F.; Gedeon, A.; Mereib, D.; Rodriguez, J.; Fajula, F.; Coasne, B. Probing Interconnectivity in Hierarchical Microporous/Mesoporous Materials Using Adsorption and Nuclear Magnetic Resonance Diffusion, J. Phys. Chem. C, 2016, 120, 1562-1569.
3 4 5 6 7 8 9 10 11 12 13 14 15 16 17 18 19 20 21 22 23 24 25 26 27 28 29 30 31 32 33 34 35 36 37 38 39 40 41 42 43 44 45 46 47 48 49 50 51 52 53 54
3 4 5 6 7 8 9 10 11 12 13 14 15 16 17 18 19 20 21 22 23 24 25 26 27 28 29 30 31 32 33 34 35 36 37 38 39 40 41 42 43 44 45 46 47 48 49 50 51 52 53 54 55 56
Graphical Abstract Overestimation of Mesopore Surface by t-plots of micro/ mesoporous materials *Corrections provided
Smes = Smes+ext* – Sext Smic = SBET – Smes+ext*
Vtot Vmic Smes+ext Sext 0 0.2 0.4 0.6 0.8 1.0 1.2 Smes+ext* 3 4 5 6 7 8 9 10 11 12 13 14 15 16 17 18 19 20 21 22 23 24 25 26 27 28 29 30 31 32 33 34 35 36 37 38 39 40 41 42 43 44 45 46 47 48 49 50 51 52 53 54