HAL Id: hal-02913419
https://hal.archives-ouvertes.fr/hal-02913419
Submitted on 6 Feb 2021
HAL is a multi-disciplinary open access
archive for the deposit and dissemination of
sci-entific research documents, whether they are
pub-lished or not. The documents may come from
teaching and research institutions in France or
abroad, or from public or private research centers.
L’archive ouverte pluridisciplinaire HAL, est
destinée au dépôt et à la diffusion de documents
scientifiques de niveau recherche, publiés ou non,
émanant des établissements d’enseignement et de
recherche français ou étrangers, des laboratoires
publics ou privés.
Hydrographic changes of the Southern Ocean (southeast
Indian Sector) Over the last 230 kyr
Laurent Labeyrie, Monique Labracherie, Nabila Gorfti, Jean Jacques Pichon,
Maryline Vautravers, Maurice Arnold, Jean-Claude Duplessy, Martine
Paterne, Elizabeth Michel, Josette Duprat, et al.
To cite this version:
Laurent Labeyrie, Monique Labracherie, Nabila Gorfti, Jean Jacques Pichon, Maryline Vautravers,
et al.. Hydrographic changes of the Southern Ocean (southeast Indian Sector) Over the last 230
kyr. Paleoceanography, American Geophysical Union, 1996, 11 (1), pp.57-76. �10.1029/95PA02255�.
�hal-02913419�
PALEOCEANOGRAPHY, VOL. 11, NO. 1, PAGES 57-76, FEBRUARY 1996
Hydrographic changes of the Southern Ocean (southeast
Indian sector) over the last 230 kyr
Laurent
Labeyrie,
•'2
Monique
Labracherie,
3 Nabila
Gorfti,
• Jean
Jacques
Pichon,
3
Maryline
Vautravers,
3 Maurice
Arnold,
• Jean-Claude
Duplessy,
• Marfine
Paterne,
•
Elizabeth
Michel,
• Josette
Duprat,
3 Michelle
Caralp,
3 and Jean-Louis
Turon
3
Abstract. Hydrographical changes of the southern Indian Ocean over the last 230 kyr, is reconstructed using a 17-m-long sediment core (MD 88 770; 46ø01'S 96ø28'E, 3290m). The oxygen and carbon isotopic composition of planktonic (N. pachyderma sinistra and G. bulloides) and benthic (Cibicidoides
wuellerstorfi, Epistominella exigua, and Melonis barleeanum) foraminifera have been analysed. Changes
in sea surface temperatures (SST) are calculated using diatom and foraminiferal transfer functions. A new core top calibration for the Southern Ocean allows an extension of the method developed in the North Atlantic to estimate paleosalinities (Duplessy et al., 1991). The age scale is built using accelerator mass
spectrometry
(AMS) 14C
dating
of N. pachyderma
s. for the last 35 kyr, and an astronomical
age scale
beyond. Changes in surface temperature and salinity clearly lead (by 3 to 7 kyr) deep water variations. Thus changes in deep water circulation are not the cause of the early response of the surface Southern Ocean to climatic changes. We suggest that the early warming and cooling of the Southern Ocean result from at least two processes acting in different orbital bands and latitudes: (1) seasonality modulated by obliquity affects the high-latitude ocean surface albedo (sea ice coverage) and heat transfer to and from the atmosphere; (2) low-latitude insolation modulated by precession influences directly the atmosphere dynamic and related precipitation/evaporation changes, which may significantly change heat transfer to the high southern latitudes, through their control on latitudinal distribution of the major frontal zones and on the conditions of intermediate and deep water formation.1. Introduction
The Southern Ocean is a major component of the global climate system, in particular for its role in deep-water circula- tion and the oceanic carbon cycle [Toggweiler and Sarmiento, 1985]. Yet Southern Ocean hydrographic changes during glacial-interglacial cycles are still poorly known. It has been observed for some time that in Southern Ocean sediment cores, the changes in summer sea surface temperature (SSST) (recorded by the microfossils) lead the changes in northern hemisphere
ice sheets volume (recorded in the foraminiferal •80/160 ratio)
by as much as 5 kyr during the major glacial terminations [Hays et al., 1976; Climate: Long-Range Investigations, Mapping, and Prediction (CLIMAP), 1984; Howard and Prell, 1984, 1992; Labeyrie et al., 1986; Labracherie et al., 1989; Pichon et al.,
1992]. The mechanism linking this early response to the northern hemisphere climatic evolution is still not understood. It has been associated to the sensitivity of Southern Ocean surface water to changes in the input of North Atlantic Deep
•Centre des Faibles Radioactivit6s, Laboratoire mixte CNRS-
CEA, Gif/Yvette, France.
2Also
at D6partement
des Sciences
de la Terre, Universit6
Paris-sud Orsay, Orsay, France.
3D6partement
de G6ologie
et Oc6anographie,
URA 197 du
CNRS, Universit6 Bordeaux 1, Talence, France.Copyright 1996 by the American Geophysical Union.
Paper number 95PA02255. 0883-8305/96/95PA-02255510.00
Water (NADW), itself modulated by Nordic Seas surface [Crowley, 1992; Imbrie et al., 1992]. Because changes in Southern Ocean surface hydrography apparently precede variations in all proxies which are known to influence NADW, Imbrie et al. [1992] proposed that some yet undiscovered process, occurring in the high northern latitudes, reacted faster
to northern insolation and influenced the southern waters.
Progress in this field is hampered by the lack of sediment cores representative of the Southern Ocean hydrography which can be analysed for both planktonic and benthic foraminifera. We present in this paper new data from core MD 88-770 (46ø01'S 96ø28'E, 3290 m). The core is located in the same general area as core RC 11-120 (43ø31'S 79ø52'E), a reference core for Southern Ocean paleoclimatology (Figure 1). The dis- cussion is mostly based upon the oxygen isotopic analysis of planktonic and benthic foraminifera and sea surface summer temperature (SSST)estimated using foraminiferal and diatom transfer functions. Sea surface salinity is derived from the
planktonic
foraminiferal
fi180
and SSST
following
Duplessy
et
al. [1991], with a calibration valid for the Southern Ocean. Thebenthic foraminiferal
fi13C
further
constrains
the changes
in
deep water characteristics.Two main results are derived:
1. Changes in SSST lead the response of Southern Ocean deep water, which indicates that changes in deep thermohaline circulation are not at the origin of the lead of the southern surface hydrography.
2. Sea surface salinities generally increased at the beginning of the surface water warming. This indicates a sudden invasion of subtropical waters from the north. Conversely, cooling
58 LABEYRIE ET AL.: SOUTHERN OCEAN PALEOHYDROGRAPHY
...
...
i
... -: ...
... ,
...
ß ':'!:-.'.'! ... ! ... ,: ... '•'4.-W-- 5 ... ! ... ' ... i ... '; ... ! ... i--....
....
'
'._
I}i• ;S. ubtro•cal Front i : •.: -,,,0•;. ... .
..•:.•
...
i•
...
i
...
i
...
t
...
i
...
• ...
i
.... !
...
i..MD88.-770..i...
•'•,•,,,o,,•
...
•o
o .•
...
i ...
i ...
i ...
i ...
•
...
•
...
•
...
i
...
,...
... i ... i ... •r ... 'r ... • ... i .... ,: ...
i i : : : ' '
70ø8
}
i
'
..i:i:i:i:i•'i:i:i:i:i:i:i:i:i:i:i:i:i:i:i:i:i:i
:::::::::::::::::::::::::::::::::::::::::::::::::::::::::::
40 øW 0 40 ø 80 ø 1 20 øE
Figure 1. Distribution
of published
Southern
Ocean
cores
with benthic
8•80 records
covering
at least the
last 140 kyr with a resolution
better than 5 kyr [from Grobe et al., 1990; Labeyrie and Duplessy, 1985;
Charles and Fairbanks, 1990; Duplessy et al., 1988]. Core RC 11-120 is added for reference [Martinson et al., 1987]. The main frontal zones are reported from Gordon et al. [1982].
phases are associated with large decreases in salinity. Climatic
changes in this area of the Southern Ocean are therefore marked with north-south shifts of the zone between warm, saline,
surface tropical waters and cold, low salinity, polar waters.
They are probably
associated
with similar
shifts
in the westerly
wind belt.
This evolution points to a major role of the low-latitude surface water temperatures and atmospheric circulation as an interhemispheric link during glacial-interglacial transitions.
2. The Isotopic Records of Planktonic
and Benthic Foraminifera
The foraminiferal
180/160
and 13C/12C
isotopic ratios
(expressed
as 8•80 and
813C
versus
Pee Dee Belemnite
(PDB))
have been measured on an automated carbonate preparation line coupled to a Finnigan MAT 251 mass spectrometer. The mean external reproducibility of powdered carbonate standards is
_+0.05%0
for oxygen and carbon.
Data are reported
using as
reference NBS19 8180 of-2.20%0 and 8•3C of +1.95%c versusPDB [Hut, 1987; Coplen, 1988]. Prior to isotopic analysis, hand-picked foraminifera are cleaned in pure methanol and
heated under vacuum at 400øC.
Both planktonic foraminifera species Globigerina bulloides and Neogloboquadrina pachyderma s. were analysed from the
same size fraction (200-250 pm). Measured •80 values are similar for both species in sections where they are both abun- dant (mean difference between G. bulloides and N. pachyderma
s. is A8•80
= 0.11_+
0.26 %0 for these
periods).
This is not true
during major climatic transitions (Table 1). Bard et al. [1987]have shown that benthic bioturbation redistributes a fraction of
the shells from depths of high relative abundance to levels above and below. A fraction of the abundant N. pachyderma s.
shells from glacial levels are therefore transported (with their
"heavy"
8•80) to the adjacent
interglacial
levels, where
this
species is less abundant. Conversely, some of the G. bulloidesshells
with their "light" 8180
values,
abundant
in interglacial
levels, are moved to the adjacent glacial levels. This results inshifting the transition between "warm" and "cold" 8•80 values toward the interglacial for N. pachyderma s. and toward glacial for G. bulloides. Since the present study concentrates on the
timing of climatic changes, this effect must be taken into
account.
Therefore
the mean
planktonic
8•80 signal is built
from both G. bulloides
and N. pachyderma
s. 8•80 data
sets
after
rejection of the values corresponding to a low relative abundance (less than 10%) for the corresponding foraminiferal
species.
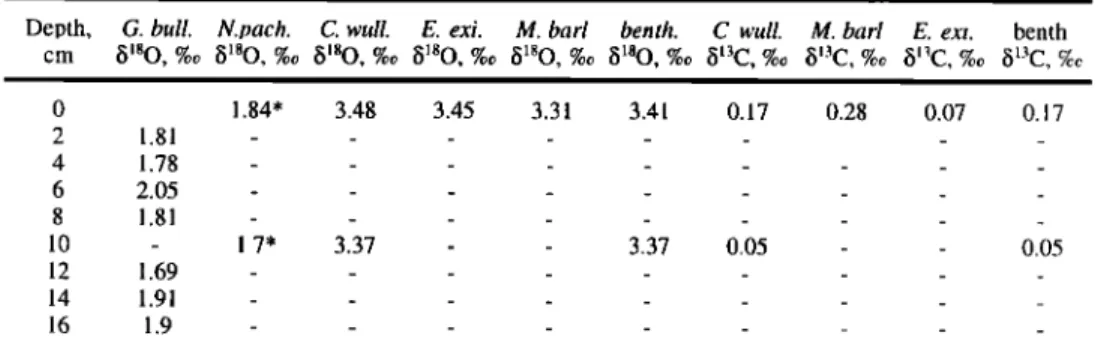
Table 1. Isotopic
Data Versus
Depth,
Corrected
for Specific
Fractionation,
for the Top 108 cm
Depth, G. bull. N. pach. C. wull. E. exi. M. barl benth. C. wull. M. barl E. exi. benth.
cm 8•80, %0 8180, %0 8180, %0 8180, %0 8180, %0 8180, %0 813C, %0 813C, e/co 813C, %0 •513C, C7cc 0 1.84' 3.48 3.45 3.31 3.41 0.17 2 1.81 ... 4 1.78 ... 6 2.05 ... 8 1.81 ... 10 - 1.7' 3.37 - - 3.37 0.05 12 1.69 ... 14 1.91 ... 16 1.9 ... 0.28 0.07 0.17 0.05 _ _ _
LABEYRIE ET AL.: SOUTHERN OCEAN PALEOHYDROGRAPHY 59
Table 1. (continued)
Del•th, G. bull. C. wull. E. exi. M. barl benth. C. wull. M. barl E. exi. benth.
cm /5180, %c •j180, %t• •j180, %t• •j180, %t• •j180, %t• •j180, %c •j13C, %c •j13C, %c •jlaC, %c •jl•C, %c , , , 18 1.96 ... 20 - 1.67' 3.49 3.44 - 3.47 -0.02 - 0.08 0.03 22 1.67 ... 24 1.77 ... 26 1.81 ... 28 1.58 ... 30 - 1.72' 3.49 - - 3.49 0.12 - - 0.12 32 1.59 ... 40 - 1.81 3.93 3.99 3.93 3.95 -0.18 0.44 -0.22 0.01 42 1.54 ... 44 1.98 ... 46 2.08 ... 48 2.35 ... 50 - 2.54 4.12 - 4.43 4.27 -0.02 -0.21 - -0.12 52 2.77 ... 54 2.43 ... 56 2.51 ... 58 2.44 ... 60 - 2.72 4.75 - 4.86 4.81 -0.35 -0.51 - -0.43 62 2.62 ... 64 2.51 ... 66 2.86 ... 68 2.39* ... 70 - 3.65 - - 5.08 5.08 - -0.78 - -0.78 72 2.76* ... 74 2.54* ... 76 2.85* ... 78 2.31' ... 80 - 3.94 - - 5.03 5.03 - 1.04 - 1.29 - - 1.17 82 2.8* ... 84 2.86* ... 86 2.52* ... 88 2.99* ... 90 - 3.7 - - 5.08 5.08 -1.08 -1.12 - -1.1 98 3.37* ... 100 - 4.06 - - 4.86 4.86 -1.22 - -1.22 102 3.06* ... 104 2.53* ... 106 3.26* ... 108 3.41' ...
The
'•"'80
of G. bulloides,
N. pachyderma
s.,
C. wuellersto•fi
(+0.64%,),
E. exigua
(+0.22%c),
M.
barleeanum (+0.4%,), and mean benthic values are given, as well as the bl3C of C. wuellersto•fi, M. barleeanum (+0.83%c), E. exigua (+0.6%,), and mean benthic values.* Values that are not considered in figures and calculations, because of low foraminiferal abundance.
The benthic
b180
record
(Figure
2) is based
on analysis
of the
individual species Cibicidoides wuellerstorfi, Melonis barlee-
anum, and Epistominella exigua; 64 levels were analysed for more than one benthic species. Results are reported with the
admitted corrections for specific fractionation: +0.64%0 for C. wuellerstorfi and +0.40%0 for M. barleeanum [Duplessy et al., 1984]. A correction of +0.22%0 is derived for E. exigua from
paired measurements of E. exigua and C. wuellerstorfi (mean
difference for the 20 levels sampled during stable paleoclimatic conditions: +0.42 +0.12%o). Grobe et al. [1990] propose that this species grows its shell near isotopic equilibrium but do not
give specific arguments.
C. wuellerstorfi are mostly absent during glacials and M.
barleeanum during interglacials. E. exigua was sufficiently
abundant to be sampled in the interval between 710 and 970 cm (end of isotopic stage 5.5 to 4). As for planktonic foraminifera,
we did not take keep measurements corresponding to a
minimum in relative abundance of a given species.
The mean
benthic
foraminifera
•13C
record
(Figure
2) is built
following the same rules, with corrections derived from paired measurements (0%0 for C. wuellerstorfi, +0.60%0 for E. exigua, and +0.83%0 for M. barleeanum).The final foraminiferal /5•80 and /5•3C data set is available from L. Labeyrie, and will be transferred to the Boulder World Data Center-A (WDC-A) after publication. A partial example (upper 108 cm) is given in Table 1.
3. Micropaleontology
3.1. Diatoms
Diatom species distribution has been studied at 5- to 10-cm intervals. Changes in sea surface temperature were reconstructed using the diatom transfer function T.F.166/34/4 [Pichon et al.,
1987, 1992]. Its construction follows Imbrie and Kipp [1971], except that the relative amounts of diatoms of each of the 34
60 LABEYRIE ET AL.: SOUTHERN OCEAN PALEOHYDROGRAPHY 10 .• 8
E 4
E 0 400 800 1200 1600depth in core MD 88-770
( cm )
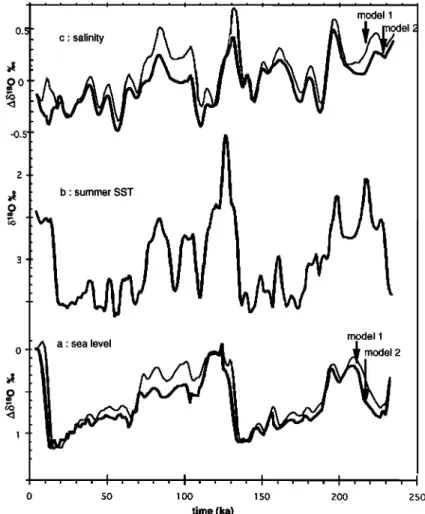
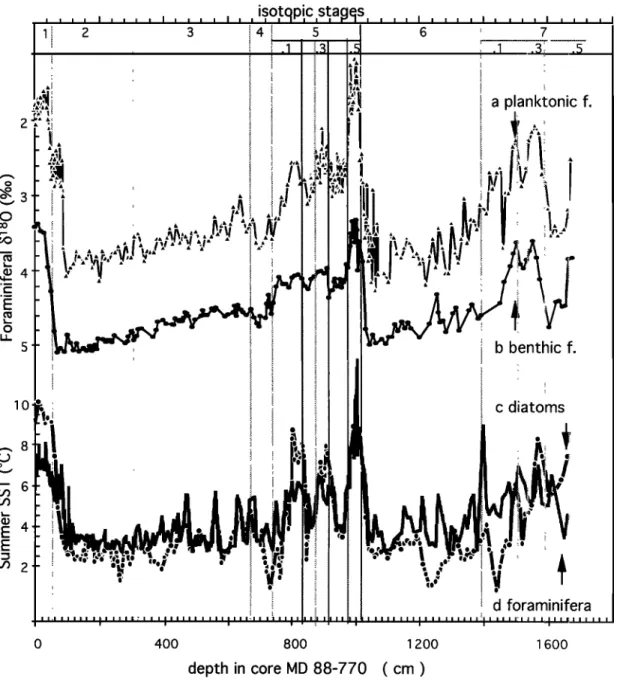
Figure 2. Variations with depth in the core of (a) planktonic foraminiferal •5•SO; (b) benthic foraminiferal
•5•80;
(c) summer
sea surface
temperature
(SSST)
calculated
using
the diatom
transfer
function'
(d) SSST
estimates using the foraminiferal transfer function. Isotopic stages are defined following Imbrie et al. [1984].
species considered are scaled to the mean relative abundance of
that species in the reference database. The scaling is done using
four classes of abundance (absent, less than 2%, between 2% and half of maximum abundance for that species, more than half of the maximum abundance). This method increases the sensitivity of the transfer function to changes in low abundance
species [Pichon et al., 1992] which have well defined tempe-
rature tolerance and are thus important for the transfer function.
Calibration is done on a set of 124 Holocene and modern core
tops. Forty-two samples with assemblages altered by stepwise
opal dissolution of five Holocene core tops were added to the
natural flora data to take into account the effect of dissolution.
The transfer function predicts correct summer surface water temperature in the range -1 to +12øC with a mean standard
deviation (1 c•)of +I.IøC, when tested for modern core tops [Pichon et al., 1987, 1992].
The first three factors of the factor analysis (varimax matrix), which represent 34%, 30.2% and 12.6 %, respectively, of the total variance, correspond to three typical biogeographic associations. They group the open ocean species (Thalassiothrix sp., Nitzschia kerguelensis, and the silicofla- gellate Distephanus speculum), the ice-related species (Thalas- siosira antarctica, Actinocyclus actinochilus, Nitzschia sublineata, Nitzschia cylindrus and Eucampia antarctica) and the
Subantarctic species (Thalassionema nitzschioides, Roperia tesselata, Hemidiscus cuneiformis, and the silicoflagellate Dictyocha sp.), respectively. The fourth factor is directly
LABEYRIE ET AL.: SOUTHERN OCEAN PALEOHYDROGRAPHY 61
core MD 88-770, the ice-related factor represents only a small part of the variance, even during cold periods. This suggests that the core was always between the subtropical and polar fronts. However, summer sea surface temperature estimates during glacials, around +2øC, do indicate that the polar front was not far south during these periods.
3.2. Planktonic Foraminifera
The foraminiferal species distribution has been established at 5- to 10-cm intervals along the core and at higher resolution for the upper 4 m (2-cm intervals). Construction of the transfer function follows also Imbrie and Kipp [1971]. It is built on the modern reference database of Prell [1985], with an extended core top reference at high southern latitudes [Labracherie et al., 1989]. SSST temperatures are interpolated from Levitus's Atlas mean February to April 0- to 10-m water temperatures [Levitus, 1982]. The foraminiferal transfer function, when tested on individual core tops against the modern reference database, gives SSST estimates between 0.7 and 23øC with a c5 = 1. IøC. However, the precision is much poorer in the SSST range -1 to +3øC than above, as the foraminiferal population is then essen- tially monospecific N. pachyderma s. Details of the micropa- laeontological study will be discussed in a paper in preparation by M. Labracherie et al. (manuscript in preparation, 1995).
The foraminiferal population varies between two characteristic assemblages in the core: the first, which corres- ponds to the warm periods, is typical of subpolar waters (with G. bulloides and G. infiata); the second, during the cold periods, is composed of the quasi-monospecific N. pachyderma s. population (which corresponds to a maximum SSST value of +3øC). Such an evolution is in agreement with the results of the diatom study. Results of both transfer functions (Figure 2) will be available from M. Labracherie and deposited at the Boulder World Data Center-A after publication. A partial example of the data is reported as Table 2.
3.3. Discussion of the Micropalaeontological
Results
Both transfer functions give similar signals. The only signi- ficant differences are for the low- and high-temperature extrema.
Let us consider first the interglacial periods. During the Holocene (the top 100 cm)and the warm interstadials of isotopic stages 5.1 and 5.3 (about 800 and 900 cm respectively), the diatom transfer function gives SSST (Figure 2 c) about 2øC higher than the foraminiferal SSST (Figure 2d), i.e., +9-10øC versus +7-8øC. The modern SSST given by Levitus [1982] at the core location is +9øC. The foraminiferal estimate appears therefore systematically too cold by about IøC and the diatom estimate too warm by that amount for the core top. At the opposite, during the peak interglacial of stage 5.5 (about 1000 cm), SSST are higher for foraminifera (10.5øC versus 8.5øC for diatoms). The peak warmth, at 1004 cm (+13øC, foraminiferal SSST), has not been sampled for diatoms but would fall out of the calibration range of the diatom transfer function. Core RC 11-120, located 2030 ' further north, in sub- tropical waters (Figure 1), yields SSST estimates of +11.2øC for Holocene and +13.5øC for the 5.5 interglacial (Spectral Mapping (SPECMAP) file, WDC-A database). These values are compatible with both sets of values for core MD 88-770, taking into account the latitudinal difference.
We do not have ready explanations for the observed dif-
ferences between diatom and foraminiferal transfer functions.
They appear systematic within each climatic period. They may derive from changes in the upper water structure and seasonality of the productivity or from a contribution of shells transported by the circumpolar currents from more southerly or northerly environments. In the latter case, the diatom transfer function
would be much more affected than the foraminifera transfer
function, as it is more sensitive to relative changes in low abundance species. During cold periods, diatoms give mean
SSST values about 1 øC colder than foraminifera. The difference
exceeds 2ø-3øC during the maximum cold events of stages 2, 4, and 6. Such a difference may be expected. As opposed to fora- minifera, diatoms are far from their minimum temperature range and will grow even during the colder years. Contrary to forami- nifera, they have a high species diversity, and the diatom
transfer function is well validated to -IøC SSST. In conclusion, records obtained from diatom and foraminiferal transfer
functions are not completely equivalent. The foraminiferal transfer function appears better adapted to record the evolution of the subtropical front in relation with the foraminiferal iso- topic record. It has no meanings for SSST below approximati- vely +3øC. The diatom transfer function presents a specific interest for the low-temperature range (polar waters) and for recording sea ice and related hydrology.
Another feature of the records is the apparent lead of forami- nifera versus diatom, particularly evident in the early part for the last deglaciation. This point will be considered in the
discussion.
4. Data Analysis and Discussion
4.1. Chronostratigraphy of MD 88-770
The different isotopic stages 1 to 7 may be easily recognised in the isotopic records. However, it is evident from Figure 2 that sedimentation rates were significantly higher during
glacial periods. Chronology for the paleoceanographic records
from core MD 88-770 was developed in the following steps.
First, accelerator
mass
spectrometry
(AMS) •4C dating
of N.
pachyderma s. was used to build a preliminary timescale for the
upper 500 cm. Dating followed the standard procedures at Centre des Faibles Radioactivit6s (CFR), Gif sur Yvette, with
sampling limited to peaks in relative abundance of the considered species. This minimises the effect of bioturbation.
Two levels present anomalous young ages (554 and 418 cm depth). We suspect contamination during cleaning. These
levels were excluded from the construction of the timescale.
AMS 14C
ages are reported
(Table 3 and Figure
3) after correc-
tion by 480 years, the adopted mean reservoir age [Bard et al.,
1990] We did not adjust the reservoir corrected ages to get calendar ages, as proposed by Bard et al. [1993]. The present
calibration
of the •4C scale
is far from being accurate
for ages
older that 11 kyr B.P. [Bard et al., 1993].Second, the benthic foraminiferal •5•80 record of the lower
1170 cm was graphically correlated with the benthic record of
equatorial Pacific core V19-30 [Shackleton and Pisias, 1985],
using the Analyseties software developed at CFR (D. Paillard et al., CFR internal report, 1993). We chose the benthic foramini- feral/5•80 record of core V19-30 as SPECMAP reference for its
close
similarity
even for small
details
with the MD 88-770 •5•80
62 LABEYRIE ET AL.: SOUTHERN OCEAN PALEOHYDROGRAPHY
Table 2. Micropaleontological Data Versus Depth in the Core for the Top 94 cm and Derived Summer Sea Surface Temperature (SSST) Following Imbrie and Kipp [1971]
Diatoms Foraminifera
Del•th, cm Ol•en Ocean Ice Zone Subantarctic Com. SSST, øC pach. s., % bull., % Com. SSST, øC
0 0.49 0.13 0.76 0.85 9.5 16 40 0.99 7.8 2 ... 16 48 1.00 7.0 4 ... 13 52 0.99 7.8 6 ... 15 50 1.00 7.3 8 ... 12 50 1.00 7.8 10 0.09 0.77 0.83 10.5 17 44 0.99 7.1 12 ... 12 48 1.00 7.9 14 ... 15 45 0.98 7.5 16 ... 16 44 0.99 7.4 ! 8 ... 21 42 0.99 7.1 20 0.44 0.12 0.78 0.85 ! 0.3 19 40 0.98 7.3 22 ... 15 43 0.98 7.6 24 ... 16 46 1.00 7.1 26 ... 17 48 0.99 7.1 28 ... 13 49 0.99 7.5 30 0.53 0.14 0.73 0.86 9.0 9 56 1.00 8.7 32 ... 13 53 0.99 7.8 34 ... 14 50 0.99 7.4 36 ... 18 42 0.99 7.4 38 ... 14 51 0.99 7.3 40 0.54 0.13 0.71 0.89 9.2 16 48 0.99 7.1 42 ... 13 45 0.98 7.5 44 ... 16 45 0.98 7.4 46 .... 19 46 0.99 6.8 48 ... 21 45 0.99 6.9 50 0.49 0.09 0.72 0.82 10.3 14 53 0.99 7.8 52 .... 18 50 0.99 7.0 54 .... 20 55 0.99 7.2 56 .... 20 52 0.97 7.5 58 ... 19 51 0.98 7.2 60 0.51 0.26 0.68 0.79 7.0 21 51 0.98 7.0 62 .... 26 50 0.99 6.6 64 .... 21 53 0.99 6.9 66 .... 21 49 0.97 7.2 68 ... 16 56 0.98 7.7 70 0.66 0.26 0.46 0.74 5.1 22 56 0.98 7.0 72 ... 23 51 0.99 6.7 74 ... 23 40 0.94 7.5 76 ... 40 34 0.97 7.2 78 ... 54 27 1.00 6.4 80 0.72 0.32 0.29 0.72 3.1 33 43 0.99 6.7 82 .... 44 30 0.99 7.2 84 .... 33 40 0.99 6.7 86 .... 40 38 0.99 6.9 88 .... 75 14 1.00 4.4 90 0.72 0.35 0.32 0.76 2.8 30 49 0.98 6.8 92 .... 82 10 1.00 3.9 94 ... 92 4 1.00 3.1
Results
of the factor analysis
of the diatom
population
were derived
following
Pichon et al. [1992]. The relative weight of
the Open Ocean, Ice Zone, and Subantarctic diatom associations, their communality (Com.) and the calculated Summer Seasurface temperatures (SSSST) are given, as well as the relative abundance of the planktonic foraminifera N. pachvderma s.
(polar factor) (pach.s),
and G. bulloides
(transitional
factor) (bull.), their communality,
and SSST, calculat4d
by the
foraminiferal transfer function.
record (Figure 3). This helped to accurately define the times of rapid change in sedimentation rate. V 19-30 has been used in the "short stack" benthic record of Pisias et al. [1984] and is defined in the temporal SPECMAP framework of Martinson et al. [1987].
Finally, the timescale derived from the two first steps was
further modified using Martinson et al.'s inverse correlation technique (still with the benthic record of V19-30) [Martinson
et al., 1982]. This step improves coherency in the cross corre- lation between the MD 88-770 isotopic record and insolation and puts the corresponding palaeoenvironmental changes within the SPECMAP temporal framework [Imbrie et al., 1992, 1993]. The poor control at both ends of the record introduces a mean shift of +0.7 kyr (+_1 kyr at 1 •)when compared to the graphically derived timescale. The effect is particularly apparent for the upper 600 cm (the last 50 kyr) and the
LABEYRIE ET AL.: SOUTHERN OCEAN PALEOHYDROGRAPHY 63
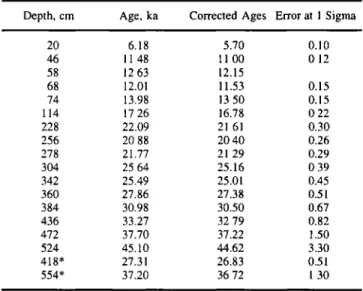
Table 3. Results
of the Accelerator
Mass Spectrometry
x4C
dating of N. pachyderma s.Depth, cm Age, ka Corrected Ages Error at 1 Sigma
20 6.18 5.70 0.10 46 11.48 11.00 0.12 58 12.63 12.15 68 12.01 11.53 0.15 74 13.98 13.50 0.15 114 17.26 16.78 0.22 228 22.09 21.61 0.30 256 20.88 20.40 0.26 278 21.77 21.29 0.29 304 25.64 25.16 0.39 342 25.49 25.01 0.45 360 27.86 27.38 0.51 384 30.98 30.50 0.67 436 33.27 32.79 0.82 472 37.70 37.22 1.50 524 45.10 44.62 3.30 418' 27.31 26.83 0.51 554* 37.20 36.72 1.30 * values rejected
transition from isotopic stages 6 to 5.5, where ages increase by 1.5 to 2 kyr. This brings the calculated ages for the 11-40 ka period close to what would have been estimated using the correction for calendar ages [Bard et al., 1993]. The global
correlation coefficient of the dated benthic records is 0.96
between MD 88-770 and V19-30 (Figure 3) and 0.91 between MD 88-770 and the SPECMAP short stack, respectively. Final depth/age results for the upper 416 cm are reported in Table 4 for example. This data will also be available from the Boulder
World Data Center-A.
4.2. Evolution Over the Last 230 kyr
The different records are reported versus age in the core in Figure 4. As discussed previously, the SSST estimated by the foraminiferal transfer function is considered to better represent the overall variability of surface waters than the SST estimated by the diatom transfer function, although it does not record temperature excursions below 3øC (Figure 4a). SSST presents a rapid variability for both glacials and interglacials approxima-
tively in phase
with the planktonic
foraminiferal
8•80 record
(Figure 4b). The latter signal records the effects of both thechanges
in SSST
and ocean
water
8x80. The largest difference
between
SSST and planktonic
8i80 signals
occurs
during
isoto-
pic stage
5.5, where
the second
light 8•80 peak
is not paralleled
by a SSST increase.
The benthic foraminiferal
8•80 signal
(Figure 4c) records the continental ice sheets waxing and waning but also the effect of deep water temperature changes [Shackleton, 1967; Labeyrie et al., 1987]. A lead of SSST andplanktonic
foraminiferal
8•80 over benthic
8•80 appears
during
each cooling phase. The benthic foraminiferal
8•3C record
(Figure 4d), although rather noisy, shows strong analogies with the benthic 8•O record. As for other Southern Ocean cores [Duplessy et al., 1988; Curry et al., 1988; Charles andFairbanks,
1992], exceptionally
light 8•3C values
are observed
during glacial periods, compared to records from the other oceanic basins. The interpretation of that signal is still amatter of debate, but there are strong indications that, as in the
modem
ocean, light 8•3C values
record
accumulation
of •3C
poor dissolved CO: (produced by oxidation of settling organic matter) in the deep southern waters following the isolation of this water mass during glacial periods [Michel et al., 1995, and references therein]. Whatever the precise origin of that signal, we may safely admit that a return, even partial, to the modern thermohaline circulation, with ventilation of the deep Southern Ocean by NADW and/or Antarctic Bottom Water (AABW), will shift the benthic foraminiferal •t3C to values closer to those of the deep Pacific and North Atlantic records [Charles and Fairbanks, 1992]. In that respect, information carried by the benthic foraminiferal 15•80 and 15•3C is different: 15x80 tracks thenorthern ice sheets and their influence on NADW; 15•C tracks
the isolation of Southern Ocean deep waters. 4.3. Study in the Spectral Domain
Spectral analysis of the climatic response to the insolation
forcing may help to clarify the relationships between Southern Ocean climatic records of core MD 88-770 and global climate. Imbrie et al. [1992, 1993] have shown that the periodic compo- nent of paleoclimatic proxies variability may be considered as a sum of three independent elements, the response to preces-
sion (=1/21 kyr-•), obliquity
(=1/43 kyr'X),
and continental
ice
volume
(which
contributes
largely
to the 1/100 kyr -• frequency
band). This third parameter is probably itself a nonlinearresponse to precession, obliquity, eccentricity, and their
harmonics. However, seen from the Southern Ocean, we may
consider the continental northern ice sheets as an external
forcing
acting
primarily
in the 1/100 kyr -• band.
Paleoclimatic
response to insolation appears linear in the precession and obliquity bands [Imbrie et al., 1992, 1993, and references
therein], but both bands carry different information. Mcintyre et al. [1989], among others, have shown that low-latitude paleoclimatic responses (sea surface temperature, equatorial upwelling) have a major part of their variability in the preces- sion band. At the opposite, proxies which record processes linked with high-latitude climatology (benthic foraminifera
15•80
and 15•C, Cd/Ca, lysocline depth) have most of their
variance
in the 1/100- and 1/41- kyr '• bands [Imbrie et al.,
1992, 1993, and references therein].
Each of the climatic bands has its own properties when considering interhemispheric relationship:
The
first
is the 1/100-
kyr
-1 "ice
forcing"
band.
Most
of the
continental glacial-interglacial ice volume changes occur in the northern hemisphere [CLIMAP, 1981]. Since purely low- latitude paleoclimatic proxies do not exhibit strong variabilityin the 1/100 kyr
'1 band
[Mch•tyre
et al., 1989], ice sheet
forcing on southern latitudes acts probably through a modula-
tion of the deep water dynamic and chemistry and its resulting effect on heat transfer and atmospheric pCO 2.
The second is the 1/43 kyr -• "obliquity" band. This
parameter modulates the distribution of solar energy between low and high latitudes synchronously over both hemispheres.The third is the 1/21 kyr 'x "precession"
band. Insolation is
modulated by the relative positions of perihelion and summer solstice. It is in opposition of phase for both hemispheres. This is the major band where interhemispheric transfer processes through atmosphere and surface oceans should play a significant role.64 LABEYRIE ET AL.: SOUTHERN OCEAN PALEOHYDROGRAPHY 1800 400 ooo 600 200 MD 88-770 I I I t t I I I I I I I I I I I I I I i
0
50
100
150
200
250
age in the SPECMAP
scale ( ka )
i i i i i
I-I AMS
14
C dates
(planktonic
foraminifera),
m rejected
0
SPECMAP
tie-points
/ final age model
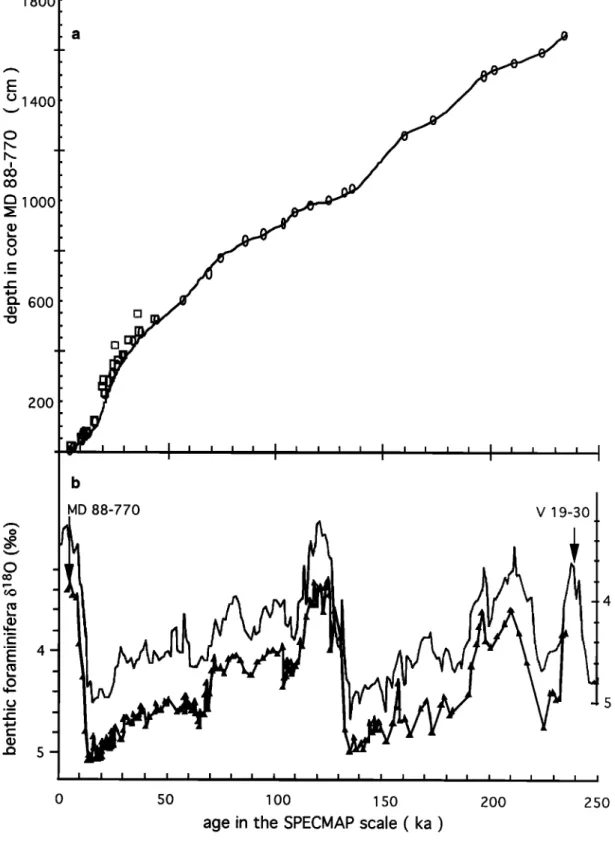
Figure 3. Construction
of the timescale:
(a)Age-depth
relationship,
with accelerator
mass
spectrometry
(AMS) 14C
dates,
tie points derived
from the graphical
correlation
of MD 88-770 and V 19-30 benthic
foraminiferal
6180
records,
and
the final inverse
correlation
using
Martinson
et al. [1982] method;
(b) The
LABEYRIE ET AL.: SOUTHERN OCEAN PALEOHYDROGRAPHY 65
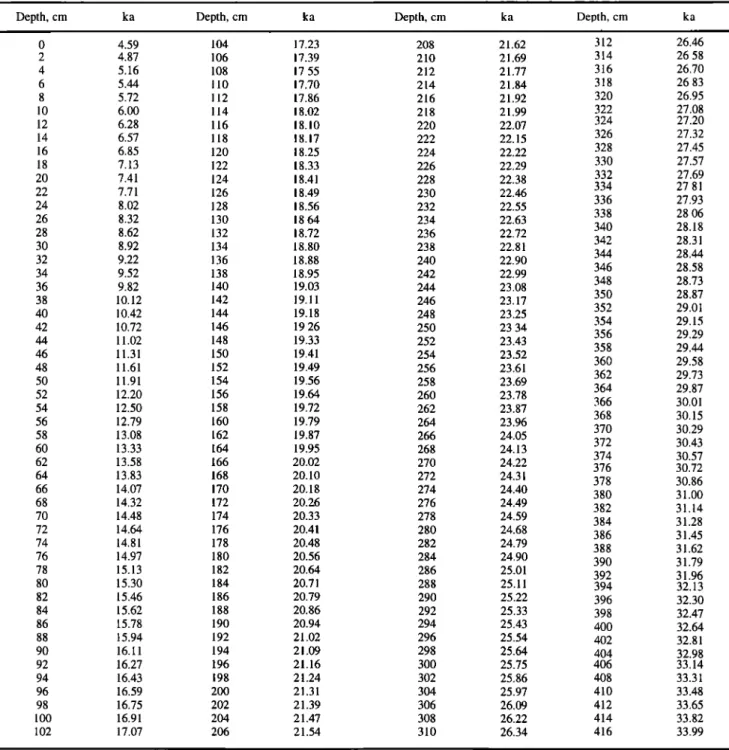
Table 4. Depth versus Age Scale fbr the upper 416 cm of Core MD 88-770
Depth, cm ka Depth, cm ka Depth, cm ka Depth, cm ka
0 4.59 104 17.23 208 21.62 312 26.46 2 4.87 106 17.39 210 21.69 314 26.58 4 5.16 108 17.55 212 21.77 316 26.70 6 5.44 110 17.70 214 21.84 318 26.83 8 5.72 112 17.86 216 21.92 320 26.95 10 6.00 114 18.02 218 21.99 322 27.08
12
6.28
116
18.10
220
22.07
324
27.20
14 6.57 118 18.17 222 22.15 326 27.32 16 6.85 120 18.25 224 22.22 328 27.45 18 7.13 122 18.33 226 22.29 330 27.57 20 7.41 124 18.41 228 22.38 332 27.69 334 27.81 22 7.71 126 18.49 230 22.46 336 27.93 24 8.02 128 18.56 232 22.55 338 28.06 26 8.32 130 18.64 234 22.63 340 28.18 28 8.62 132 18.72 236 22.72 342 28.31 30 8.92 134 18.80 238 22.81 344 28.44 32 9.22 136 18.88 240 22.90 346 28.58 34 9.52 138 18.95 242 22.99 348 28.73 36 9.82 140 19.03 244 23.08 350 28.87 38 10.12 142 19.11 246 23.17 352 29.01 40 10.42 144 19.18 248 23.25 354 29.15 42 10.72 146 19.26 250 23.34 356 29.29 44 11.02 148 19.33 252 23.43 358 29.44 46 11.31 150 19.41 254 23.52 360 29.58 48 11.61 152 19.49 256 23.61 362 29.73 50 11.91 154 19.56 258 23.69 364 29.87 52 12.20 156 19.64 260 23.78 366 30.01 54 12.50 158 19.72 262 23.87 368 30.15 56 12.79 160 19.79 264 23.96 370 30.29 58 i3.08 162 19.87 266 24.05 372 30.43 60 13.33 164 19.95 268 24.13 374 30.5762
13.58
166
20.02
270
24.22
376
30.72
64
13.83
168
20.10
272
24.31
378
30.86
66
14.07
170
20.18
274
24.40
380
31.00
68
14.32
172
20.26
276
24.49
382
31.14
70
14.48
174
20.33
278
24.59
384
31.28
72
14.64
176
20.41
280
24.68
386
31.45
74
14.81
178
20.48
282
24.79
388
31.62
76
14.97
180
20.56
284
24.90
390
31.79
78
15.13
182
20.64
286
25.01
392
31.96
80 15.30 184 20.71 288 25.11 394 32.13 82 15.46 186 20.79 290 25.22 396 32.30 84 15.62 188 20.86 292 25.33 398 32.47 86 15.78 190 20.94 294 25.43 400 32.64 88 15.94 192 21.02 296 25.54 402 32.81 90 16.11 194 21.09 298 25.64 404 32.98 92 16.27 196 21.16 300 25.75 406 33.14 94 16.43 198 21.24 302 25.86 408 33.31 96 16.59 200 21.31 304 25.97 410 33.48 98 16.75 202 21.39 306 26.09 412 33.65 100 16.91 204 21.47 308 26.22 414 33.82 102 17.07 206 21.54 310 26.34 416 33.99In order to perform spectral analysis, foraminiferal isotopic and SST temporal records (Figure 4) were interpolated at a 0.5-kyr interval between 4.5 and 235.5 ka. Spectral analysis was done by the Blackman-Tukey method [Jenkins and Watts, 1968] using the software Analyseries. The Blakman-Tukey spectral analysis algorithm is derived from the one used in Brown University within the SPECMAP program [Imbrie, 1985; Imbrie et al., 1989]. The analysis is performed with a
Barierr-type
window,
(220 lags and a 0.024 kyr -I bandwidth).
For easier intercomparison of the different parameters, variance powers are normalised by the integrated variance over thestudied
frequency
range (0 to 0.1 kyr4). They are therefore
presented as relative variance powers. The five studied. parameters, i.e., SSST (diatom and foraminifera), foraminiferal
•5•80
(benthic
and planktonic),
and •5t3C
(benthic) present
the
same general spectral responses (Figure 5), with variancemaxima
around
1/106 kyr '•, 1/43 kyr '•, 1/23 kyr
'•, and 1/19
kyr -•. Additional
high-frequency
harmonic
responses
around
1/13.5
and
1/10 kyr-1, which
represent
less
than
2% of the
integrated variance, are not reported. In the followingdiscussion,
considerations
about the 1/100-kyr
-• band should
be considered as semiquantitative. The 240-kyr record is too short for results to be fully reliable in that frequency band.66 LABEYRIE ET AL.: SOLr•ERN OCEAN PALEOHYDROGRAPHY
isotopic stages
o
0 50 1 O0 1 50 200 250
SPECIVlAP
time scale ( ka )
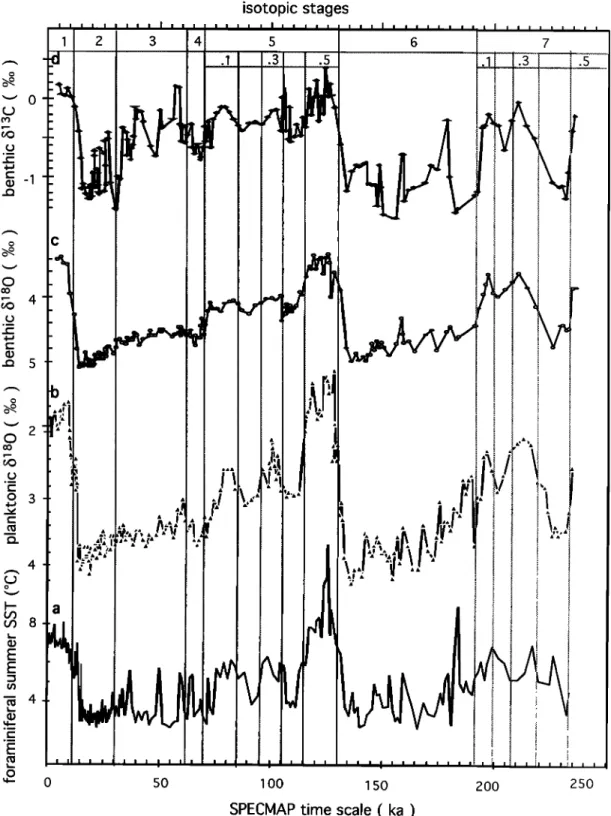
Figure 4. Baleoproxies
from
core
MD 88-770
versus
a•e (ka)' (a) summer
sea
surface
temperature
(SSST)
using
the foraminiferal
transfer
function;
(b) planktonic
foraminiferal
15•80;
(c) benthic
foraminiferal
15•SO;
(d)
benthic foraminiferal 15•'•C.
Following lmbrie et al. [1992], cross correlations (Blackman-Tukey) are calculated between the different Southern
Ocean
climatic
proxies,
the benthic
15•80,
and the northern
hemisphere insolation (June 15 at 65øN)records for the three major bands of the climatic response at 1/106, 1/43, and 1/23
kyr
-• (Figure
5 and
Table
5). Covariances
with the benthic
15180
record are highly significant (0.75<Coh<0.99) for the three bands and all the proxies (80% confidence interval for arctanh (Coh)=+0.52 [Jenkins and Watts, 1968]). Covariance between
the different
Southern
Ocean
proxies
is not significant
for the
1/106
kyr
'• band
(0.23<Coh<0.31)
and is significant,
but with
a lower coherence than between the benthic 15•SO record andLABEYRIE ET AL.: SOUTHERN OCEAN PALEOHYDROGRAPHY 67 1.2 0.8 0.4 0.4 Benthic •18 0 1- Foraminiferal T.F. 2- Diatoms T.F.
3-
Planktc•pic
õ18
0
4 Ben•hic 6?80 5 Benthic 6 • 3C Insolation1-
Foraminiferal
I
T.F.
0- 5- _ ' 5 ,2-
D•atoms
T.F.
_ 4 Benthic 8180 -5 Benthic 6 3 3C 0 0.01 0.02 0.03 0.04 O.OS 0.06 0 0.01 0.02 0 03 0 04 0 05 0 06 frequency ( 1/kyr) frequency ( 1/kyr)Figure 5. Results of the spectral analysis (Blackman-Tuckey) and cross correlation with the (left) benthie
6•80
record
and
(right)
insolation
for (t¾om
top
to bottom)
foraminiferal
SSST,
diatom
SSST,
planktonic
6•O,
benthie
•80, and
benthie
•3C. Left scales
show
distribution
of the relative
variance
power.
Right
scales
show
phases (in radians) and coherency. F.T. is transfer function.68 LABEYRIE ET AL.' SOUTHERN OCEAN PALEOHYDROGRAPHY i i i • • i i i i i i i i i i i i i i i i i i i i i i 0 0 0 0
•
.•
o •
u
u .-
LABEYRIE ET AL.: SOU22-IERN OCEAN PALEOHYDROGRAPHY 69
insolation,
in the 1/43-kyr
-• (0.56<Coh<0.79)
and 1/21-kyr
-•
(0.71<Coh<0.88) bands. This is in agreement with the results of Imbrie et al. [1992, 1993]. The large coherent response of
the various
parameters
with ice volume
at 1/106 kyr
-1 is directly
linked to the global influence of the large northern ice sheets, which have paced the climatic records at that frequency over
most of the last 900 kyr. The response of the Southern Ocean
proxies
is also larger
in the 1/43-kyr
-• that in the 1/21-kyr
'•
bands. This is related to a recent study by Waelbroeck et al.[1995], in which the Vostok deuterium fid record (a proxy of
the air temperature over Antarctica) is extended to 250 ka and
analyseo in the SPECMAP temporal framework, by direct
tuning
with insolation
in the 1/43- and 1/20-kyr
-• bands.
Their
study show that the Vostok fid record has a larger fraction of
the variability
in the 1/43-kyr
-• band
than in the 1/100- and the
1/20-kyr
-t bands,
when compared
to the marine
series. This
points to a direct effect of high-latitude southern insolation on the local changes in air and sea surface temperature.When
we consider
the leads
and
lags
between
potentiai
forcings and responses, the first important result is the systematic lead (1 to 3 kyr) of the planktonic versus the
benthic
foraminiferal
fi•80 records
in the three
frequency
bands.
Thus the choice of referring chronostratigraphy to benthic or planktonic foraminiferal records (as in SPECMAP files) has significant implications in the Southern Ocean. SSST leads thebenthic
foraminiferal
fi180
record
by about
3 kyr for the diatom
transfer
function
and 3 kyr (at 1/43 kyr -•) to 7 kyr (at 1/21
kyr -•) for the foraminiferal
transfer
function.
This SSST
lead is
reduced to about 1-2 kyr when compared to the MD 88-770planktonic
fi•80 record,
in agreement
with previously
published
results for RC11-120 and other Southern Ocean cores [Imbrie et al., 1992; 1993; Howard and Prell, 1992]. This result is not
surprising
since the planktonic
foraminiferal
fi•80 signal is
driven partly by SSST (the leading signal) and partly by global
seawater
fi•80 (the lagging
component),
recorded
by the benthic
foraminiferal
fi•80.
Our results
imply that northern
hemisphere
ice sheets may participate but are not at the origin of the
changes in Southern Ocean SSST in the obliquity and
precession bands.
SSST (foraminiferal transfer function) lags maximum obliquity by 3.5 kyr (31ø). This points to climatic processes
with a time constant of several kiloyears, as the evolution of the peripheric extent of ice sheets or deep water formation and
transport [Waelbroeck et al., 1995]. In the precession band, the
foraminiferal SSST record lags the June 15 summer insolation
by 2 kyr (17ø). This corresponds to a change in Southern Ocean summer surface temperature in phase with July insolation
(northern summer).
The diatom transfer function has a significantly different
response, considering the + 1- to 2-kyr phase uncertainty calculated by the SPECMAP method (Table 5): it is approxima- tively in phase with insolation in the obliquity band but lags
insolation by 6.5 kyr in the precession band. This is to be related with the better sensitivity of the diatom transfer function to the cold polar water and sea ice variabilities. In that respect, it is acceptable that high-latitude southern surface waters are very sensitive to the direct influence of the obliquity
modulation of seasonality. The larger lag in the precession
band points also to a higher sensitivity of the diatom distribution to the local climatic influence of high-latitude
processes with large time constant as the Antarctic ice sheet peripheral extent.
This still does not explain why the foraminiferal SSST signal, although less sensitive to the high-latitude processes,
presents a larger lag in the obliquity band than the diatom SSST
signal. If the results are taken at face value, they indicate that at least two processes influence the Southern Ocean climatology in the obliquity band: (1) locally, at high latitude, the sea ice coverage and SSST which react with no lags to changes in insolation; (2) at lower latitudes, the ice sheet peripheral extent and related atmospheric and deep water forming processes. In
reverse, in the precessioh band, the low-latitude insolation forcing would be the predominant factor for the foraminiferal SSST signal.
The phasing of the benthic foraminiferal
•5t3C
response
helps to define precisely the role of deep waters. The fi•3C leads
the benthic
fi•80 signal
by 1 to 2.5 kyr in both orbital bands
but lags SSST by 2 to 5 kyr. Our results confirm earlier work by ?isias and Shackleton [1984] in the deep equatorial Pacific and by Charles and Fairbanks [ 1992] on the last deglaciation in the deep Southern Ocean: dissolved CO2 and its transfer to the atmosphere and continental biosphere occured early in the chain of events which drove to interglacials. But we demons-
trated that surface water temperature changes occured before. The key to the early evolution of the Southern Ocean surface
waters is therefore not to be found in deep water and its carbon
cycle. The rather
large
phase
of the benthic
15t3C
response
to
insolation,
about
5 kyr for the 1/43-kyr
-t and 1/21-kyr
'• bands,
is compatible with our interpretation of the diatom andforaminiferal SST response: it is similar to the "slow" response mode of the foraminifera in the obliquity band and of the
diatoms in the precession band which we have attributed to the peripheral evolution of the Antarctic ice sheet and its influence on atmospheric circulation and deep water formation.
4.4. The Salinity Hypothesis
In the northern hemisphere, one of the main characteristics of glacial periods is the formation of a frontal zone across the North Atlantic, with warm and saline waters to the south and cold and less saline polar waters to the north [CLIMAP, 1981, 1984; Duplessy et al., 1991, 1992b]. This front is associated with a large decrease of the NADW conveyor belt [Broecker and Denton, 1989]. Both effects efficiently lower the transfer of
salt from the high-salinity intertropical Atlantic to the deep
waters. Labeyrie et al. [1992] have shown that due to the relative salinity increase in warm water and salinity decrease in high-latitude cold surface and deep waters, the density gradients between saline subtropical waters and deep waters were probably much smaller during the last glacial. Therefore zones
of open water convection (modal waters of McCartney [1977])
may have been more generalised near subtropical fronts, changing patterns of heat transfer to the atmosphere and atmospheric circulation.
The circumpolar frontal zone which limits the Southern Ocean to its north is wind driven and strongly linked to zonal sea surface temperature (SST) distribution. We may therefore
consider that similar mechanisms have been operating in the northern and southern hemispheres, with a specific role for the
![Table 2. Micropaleontological Data Versus Depth in the Core for the Top 94 cm and Derived Summer Sea Surface Temperature (SSST) Following Imbrie and Kipp [1971]](https://thumb-eu.123doks.com/thumbv2/123doknet/13180211.391162/7.886.94.796.144.869/micropaleontological-versus-derived-summer-surface-temperature-following-imbrie.webp)

![Figure 6. Calibration of the relation between isotopic temperature and modern [Levitus, 1982] summer (February) sea surface temperatures (SSST) for N](https://thumb-eu.123doks.com/thumbv2/123doknet/13180211.391162/16.889.228.645.102.569/figure-calibration-relation-isotopic-temperature-levitus-february-temperatures.webp)