HAL Id: halshs-01287431
https://halshs.archives-ouvertes.fr/halshs-01287431
Submitted on 13 Mar 2016
HAL is a multi-disciplinary open access archive for the deposit and dissemination of sci-entific research documents, whether they are pub-lished or not. The documents may come from teaching and research institutions in France or abroad, or from public or private research centers.
L’archive ouverte pluridisciplinaire HAL, est destinée au dépôt et à la diffusion de documents scientifiques de niveau recherche, publiés ou non, émanant des établissements d’enseignement et de recherche français ou étrangers, des laboratoires publics ou privés.
MATURING STRATEGIES OF RUSSIAN
MULTINATIONAL COMPANIES: COMPARISONS
WITH CHINESE MULTINATIONALS
Wladimir Andreff
To cite this version:
Wladimir Andreff. MATURING STRATEGIES OF RUSSIAN MULTINATIONAL COMPANIES: COMPARISONS WITH CHINESE MULTINATIONALS. David A. Dyker. World Scientific Reference on Globalisation in Eurasiaand the Pacific Rim, 1, World Scientific and Imperial College Press, pp.77-120, 2015, Foreign investment, 978-981-4447-79-9. �10.1142/9789813140295_0005�. �halshs-01287431�
In: David Dyker, ed., Foreign Investment, The World Scientific Reference on Globalisation in
Eurasia and the Pacific Rim, World Scientific/ Imperial College Press, London 2015.
Maturing Strategies of Russian Multinational Companies:
Comparisons with Chinese Multinationals
Wladimir Andreff
1Analysing the strategies of Russian multinational companies (MNCs) has actually become a new avenue for economic research but the topic is covered by only few publications so far. The present chapter first reminds in which circumstances Russian companies grew multinational and then started booming, and how they were muddling through the financial crisis that burst out in 2008; in this respect, they do not compare too bad with MNCs from other transition countries. The geographical and industrial specificities of their expansion abroad are pointed out as well as the major determinants of their outward foreign direst investment (OFDI). In the past decade, their strategies have evolved from total opacity to more transparency and, in some cases have matured enough to get closer to genuine global strategies while their relationships with the Russian government have strengthened. Thus Russian MNCs make up for major pillars of state capitalism in Russia. A comparative assessment with Chinese MNCs shows deeper similarities than differences in spite of the first mover advantage that has benefited to OFDI from China over OFDI from other transition economies, of which Russia.
1. The emergence of Russian multinational companies
With the transformation of the former Soviet system into a market economy the so-called “red multinationals” (Gutman, 1990; Hamilton, 1986; McMillan 1987; Sokolov, 1991) based in centrally planned economies vanished nearly overnight; altogether they were disposing of 175 subsidiaries abroad in 1990. The economic crisis that went alongside with transformational
1 Professor Emeritus at the University Paris 1 Panthéon Sorbonne, Honorary Member of the European
Association for Comparative Economic Studies, Honorary President of the International Association of Sports Economists and the European Sports Economics Association, former President of AFSE (French Economic Association, 2007-08).
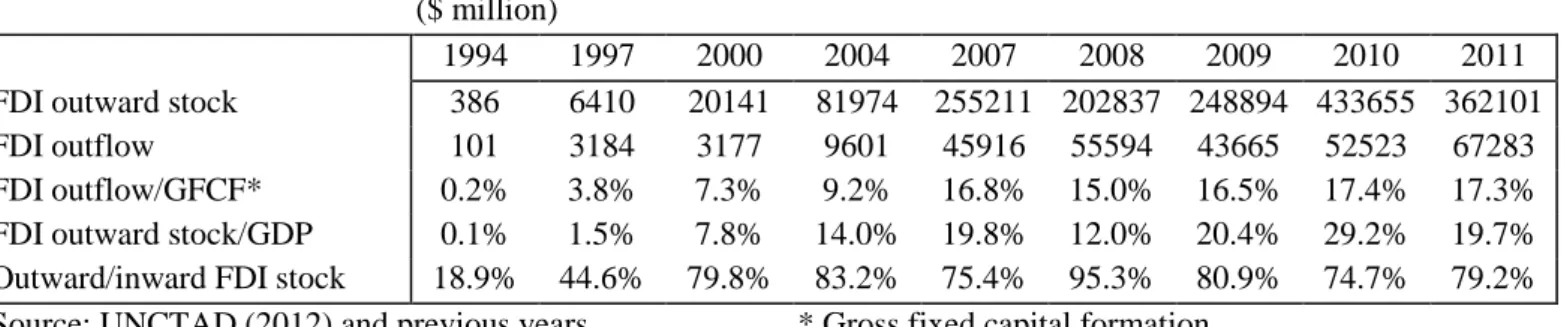
recession (Kornaï, 1994) had spread over the first years of transition and entailed the decline of former red MNCs, including those with headquarters in Russia. After 1991, these firms were confronted with new economic and financial constraints. Their liquidities dried out overnight and they were no longer able to fund their foreign subsidiaries. Many of them closed down due to under-capitalisation. Others went bankrupt or were taken over by foreign investors or new domestic oligarchs. All reduced their investment abroad and in some transition countries FDI outflows were practically phased out for some years (Svetlicic, 1997). Transformational recession did affect Russian MNCs just like it happened to hit many companies inside Russia: they lost domestic outlets and a significant part of their traditional trade with former Comecon countries; they suffered from dramatic credit crunch and hard currency shortage; their entire production and distribution networks were disorganised by the collapse of central planning. The OFDI stock from the USSR fell from $ 699 million in 1990 down to a negligible value, close to nil in 1992 and 1993. For a while the pecking order in most Russian companies was topped by privatisation and restructuring, not investing abroad. Paradoxically enough, a number of Russian firms spontaneously transformed into MNCs overnight simply because they were located in more than one former Soviet republic. Since these republics obtained the status of new independent states by end of 1991 or in 1992, a same company located in two or more former Soviet republics – it was often so under central planning - became all at once a multinational company. The break-up of the Soviet Union into 15 new nation states came out with an institutional creation of Russian MNCs, the so-called “born multinational” companies (Liuhto, 2001). Besides, many Russian firms were turned into monopolistic or oligopolistic MNCs through a rushed privatisation from which foreign investors were almost entirely excluded such as mass privatisation in 1992 and the loans for shares scheme in 1995. From the mid-nineties on, the number of subsidiaries settled abroad by Russian firms started growing again and was already counted in the thousand in 2000 (Liuhto and Jumpponen, 2001) because the aforementioned institutional multinationalisation through splitting the former USSR was relayed since 1994 by a recovery in new FDI outflows from Russia (Andreff, 2002). However, if 1994 is the milestone for a new emergence of Russian MNCs, one has to wait until 2000 and the end of the 1998 Russian financial crash economic consequences to witness a steady growth at swift pace of Russian FDI outflows and OFDI stocks (Table 1). Most of the biggest 100 Russian firms have gone multinational since 1999 or so (Andreff, 2003b).
During the lapse of time they took to emerge in the 1990s, MNCs from transition economies, of which Russian MNCs, looked very much like MNCs from developing countries and their major features differentiated them from big MNCs based in developed countries, that is: . They were not all or not primarily in private ownership; still a significant number of them were state-owned.
. They had a modest size compared to Western and Japanese MNCs.
. The government often interfered heavily in their strategies, much more than it is used to do in developed countries.
. The great bulk of their OFDI was located in neighbouring and border countries or in the same geographical region as the home country, which is a significant difference with big Western MNCs.
. The number of countries hosting their foreign subsidiaries was comparatively low. . Each of these MNCs had only settled a small number of subsidiaries abroad.
. They had primarily invested abroad in the manufacturing industry while big MNCs from developed countries were already privileging the tertiary sector for their OFDI.
. The quality of their products and their profitability was quite below those of big MNCs. However, some of these features were used as specific competitive advantages to challenge big MNCs from developed countries through market-seeking OFDI targeted at new markets. Only few Russian and Eastern European MNCs were investing abroad with an efficiency-seeking objective – looking for lower unit labour cost abroad - since their domestic production costs were comparatively low after the transition shock.
Econometric testing (Andreff, 2003c) has verified that the investment development path – IDP – model (Dunning, 1981, 1988 & 1993; Dunning and Narula, 1998) fits with the development of MNCs from transition economies in their early stage of emergence. Let us remind that in a first step of the IDP model, a country does not either invest abroad or host any inward FDI. In a second step, a country increasingly attracts inward FDI and achieves her (few) first OFDI projects; she markedly is a net FDI importer. In a third step, thanks to new technological competences and rather low unit labour cost, a country appeals a lot of inward FDI while her home-based companies start investing substantially abroad; however, she keeps on being a net FDI importer. A (now advanced developed) country in the fourth step invests more abroad than she is invested from abroad, i.e. by inward FDI; she becomes a net FDI exporter. In a final step, inward and outward FDI are nearly balanced and of the biggest magnitude in the most developed countries of the world. Applied to transition countries in the 1990s, this model was ranking most of them, up to 1999, in the second step, some were ranked in the first
step (Belarus, Georgia, Kyrgyzstan, Macedonia, Uzbekistan) and a few were close to the third step. The latter already exhibited important OFDI compared to the size of their domestic economies: Estonia, Hungary and Slovenia. Russia was in the second step at the moment, not far from the third one, and this was confirmed in a further study (Kalotay, 2004a).
The aforementioned econometric exercise showed that OFDI from transition countries was primarily explained by two variables, their level of economic development (GDP per capita) and their industrial structure - the respective share of the primary sector, different manufacturing industries, and services). The domestic technological level, to a lesser extent, had an explanatory power. In some countries like Russia (Azerbaijan, Kazakhstan) natural
resource endowment was a significant variable as well. Insert Table 1 about here
Since 2000, OFDI skyrocketed and reached a non negligible weight compared to the Russian domestic economy (19.8% for the OFDI stock/GDP ratio in 2007). A dramatic boom began in 2003 and climaxed in 20072. The current value of FDI outflows was multiplied by 17 from 2000 to 2008, and accounted for nearly 17% of domestic gross fixed capital formation in 2007 (Table 1). The OFDI stock from Russia – which measures how much past Russian MNCs investments abroad resulted in terms of asset holding – peaked up at $ 255 billion right before the global financial crisis in 2007, ranking Russia among the dozen most important foreign investors in the world. However, the crisis impacted the OFDI stock in 2008 and FDI outflows in 2009; both recovered one year after, following a trend comparable to OFDI from most emerging countries (Andreff, 2013). A last index leans us to assess that Russia went up to the third step of Dunning‟s IDP in the 2000s – and may come closer to the fourth step in the 2010s - which is the ratio between FDI outward and inward stock, in the range of 75% to 95% from 2007 to 2011 - the fourth step is characterised by a stabilised ratio over 100%3.
2. Outward FDI from Russia: comparison with other transition economies and China
Their EU accession strongly boosted Central Eastern European countries‟ (CEECs) inward and outward FDI (Kalotay, 2006). Firms based in the new EU members emerged as serious competitors in the market for OFDI of an enlarged Europe (M. & W. Andreff, 2005) – FDI outflows from the CEECs have multiplied by 28 in eight years, from €100 million in 1995 to
2 The drastic growth of Russian OFDI may be somewhat overestimated due to data collection methodology,
improving throughout the 2000s, namely with a better accounting for cumulative investments made in previous years. Nevertheless, it is by far not enough to explain all the observed dramatic OFDI growth (Filipov, 2010).
€2.8 billion in 2003. This success story of MNCs from transition economies is rooted in their specific competitive advantages: a unit labour cost much lower than in EU incumbent members, a swift productivity growth since 2000, a lax tax system rather easy to circumvent, and soft enforcement of some harmonised European rules (acquis communautaire).
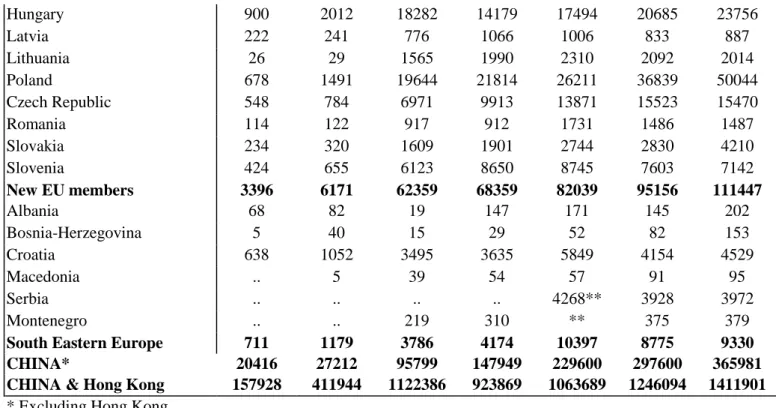
Despite such a momentum in their expansion abroad fuelled by EU enlargement, MNCs from the CEECs have not been growing as fast as Russia-based MNCs in the 2000s; the growth of the former OFDI stock – multiplied by 10 between 2000 and 2007 - was not as swift as the latter‟s – multiplied by nearly 13 (Table 2). Consequently, the magnitude of the OFDI stock from Russia was three times bigger than the one from the ten CEECs altogether in 2000; it went up to four times bigger in 2007. From 1999 to 2007, the growth of OFDI from Russia has also been faster than the one from the so-called BRICs (Andreff, 2013). For instance, Chinese OFDI (Hong Kong excluded) multiplied by 3.5 from 2000 to 2007. In 2000, the OFDI stock from China was bigger than from Russia; in 2007, the latter was 2.5 times bigger than the former. If we consider China and Hong Kong together, the OFDI stock multiplied by 2.7 from 2000 to 2007 and was 4 times bigger than the Russian one in 2007. Anyway, in the early 2000s, Russian OFDI achieved a world record in terms of growth.
Insert Table 2 about here
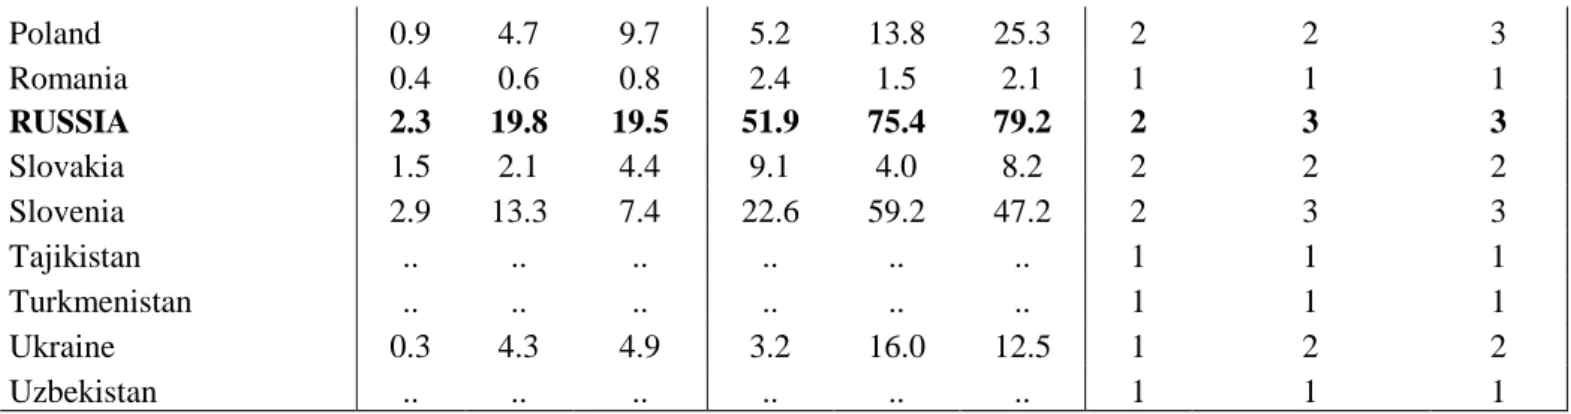
In relative terms (Table 3), Russian OFDI upgraded its structure compared with the 27 transition countries when it comes to the two following criteria: a ratio between the OFDI stock and domestic GDP on the one hand and, on the other hand, a ratio of outward to inward FDI stock. In 1999, according to the first ratio, Russia was ranked 8th among transition countries and was already on the top regarding the second ratio. In 2007, its ranking had improved as regard the first ratio (2nd rank behind Estonia) and still had the lead with the second ratio. In 2011, Russia was top for both ratios. If we require both a ratio of OFDI stock to GDP markedly higher than 5% and an outward/inward FDI stock higher than 25% as the thresholds to the third step of Dunning‟s IDP model, Russian OFDI has clearly reached it before the financial crisis, joining there the most advanced transition economies in terms of OFDI such as Estonia, Slovenia and Azerbaijan in 2007 (Hungary and Poland reached it in 2011). OFDI from mainland China (Hong Kong excluded), still ahead of Russia as to the first ratio in 1999, paradoxically4 reached the third step of IDP model only after 2007, later than
Russian OFDI5. If one accounts for Hong Kong together with China, they are in the third step since the early 1990s.
Insert Table 3 about here
From their swift pre-crisis expansion the biggest Russian MNCs held important assets abroad in 2007 and had big enough overall revenues in 2009 (Table 4). Their average size is much bigger than the one of MNCs based in other transition countries. Calculated after UNCTAD data in dividing the OFDI stock by the number of foreign subsidiaries, the average size of a Russian MNC‟s subsidiary was $70 million (in 2004). This is quite bigger than even the average size of Latvian ($41 million in 2008), Polish ($19 million in 2001), Estonian and Lithuanian ($5 million in 2007), and Slovak ($4 million in 2008) MNC‟s parent companies. With regards to the average size of foreign subsidiaries, it ranges between a few hundred thousand dollars with subsidiaries of Polish and Czech MNCs up to about $2 million for Estonian subsidiaries. Russian MNCs look like giants in a population of dwarfs. In terms of overall revenues 30 Russian multinational parent companies ranked among the biggest 500 European firms in 2009. Most of the biggest Russian MNCs (14 out of 25 in the 2007 list and 20 out of 30 in 2009) are directly or indirectly natural resource-based in oil-gas, mining and metallurgical industries. Until 2007, Russian MNCs showed a double-digit growth and high profitability (Kalotay, 2008b).
Insert Table 4 about here
Probably less than 1,000 Russian firms6 may have invested abroad. However, despite their growing size, no one Russian MNC has entered yet the list of top 100 biggest non financial MNCs ranked by UNCTAD according to the value of their foreign assets. Jardin Matheson (Hong Kong) came into this ranking in 2005 (98th), Hutchinson Whampoa (Hong Kong) and CITIC (as the 100th) in 2007. In the Fortune Global 500, 29 Chinese MNCs are found in 2008 (61 in 2011) and only 5 Russian MNCs (7 in 2011). In the Forbes ranking of 2,000 global companies, before the crisis (in 2007), there were 109 Chinese (including Hong Kong), 48 Indian, 34 Brazilian and only 29 Russian MNCs. In the BCG 100 list of emerging MNCs (2008), 41 were Chinese, 20 Indian, 13 Brazilian and only 6 Russian.
3. Russian outward FDI muddling through the crisis
5 In 2011, Russia was first ranked as regard both ratios in comparison with all other BRICs as well; OFDI
stock/GDP was 8.1% in Brazil and 6.0% in India, outward/inward FDI stock respectively was 30.3% and 55.8%.
6
The exact number of Russian multinational parent companies is unknown; the UNCTAD reckoned 1,176 foreign subsidiaries of Russian companies in 2004.
What is at stake during the current global financial crisis and economic recession is to know whether Russian OFDI would be able to get closer to the fourth IDP step with an outward stock steadily bigger than its inward stock. The crisis has triggered a collapse of world FDI outflows, primarily from developed countries, in 2008 and 2009; but it has only slowed down the growth of the OFDI stock worldwide in 2009, according to UNCTAD data. As against this worldwide trend, Russian OFDI was harshly affected by the crisis with a cut in its stock value (not only a fall in outflows) in 2008, due to both divestments from abroad and foreign asset depreciation. In 2009, its renewed growth was not enough to recover its 2007 level. Russian MNCs have been stifled by a lack of external finance. Moreover, the corporate debt of large Russian firms rose (up to $110 billion in 2009). MNCs like Rusal, Norilsk Nickel, TMK and Sistema were among the most indebted Russian companies. However, Russian OFDI stock grew again by 74% in 2010 fuelled by new investments abroad, foreign asset appreciation and likely capital flight; it lost 17% in 2011. This did not compromise its overall growing trend (the stock was 18 times bigger in 2011 than 2000); but these figures exhibit that crisis entails a much higher instability in OFDI from Russia, just like from many countries. This might postpone Russia breaking through the threshold of the IDP model‟s fourth step.
OFDI from the new EU members was apparently less affected by the crisis with an overall stock still growing every year between 2007 and 2011. However this is due to a fast growing trend in OFDI from Poland and Slovakia. OFDI suffered from the crisis with a sharp decline in Estonia and Latvia since 2009, Lithuania, Romania and Slovenia since 2010, and Hungary only in 2008. Eventually Russian OFDI did not perform that bad comparatively to transition countries when it comes to muddling through the crisis. The OFDI stock from China did even better so that it slightly passed over the value of the Russian one again in 2011.
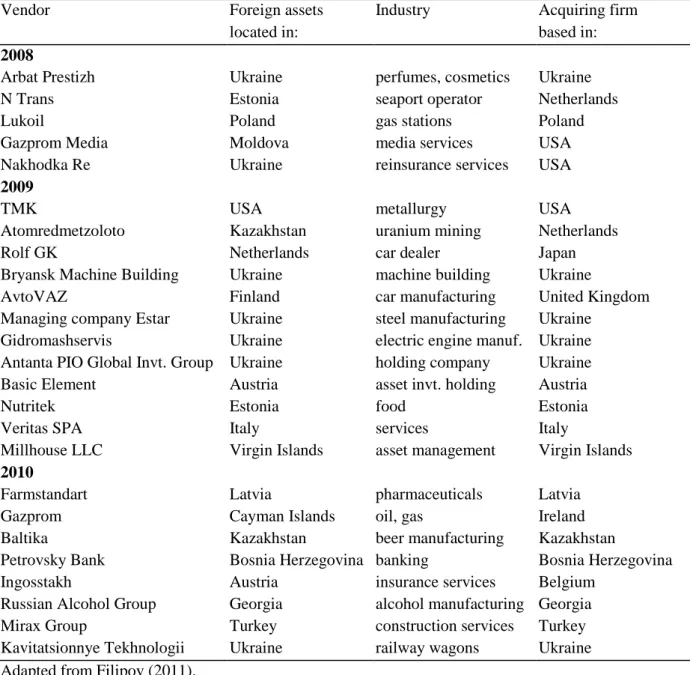
Insert Table 5 about here
A more negative impact of the crisis on OFDI may be that a number of MNCs divest from abroad. Selling the assets of foreign subsidiaries can help finance a parent company in financial distress. A MNC can always take the crisis as an excuse for cutting down some less profitable activities located in a subsidiary abroad. This obviously happened to Russian MNCs‟ foreign subsidiaries since 2008 (Table 5) whose foreign direct divestment was primarily concentrated in the EU and CIS countries, in particular Ukraine. Russian divestment also occurred in tax havens. Two examples are Millhouse, a Russian-owned asset management fund (a Roman Abramovich‟s property) which divested from the company Primerod International Ltd located in the Virgin Islands in 2009, and Gazprom which sold its holding ZGG Cayman Holding in the Cayman Islands in 2010.
The OFDI stock from Russia was 1.4 times bigger in 2011 than 2007 in spite of the crisis impact. The crisis shock has been dramatic, not radical. Russian MNCs were born in such an unstable domestic business and institutional environment surrounded by transformational recession, then they went through the 1998 Russian financial crisis. From all these sequences they have learned a lot about how adapt to financial crash and credit crunch. This underlies their resilience to adverse economic effects in the global financial crisis.
4. From outward FDI determinants to MNCs strategies: an analytical synthesis
The rest of this chapter refers to an analytical framework which must be briefly reminded. Contemporaneous analyses of OFDI regarding emerging countries and their MNCs often distinguish between pull factors and push factors (Dunning, 2008; Gugler and Boie, 2008).
Pull factors are those which attract and drive inward FDI into a given country, otherwise
coined host country‟s factors of attractiveness to FDI. They differentiate host countries. Some well-known and tested examples are: host investment climate and country risk, the judicial and fiscal environment provided to foreign investors and host government policies (of which liberalisation and privatisation), host country‟s inflation rate, growth rate, interest rate and spread, fiscal deficit, exchange rate, unemployment rate, unit labour cost, market size, tax pressure, access to local high technology or natural resources, and the quality of local institutions such as the rule of law, the efficiency of government expenditure, political stability and control of corruption (tested in M. & W. Andreff, 1997 & 2005), as well as host country‟s participation to regional international agreements and trade areas. Thus, when analysing OFDI, the explanatory power of pull factors is basically to point out which host countries do attract foreign investments flowing from any home country. In other words, pull factors definitely are the determinants of the geographical distribution between host countries of OFDI from (a given set of) home countries.
Push factors usually are referred to as home country-specific. They basically are drivers for a
home country substituting investment abroad to domestic investment; they explain why investment is pushed outwards the domestic borders. Push factors obviously underlie the IDP model such as the domestic market size (GDP or population as a proxy) and economic development (GDP per capita), its technological level, its industrial structure (the distribution of value added across different industries) and less stable variables such as growth rate and exchange rate (Andreff, 2003c). In addition, often listed push factors are: excess domestic production capacity, domestic market saturation, home competitive pressures, trade barriers,
increasing domestic production costs, inflation hikes, using the domestic natural resource base for expanding abroad, underdeveloped domestic capital market, bad or worsening local business environment that triggers investing abroad to hedge against domestic uncertain investment climate, domestic government policies; and, in post-communist countries, escaping the troubles of an economic system in transition (Bulatov, 1998).
Now, which are the relationships between OFDI pull and push factors on the one hand and, on the other hand, the strategies of MNCs? Pull factors are the determinants of a MNC (outward investor) trade-off between host countries and between resource-seeking, market-seeking, efficiency-seeking and asset-seeking strategies typified by Dunning, and a possible global strategy. The latter is a MNC multi-faceted strategy – not only restricted to a geographical dimension or a set of industries – and merges market, efficiency, resource and asset-seeking FDI motives. It is analysed in depth as global in scope, distributing all the MNC‟s chain value all over the globe, maximising the parent company‟s global (consolidated) profit typical in global oligopolies, based on a post-Fordist high tech and flexible production process that can easily be fragmented and relocated (Andreff, 2009a), a networking organisation, strategic alliances with other MNCs, and the internationalisation of shareholding (Andreff, 1999a & 2003a; Yip 1997). Pull factors determine a MNC choice to invest in one host country rather than another one on the basis of their attractiveness variables (Andreff 1999b; Michalet 1997 & 1999). Thus, they appeal MNCs in various host countries, largely shape the OFDI geographical distribution and provide the rationale for the different strategies used to invest in various host countries, including the best appropriate mode of entry to each strategy.
The relationships between OFDI push factors and MNC strategies are straightforward. Push factors are the determinants of a company‟s propensity to substitute OFDI to domestic investment and they are embedded in the home country‟s economy: the domestic market size, its level of economic development, its macroeconomic variables (inflation, growth, unemployment, exchange rates, etc.), the domestic costs of factors of production, home investment regulation, if any, and institutions, how the home government interacts with companies‟ investment decisions, all factors that may depend on domestic industries and markets a company is involved in. Therefore, push factors are determined by domestic macroeconomic dynamics and industrial structure and, thus, widely determine home country‟s MNCs from one industry rather than another to invest abroad. They are drivers of the FDI outflows, foreign assets and foreign subsidiaries industrial distribution achieved by home-based MNCs, and to some extent they are linked to the IDP step a home country is evolving in. Consequently, push factors influence the FDI “mode of leaving” a home country, namely a
MNC‟s trade-off between greenfield investment, mergers and acquisitions (M&As), round tripping FDI and capital flight.
Thus, a MNC undertakes a FDI when pull and push factors fit together - and the mode of leaving a home country is in accordance with the mode of entry in a given host country. A MNC operating in a small or slow-growing or saturated domestic market adopts a market-seeking strategy geared towards bigger or fast-growing host markets. High or increasing domestic unit production costs determine MNCs to seek host countries with lower unit costs through an efficiency-seeking FDI. Scarce or shortening natural resources at home push MNCs to secure their input supply from well-endowed host countries with a resource-seeking strategy. These double fits between domestic push factors and host countries‟ pull factors crucially determine the OFDI geographical distribution and industrial structure.
5. Specificities and determinants of outward FDI from Russia
Although OFDI from Russia is the 15th most important source of OFDI worldwide in 2011, just behind China and right ahead of Sweden, it is sometimes coined “non-conventional” (Kuznetsov, 2010a). For sure, it is quite specific with regards to its geographical distribution, industrial structure, and determinants.
5.1. Geographical and industrial specificities of Russian outward FDI
Data collection by the Central Bank of Russia covers four different FDI outflows: a/ Not exclusively financial investment abroad by Russian firms and banks. b/ Individual investment by Russian citizens in real estate abroad, including the money invested by new rich, some
maffiosi, capital flight, and money laundering. c/ Round tripping FDI, i.e. investment by
Russian enterprises and citizens in offshore companies, in particular in Cyprus, the Virgin Islands and other tax havens, in view of reinvesting the corresponding capital later on in Russia7; since Russian OFDI located in tax havens still represents a significant share among host countries (Table 6), round tripping probably has not ceased yet8. d/ Investment abroad by
7
This so-called circular investment, transferred through FDI in order to come back to Russia is analysed in detail by Pelto, Vahtra and Liuhto (2003).
8 On the contrary, since the 2008-on crisis round tripping and trans-shipping FDI received in offshore economies
has accelerated again to reach up to two-thirds of Russian OFDI. Its final destination is the CIS, the CEECs and primarily the Russian Federation herself.
Russian investment funds and some minor investments9. Statistical knowledge about the last three sorts of FDI outflows is blurred – when not entirely hidden – by non transparent transactions; the first and third kinds of FDI outflows are the most tightly related to the booming expansion of Russian MNCs.
The initial geographical orientation of Russian OFDI was geared towards the “close abroad”,
i.e. the CIS independent member states, as a legacy from the past. Various studies confirmed a
significant involvement of Russian FDI in Belarus, Kazakhstan and Ukraine (Yeremeyeva, 2009; Blyakha, 2009). The next most important host countries are the CEECs as former CMEA (Comecon) members in which, like in the CIS, Russian companies enjoy familiarity with local business conditions. Then follow the EU incumbent members which, in a short lapse of time, have taken place among the significant host countries for Russian OFDI (Andreff, 2003c). Such geographical distribution was specific to the first decade of Russian companies‟ expansion abroad. It can still be traced back from the distribution of foreign assets in the biggest 20 Russian non financial MNCs in 2008: 23% were located in CIS countries, 49% in Europe, 17% in North America, 7% in Africa, 4% in Asia and peanuts in Latin America.
Insert Table 6 about here
In the past recent years, the OFDI geographical distribution has started changing (Table 6). More non European countries now appear among the major host areas for Russian MNCs settlement, namely the U.S., Canada, the United Arab Emirates, and India. Since 2005, Russian MNCs have made noticeable acquisitions in developing countries, focusing on Asia and Africa (Kalotay, 2008b). To some extent, Russian MNCs are somewhat loosing their specificity as companies from emerging countries supposed to achieve most of their OFDI on an “intra-regional” base in countries located in the same region of the world as their home country10. Thus, some Russian MNCs are on the brink of a global strategy in which foreign subsidiaries are located anywhere in the world if their profitability there is higher. The only exception so far is Latin America – with no one of the first 30 host countries for Russian FDI that belongs to – due to its remote location from Russia and institutional barriers such as absent bilateral non double taxation and investment treaties with Russia.
9
For example, the purchase of Western European football teams by Russian oligarchs (ex: Chelsea by Roman Abramovich).
10 However, a same evolution of investing far beyond an intra-regional base, in developed countries, is witnessed
with Chinese and Indian MNCs as well, which is not without raising new theoretical challenges that are tackled by Andreff and Balcet (2013); see their contribution to this volume (chapter n).
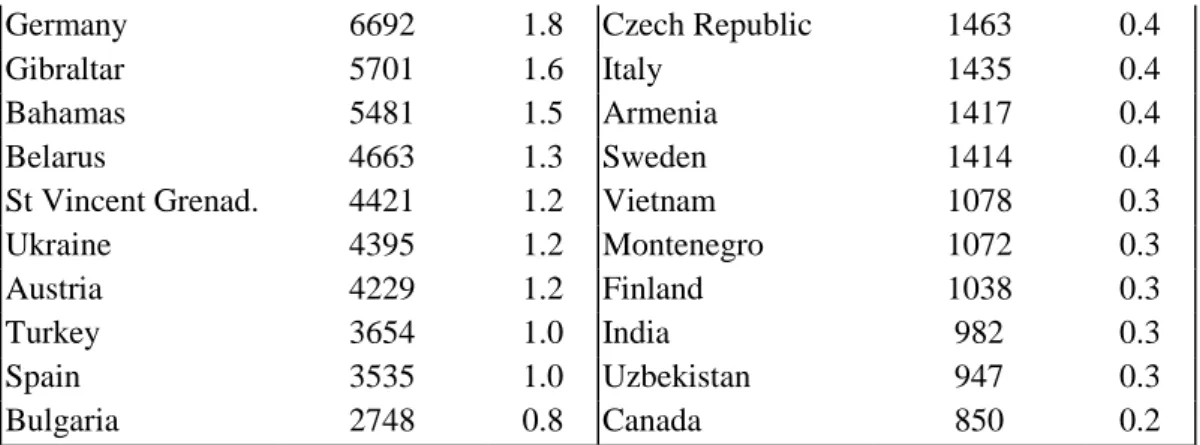
Note that tax havens are highly ranked among the major host countries for Russian OFDI: Cyprus, the Virgin Islands, Luxembourg, Jersey, Gibraltar, Bahamas, St Vincent & Grenadines, St Kitts & Nevis, Bermuda, and the Isle of Man; together they attract about 58% of overall OFDI. Most of them, like Cyprus, are well-known rocket pads for round tripping circular investment. Apart from tax havens, the major host countries for Russian MNCs show up one of the four following characteristics: a/ they belong to major export markets for Russian products (the Netherlands, the UK, Germany, Austria, Turkey, Spain, Bulgaria, France); b/ they share a common culture and use Russian as business language (Belarus, Ukraine, Kazakhstan, Lithuania, Armenia, Uzbekistan); c/ they have tight political links with Russia (Belarus engaged talks for years in view of merging with Russia, Kazakhstan joined a free trade area with Russia and Belarus); d/ and a few markets are located at a remote trade distance from Russia (USA, Canada). These characteristics tend to validate the assumption that Russian firms‟ internationalisation proceeds step by step (as meant in the Uppsala theory: Johanson & Vahlne, 1977) starting with exporting to foreign markets then, when such exports are a success story, accompanying the export business with OFDI.
The industrial structure of Russian OFDI11 is also specific when compared to both emerging countries‟ OFDI and the structure of the domestic economy in Russia. In 2008, as to Rosstat data, the Russian economy‟s GDP broke down into: 21.3% for trade, 18.0% for the manufacturing industry, 15.0% for services (including finance), 9.6% for transport and communication, 9.5% for the mining industry, 6.7% for construction, 5.9% for education, health and the social sector, 5.1% for administration, defence and social insurance, 5.0% for agriculture, and 3.0% for electricity, gas and water. The industrial distribution of Russian OFDI is much more concentrated on few industries. First, Russian MNCs are overrepresented in natural resource exploitation, mining and metallurgical industries, then in traditional manufacturing industries, all inherited from the top pecking order of heavy industries in the former Soviet system. Cases in point are Gazprom (gas, oil), Lukoil, Itera, Tatneft, Novatek in the oil industry; Severstal, Evraz, Norilsk Nickel, Alrosa, Basic Element (a conglomerate which owns Rusal), NMLK, Mechel, TMK, Koks, Metalloinvest, MMK, and Novolipetsk Steel in the metallurgical industry; Renova, OMZ and Borodino in machinery; AvtoVAZ, GAZ, UAZ and KAMAZ in the automobile industry; and in various industries, Investlesprom (paper-wood), Eurocement and LSR Group (building materials), Eurochem (chemical
11 The Central Bank of Russia does not publish (yet) a breakdown of OFDI by industry that can compare with
the MOFCOM data used below for the industrial structure of Chinese OFDI. However, Chinese data are somewhat blurred with regards to those flows transiting through Hong Kong.
fertilizers), Acron (agro-chemistry), Vostok-service and Gloria Jeans (clothing), Kalina (perfumes, cosmetics), WimmBillDann, Russian Solod, SGI Group, Alterwest and Russian Wine Trust (agro-food industry) and Inter RAO UES (electricity).
However, it is to be noticed that Russian OFDI also started booming in the 2000s in a more modernised part of the manufacturing industry with the Sistema group (to which belong MTS in telephone production, Sitronics in telecommunication equipment, and RTI Systems in aerospace and missiles production), Vimpelcom, Altimo, Megafon and the Alfa Group in telecommunications, Korolev Rocket and Space Corporation Energia (aeronautics), NPO Mashinostroyenia (military equipment), as well as most of the big Russian insurance and financial companies, big banks such as Sberbank, VTB, Gazprombank, Alfa-bank and Bank of Moscow, and transportation networks (Sovcomflot). Such MNCs exemplify a more recent industrial diversification of Russian OFDI which spreads over high tech industries and services resulting from the modernisation of the Russian manufacturing industry which was launched at the dawn of the post-Soviet transition and became more deeply rooted after 1999.
5.2. The determinants of OFDI and trans-border mergers and acquisitions
A genuine theory specifically explaining the strategies of Russian MNCs and the determinants of their OFDI is not available so far. Obviously, such theory should not be far away from the analysis of OFDI determinants from the BRICs and emerging countries in the framework of the IDP model. Though successfully tested for transition countries taken together (Andreff, 2003c), the latter does not entirely account for the whole specificity of Russian MNCs. It is even contented that Russian OFDI is not actually verifying the IDP model (Kalotay, 2008a) because it started up as a form of capital flight linked to bad domestic investment climate until 1998. Moreover, a number of companies became MNCs overnight with the break-up of the former Soviet Union whereas those assets grabbed by a handful of powerful oligarchs in the privatisation drive had rapidly evolved into MNCs. Besides, a number of Russian MNCs compare to those MNCs based in developed countries (Kuznetsov, 2010b), as if Russia was on the verge of reaching the fourth step of IDP model. Companies with a rapid internationalisation in telecommunications (Sistema, Vimpelcom) and middle technology-based Russian MNCs such as Tecnoserv, Croc, LANIT and Playton are standing there.
Kalotay and Sulstarova (2010) have suggested the following explanatory model12, supposed to specifically fit with Russian OFDI. Econometric testing relies only on data about trans-border M&As involving Russian firms which is indeed a major part of Russia‟s overall OFDI. The model primarily takes on board pull factors:
FDIMArh = a + b.GDPh + c.GDPr + d.NRh + e.SERh + f.DISTrh + g.rh + i.CIS + j.PATh + uh
where the independent variable FDIMArh stands for OFDI from Russia to a host country h
achieved by means of merging or acquiring a foreign company. Independent variables are: . Russia‟s and host country‟s GDP, as proxies for the respective size of their markets;
. the share NRh of natural resources and raw materials in overall Russian exports to each host
country h, which is assumed to reflect its comparative endowment in natural resources; . the share of services in the host country‟s GDP SERh ;
. the geographical distance between Russia and each host country DISTrh , a classical gravity
variable;
. the rouble exchange rate against a host country‟s currency rh ;
. a dummy variable standing for CIS membership which is assumed to represent a cultural proximity between Russia and a host country;
. the number of patents registered in a host country PATh showing whether a country h is a
favourable location for Russian MNCs where to acquire technological assets.
It results from econometric testing that market size is the most significant explanatory variable: Russian MNCs first invest abroad to capture foreign markets. The NRh variable is
also significant: Russian MNCs invest abroad to secure their supply of natural resources. The share of the tertiary sector (services) in the host economy, the distance from Russia, exchange rate, and the cultural proximity are not significant determinants of Russian OFDI. Despite its obvious interest, this modelling is submitted to two limitations: it does not explain at all the determinants of Russian greenfield investment abroad – if by chance they were different from those of M&As - and, more basically, it does not introduce either a dummy variable for the influence of Russian government13 on the strategies conducted by Russian MNCs, whatever state-owned or privately-owned, or any other push factor.
12
Technically speaking, it is a log-linear model which all variables are in log except the geographical distance and a dummy for CIS membership.
13 Kalotay and Sulstarova (2010) take into account a change in the government policy with simply distinguishing
the period when B. Yeltsin was the President of the Russian Federation from the one when V. Putin stepped in. Kalotay (2008a) stressed an increasing role of the government in controlling those companies exploiting natural
6. Similarities and differences between Russian and Chinese multinational companies
Russian MNCs nearly caught up Chinese MNCs during the past decade while the latter still benefited from the first mover advantage of their front running OFDI which commenced more than thirty years ago. Nevertheless the result is a more similar than different OFDI regime.
6.1. Russian multinationals: from opacity to globalisation …or copying China?
Russian MNCs are used to disclose a very little information with regards to their economic activity abroad14. This strategy of opacity, non transparency and information concealment is a typical feature of Russian MNCs, even though it is slightly stepping back now. The expansion of Russian MNCs abroad has often been interpreted in a first phase as capital runaway, if not an exodus, toward friendly, more stable, and less risky foreign investment climates than in the Russian domestic market (Bulatov, 1998; Kalotay, 2004b; Vahtra & Liuhto, 2004). Round tripping FDI is exemplary of such strategy which has been more widespread in the 1990s than in the 2000s before the crisis.
Another strategy in a sense follows up the one of former red multinationals developed to serve former Soviet foreign trade purposes. Rather frequent in Russian manufacturing industry, it is a market-seeking OFDI relaying previous export. Market-seeking FDI strategy pertains to traditional markets such as the CIS; it is also the rationale for Russian OFDI in Western markets where Russian firms face tough competition and are strongly challenged when entering in. Those Russian MNCs which invest abroad in mining, oil and gas industries have adopted a resource-seeking approach and attempted to take over their most needed suppliers abroad by means of M&As. Russian OFDI in the CIS is basically resource-seeking geared towards oil, gas and mining. The same strategy applies to the fairly recent Russian OFDI in Africa though it is mitigated here with a motive of accessing to new consumer markets. Russian MNCs have not yet adopted an efficiency-seeking strategy although they could have envisaged it in lower production cost CIS and developing countries. However a sort of efficiency-seeking OFDI emerged with the purpose of consolidating or re-integrating assets located in CIS countries and the CEECs (Filipov, 2010). Finally, Russian companies have
resources as the most specific factor that impeded applying all the FDI explanatory theories to the analysis of Russian MNCs.
14
For example, Gazprom for years did not provide those data requested by UNCTAD for its world investment report.
conducted an asset-seeking strategy based on M&As in view of acquiring Western technology and R&D intensive units.
Insert Table 7 about here
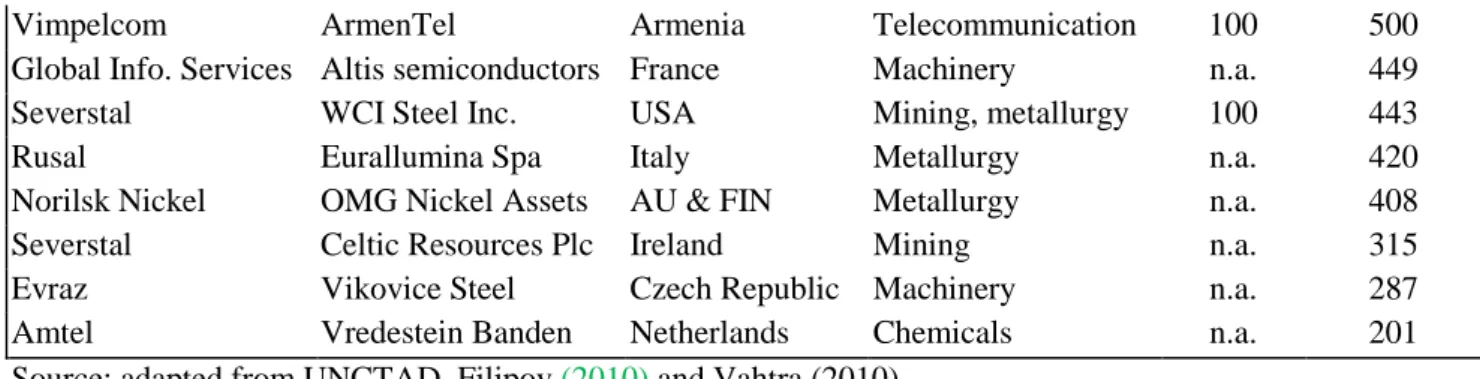
Trans-border M&As enable Russian MNCs to consolidate their global competitiveness in
creating or reaching the advantages of a monopoly or dominant oligopoly position in some foreign markets. The main target for M&As by Russian MNCs is to take over European and North American firms. Between 2005 and 2010, M&As have primarily targeted an entry in industries linked to natural resources in the U.S., Canada, Italy, Switzerland and South Africa (Table 7). Big trans-border M&As are less frequent in the “close abroad” whose firms are of smaller size and less attractive in terms of high tech assets. A few exceptions are the Vimpelcom-Kyivstar, Gazprom-Beltransgaz, and Evraz-Sukhaya Balka deals. The share of the primary sector is steadily around 60% of all M&A deals while the share of the manufacturing industry is below 25% since 1997 (Table 8). A predominant resource-seeking motive is obvious. The proportion of M&As in Europe (CEECs included) peaked up in 1997-2000 whereas the one in the CIS climaxed in 2001-2004. The first asset acquisitions appeared in developing countries since 2005 and the share of non-European (primarily North American) developed countries is around 20-25% of total M&A deals. The financial crisis impacted M&As undertaken by Russian MNCs downwards. While the overall number of trans-border M&A deals was 114 in 2007 and 119 in 2008, it fell down to 102 in 2009 and 70 in 2010 (Filipov, 2011).
Insert Table 8 about here
OFDI by Russian MNCs directly in R&D is less the rule than exception so far, but it is significant sign of a step forward toward a more global strategy. For instance, Sistema entered the stock equity of an Indian company in the mobile telecommunication industry in 2008 and then attempted to acquire a German firm involved in microelectronics, Infineon, in 2009 (Vahtra, 2010). Similarly, Sberbank had attempted (but failed) to participate into the purchase of Opel, a General Motors subsidiary, during the bankruptcy proceeding of this company, in view of capturing its high technology. In the iron and steel industry, Evraz, Severstal and Rusal have invested a big deal of money for technological development in their foreign subsidiaries whereas, in the oil industry, Lukoil and TNK-BP have acquired foreign firms in view of upgrading their own technological level. This spread of trans-border M&As by Russian MNCs in high-tech industries was backed and supported by the highest Russian authorities, even up to President Medvedev.
A few Russian MNCs seem to have turned to a global strategy in the past recent years, not only as far as their geographical orientation is concerned, but also in playing on all the cords of such a strategy (Andreff, 2003b). One of them consists in integrating all their value chain on a world scale; the different sequences of the production and trade process (input purchase, supply, production, products delivery, sales, and after-sale services) are allocated in various countries depending on profitability criteria. In recent years, this tendency was observed with Russian MNCs (Vahtra, 2010). In view of international chain value integration, the latter have often bought or merged assets located abroad, which is a second dimension of a global strategy. A third one is a global scope for asset-seeking OFDI, through M&As, into technological assets required for R&D and it often makes up for a decisive step forward on the path to globalising a MNC‟s strategy; here are some Russian MNCs today. A fourth dimension of global strategies lies in strategic alliances. Russian MNCs have formed strategic alliances with foreign partners – often other MNCs – since 2000: on average 40 per year with one 89 peak in 2007. This is one of the most representative evidence of evolving toward a global strategy and a sign of maturing strategies in some Russian MNCs. Moreover such alliances facilitate the entry into foreign markets. Still a few Russian MNCs are on the brink of switching to the above-defined genuine global strategy; some cases in point are Renova, TMK, and to some extent Gazprom, Lukoil, and NMLK.
In 2008, President Medvedev appealed to Russian companies to “copy China” by expanding overseas and going on in a global spread of their foreign assets, even though the government has not yet developed a consistent policy framework – such as a perspective specialised agency for investment support under the auspice of Vneshekonombank - for assisting Russian MNCs in their global expansion. Let us have a comparative view over the Chinese model of MNCs which was recommended to be copied by Russian companies.
6.2. Similarities between Chinese and Russian multinationals: easy copying
Chinese MNCs hold a first mover advantage compared to MNCs from all other transition economies. They began establishing subsidiaries abroad as early as 1979, primarily to open new export markets (Ye Gang, 1992). Since then they were ahead of Russian companies in investing abroad: OFDI from China in 1992 ($7,401 million) was of about the same magnitude as the one from Russia in 1998 ($7,385 million). In 2005, 3,429 parent companies of Chinese MNCs had settled about 280,000 foreign subsidiaries (and 948 Hong Kong MNCs with 9,072 additional subsidiaries abroad) while an unknown number – likely lower than
1,000 parent companies – of Russian MNCs were holding 1,176 foreign subsidiaries. In the 2000s, Russian MNCs benefited from an “accelerated internationalisation”, a common surge for late-coming MNCs, since they were lagging behind Chinese MNCs in OFDI business.
Insert Table 9 about here
It is often stressed that the growth of Chinese MNCs has been boosted by a preliminary
substantial inward FDI of Western MNCs into China since 1979 in tune with the so-called
LLL - Linkage, Leverage, and Learning - approach (Matthews, 2002). Richet (2013) stresses the importance of instilling spillovers, incubators and learning by doing business with foreign investors in mainland China as a push factor in the emergence of Chinese MNCs. The former USSR opened up to inward FDI comparatively later, in 1987, and the LLL process was much slower in the 1990s given the bad domestic investment climate in Russia (Andreff, 1999a). After past technology transfers from foreign MNCs resulting in productivity spillovers to domestic Chinese firms, it is expected that China‟s OFDI would channel comparable transfers and spillovers from China to developing countries (Lian and Ma, 2011). It should make Chinese MNCs more acceptable in this sort of host countries.
Insert Table 10 about here
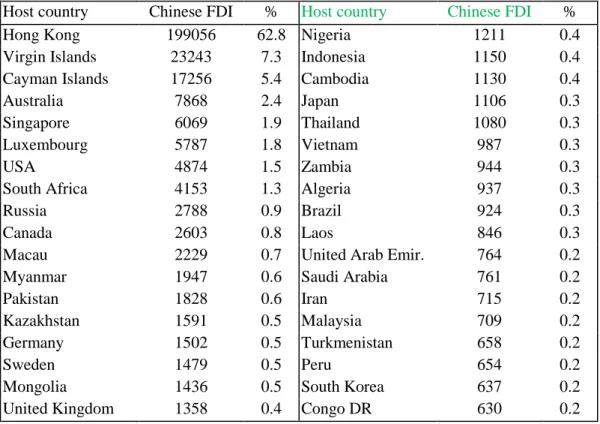
A significant share of Chinese OFDI consists in round tripping, since 75% of overall stock in 2010 are invested in tax havens15(Table 10), which is a much higher share than with Russian OFDI (58% in 2011). It is what most Chinese OFDI in Hong Kong, Macau, the Virgin and Cayman Islands are all about. Chinese investments to mainland China moving through Hong Kong account for nearly two-thirds of total OFDI. As a consequence the OFDI boom from mainland China is overestimated in most comments of official (MOFCOM and UNCTAD) data at least as regard its magnitude if not its momentum. This incurs that actual OFDI from
mainland China was and still is markedly smaller than Russian OFDI in the past recent years.
Except offshore centres, the next major host countries for Chinese OFDI are located in the neighbouring South East Asia and East Asia, i.e. 15 among the first 36 host countries. Western advanced economies are the next most important hosts, first of all Australia and the US (the Pacific Rim). Hence, Chinese MNCs, like Russian ones, are lean to privilege first a close geographical area and, second, developed market economies. However, they have already significantly spread in some African (South Africa, Nigeria, Zambia, Congo DR) and remote Latin American (Brazil, Peru) countries. At the end of the day, the geographical
15 Indeed, only a part of Chinese OFDI transiting through tax havens, namely Hong Kong, are round tripping flows, but this applies to Russian OFDI as well. Unofficial assessment is that round tripping may be up to 50% of OFDI to Hong Kong.
distribution of Chinese OFDI is more diversified than the Russian one, namely in Latin
America and Africa - where first Russian OFDI have emerged only recently.
Chinese MNCs also invest in transition economies though the latter‟s share in Chinese OFDI is small (3% of 2010 overall stock) but its growth rate is the fastest in the past recent years, concentrated in the CIS and Mongolia (Korniyenko and Sakatsume, 2009), with an increased interest in Central Asia (Kazakhstan, Turkmenistan). However, the focus in this area is definitely on Russia, ranked the 9th host country for Chinese OFDI, and the 5th one after Australia, Singapore, the US and South Africa when excluding offshore destinations and Hong Kong. For instance, Hisense owns a sales base in Russia and a production centre in Hungary, TCL disposes of factories in Russia and Poland. Chery Automobile invested in an assembly line in Russia in 2006. Geely holds a joint production plant in Russia and sales companies in Ukraine. In the textile industry, there are many Chinese investments in Mongolia. CNOOC is a major shareholder in the Kazakhstan North Caspian Operations Company. Thus, Chinese MNCs harshly compete with Russian MNCs since the mid-2000s in the latter‟s privileged areas for OFDI: Central Asia, other CIS countries and to some extent the CEECs. A deep asymmetry lies in there: China significantly invests in Russia whereas the
reverse investment from Russia into China is much less impressive. When visiting Russia east
of the Urals, a number of Chinese investors can be seen, and the local population intensively feels their presence, while Russian investors are nearly invisible in most Chinese provinces.
Insert Table 11 about here
The most striking feature in the industrial structure of Chinese OFDI is the high share of services, between one-third and two-fifths in the total. If one adds banking and trade to other services, the share of the tertiary sector is up to about 60% of overall OFDI (Table 12), which resembles the industrial structure of OFDI from developed countries. Investing abroad in the tertiary sector is typical of the global strategy conducted by major Western MNCs (Andreff, 2003a). Chinese MNCs are about to stick to such strategy and likely to be ahead of Russian MNCs in this respect, none of the latter being known as a leader in the global services industry so far, except banking. The next important industry is mining where a
resource-seeking strategy of Chinese MNCs is at work. However, it is far from the overwhelming share
of mining, oil and gas in Russian OFDI. With a noticeable difference: while Russian MNCs in this industry invest abroad looking for both new supply sources and new markets (oil and gas stations), the Chinese strategy is almost exclusively geared towards securing a supply of raw materials for the domestic economy. Chinese MNCs look for securing their supply in natural resources all around the world: basically in Australia, Russia and Canada among the first host
countries, but increasingly in Latin America, Central Asia, and Africa. Chinese OFDI in the manufacturing industry is less significant than in mining and its share decreases in the total from 2004 to 2010 (while the share of banking is rising).
Insert Table 12 about here
State-owned enterprises (SOEs) as well as privately-owned MNCs differentiate with regards to their motives of internationalisation. Chinese SOEs are attracted in countries with large endowment in natural resources and rather risky political environment. Private MNCs are more purely market seekers. Although all Chinese public and private firms have strategic intent with asset-seeking, the attraction is to commercially viable technology rather than core research content. Such technological asset-seeking strategy is primarily adopted when investing in advanced developed economies where Chinese MNCs are motivated by an access to strategic assets corresponding to China‟s strategic needs (Deng, 2007). Chinese MNCs have been portrayed as internationalising in order to improve their access to foreign proprietary technology and enhance competitiveness through diversifying their activity. Asset-seeking has been used on purpose. With domestic wage inflation in the recent years, some Chinese companies started relocating their production in geographically close countries with markedly lower unit labour costs16 such as Vietnam and North Korea. This signals the emergence of a new efficiency-seeking strategy which is likely to develop in the years to come with the current rise of comparative unit labour cost in China.
Buckley et al. (2008) have tested the following explanatory model for the determinants (all variables in log) of Chinese OFDI:
OFDI = a.GDPh + b.OILh + c. PATENTh + d.TD94 + e.BITh + f.ACBIT + g.DTTh + i.ACDTT + j.WTOh + k.CPh + l.DISh + m.RISKh + n.PPPh + o.ERATEh + p.INFh + q.EXPh + r.IMPh + s.INFDIh + uh
where GDPh stands for GDP per capita in host countries h (captures market-seeking FDI motives), OILh for oil and gas exports of h to China (captures resource-seeking motives), and
PATENTh for total annual patent grants in h (captures a technological asset-seeking strategy).
The next variables are institutional one of which is endogenous TD94, the liberalisation of foreign exchange control in China in 1994. Exogenous institutional variables are: BITh the number of bilateral investment treaties concluded by a country with China, ACBIT the total number of BITs a country has concluded, DTTh the number of non double taxation treaties
concluded by a country with China, ACDTT the total number of DTTs a country has concluded, WTOh membership of a country h in the WTO, CPh cultural proximity to China, and DISh the geographical distance of a country from China. The model is completed with control variables regarding political risk RISKh, purchasing power parity PPPh (to check the difference in inflation rates between a country h and China), exchange rate of the h country‟s currency against the renminbi ERATEh, inflation INFh, exports EXPh to China, imports IMPh from China, and a market openness to FDI index INFDIh, i.e. the ratio of inward FDI to GDP. Note that the model basically gathers pull factors, the only push factor being the liberalisation of the renminbi exchange rate. Obviously, more variables about Chinese governmental policy toward OFDI are missing on the push factor side. The significant variables coming out from testing are the market size, WTO membership, cultural proximity, all in favour of
market-seeking determinants. The exchange rate policy change (TD94) is significant but not with the
expected sign: surprisingly, Chinese OFDI is negatively associated with the liberalisation of foreign exchange controls. In addition, OFDI should be determined by the „go global‟ measures (7 below) but they are not actually tested here. No significant relationship is found between Chinese OFDI and economic and institutional variables; OILh and PATENTh,
paradoxically provide no support to resource-seeking and advanced technology and know how asset-seeking strategies by Chinese MNCs, no more than a gravity (distance) determination. All control variables are significant except host country risk; the contention that Chinese MNCs are attracted - or less reluctant to invest - in highly risky countries (Buckley et al., 2007; Morck et al., 2007) is not confirmed17. Compared with the above model for Russian MNCs, the primary strategy is market-seeking in either case whereas resource-seeking strategy is empirically (econometrically) more crystal-clear with Russian MNCs. In an explanatory model rather similar to the previous one, Rodriguez and Bustillo (2011) introduce a host country‟s governance variable taken as usual as the average of the six World Bank‟s indicators of control of corruption, government effectiveness, political stability, regulation quality, rule of law, voice and accountability (Kaufmann et al., 2008 ). They do not find any significant relationship between governance and Chinese OFDI; strong governance in a host country neither attracts Chinese OFDI nor does low quality (thus risky) institutional
17 Due to risks involved in institutional uncertainty, barter and networking business, guanxi relationships based
on informal norms, mutual trust, personal connections, ethnic linkages, corruption and the like in the Chinese post-communist transition, Chinese companies are often assumed to be more capable (than Western MNCs) to deal with troublesome regulation and opaque political constraints. They easily survive in comparably weak institutions in Central Asian and African host countries. Such experiences are even considered as an intangible asset of Chinese MNCs by Morck et al. To say the least, Russian MNCs started evolving at home in no less corrupted, networking and informal surroundings in a first stage of Russia‟s economic transition, and they hold the same intangible asset.
framework hinder it. In addition, the resource-seeking motive is found significant which fits better with the actual strategies of Chinese MNCs observed at the enterprise level. However, poor institutions may well be linked to natural resource endowment anyway because rent appropriation leads to rent-seeking, patronage and corruption. This is what Kolstad and Wiig (2009) demonstrated meanwhile, testing the effect of the interaction between natural resources and poor institutions on Chinese OFDI. In host countries with poor institutions natural resources attract Chinese OFDI. Finally, Fung and Garcia-Herrero (2012) found that Chinese OFDI is more attracted (than Indian OFDI) to more corrupt countries, but this result is mostly driven by Chinese investment in African countries. Chinese OFDI primarily flows there into larger and poorer countries well endowed with fuels.
Insert Table 13 about here
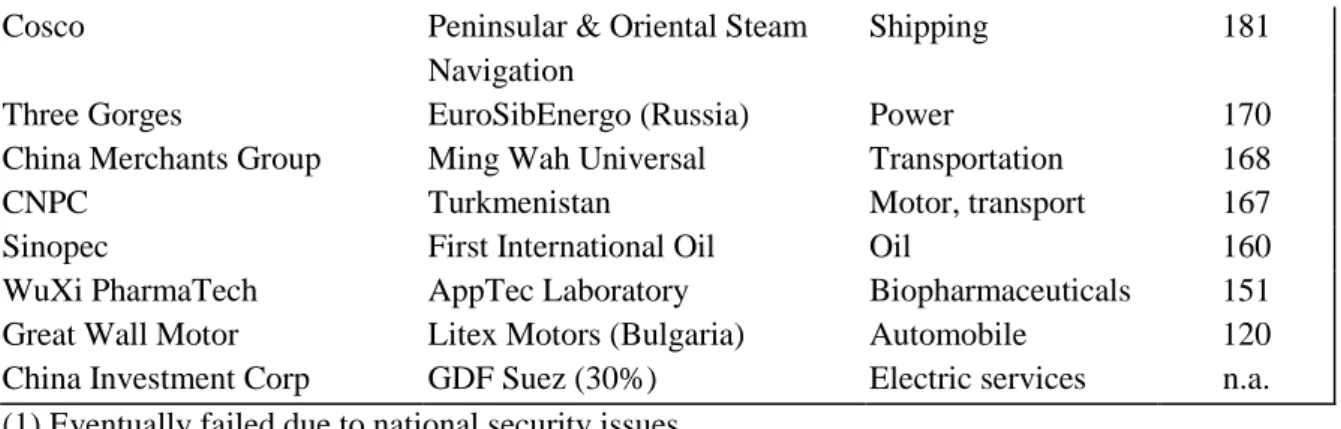
The M&A mode of Chinese MNCs‟ entry suddenly took off after 2000 targeting both developed and developing countries, in particular since 2004 when the „go global‟ measures had materialised. In October 2004, a circular issued by the National Development Research Council (NDRC) and the Export-Import Bank of China explicitly promoted trans-border M&As. Renminbi appreciation against the US dollar and the Euro in the recent years has reduced the cost of Chinese M&As over Western companies. From 2000 to 2010, Chinese MNCs merged or acquired 83 companies located in the EU countries (Clegg and Voss, 2012). In transition economies, CNPC bought a $500 million stake during Rosneft‟s initial public offering and Sinopec acquired a 96.9% share in Udmurneft in Russia. CNPC acquired the North Buzachi oilfield in Kazakhstan through the purchase of Canada-based PetroKazakhstan and took a 25% stake in the Saylan oilfield in Azerbaijan, and son on (Table 13).
However, some Chinese MNCs have failed in their M&A strategy, for instance TLC and SAIC in South Korea. It is reported that 90% of the 300 trans-border M&As achieved between 2008 and 2010 failed and translated into a 40% fall in the stock value of those companies involved (Richet, 2013). Thus, in presence of very high country risk, Chinese MNCs prefer greenfield investment. When a host country has stronger national innovation ability or higher level of human capital, Chinese firms tend to choose M&As. An increase in the cultural distance appears to induce Chinese MNCs to select M&As as well (Hu et al., 2012). The number and magnitude of trans-border M&A deals by Chinese MNCs on average
are much bigger than those observed for Russian MNCs.
A study on MNCs based in the BRICs (Holtbrügge and Kreppel, 2012) concludes that while the internationalisation of Brazilian and Indian companies is primarily driven by economic motives, many Chinese and Russian firms also receive substantial political support from their governments to invest abroad, especially in strategically important industries. The Chinese government explicitly launched and then institutionalised a “go global” OFDI strategy while Russia proceeded with a less formal support policy to Russia-based MNCs relying on oral incentives, economic influence and some watchwords like “copy China”.
7.1. Russian multinationals: instrumental to Russia’s foreign policy
A nice typology of Russian MNCs has been put forward (Liuhto and Vahtra, 2007) by crossing two criteria: the level of a firm‟s transparency, measured by its rating published in the Standard and Poor’s Russian Transparency and Disclosure Survey; and existing state control or ownership over the company. Thus, four types of Russian MNCs come out, respectively coined:
. Non Transparent Patriots: these companies are under tight state control, most often in strategic industries linked to natural resources (ex: Rosneft, OMZ);
. Transparent Patriots: refer to companies which somewhat disclose their financial accounts though they are in partial or overall state ownership; but they have already reached a strong position in international markets (ex: Gazprom18, Alrosa, Inter RAO UES);
. Non Transparent Independents: are those companies that are not (or only slightly) controlled by the state but whose corporate governance misses transparency; they often invest abroad through offshore subsidiaries located in tax havens (ex: Evraz, Severstal, Rusal);
. Transparent Independents: such companies are actually privately-owned and their strategies are not clearly influenced by the state or any political considerations (ex: Lukoil, Norilsk Nickel, Vimpelcom, MTS).
The problem is to know how these categories of Russian MNCs evolve in the context of Russian state capitalism19 (Andreff, 2007a & 2009). Before the crisis, Russian MNCs were described as a form of soft power which had replaced the military power of the Russian regime, in particular throughout the “close abroad” (Vahtra, 2005). During the Yeltsin era, the
18 Classifying Gazprom in this category, instead of the previous one, is obviously debatable. 19
Rutland (2008) prefers talking about a corporatist state or a hybrid form of oligarchic state capitalism; but a relative weakening of oligarchs‟ power is to be noticed in the 2000s and again in the wake of the financial crisis.
government was proactive through its privatisation20 programme in creating big privately-owned companies in monopoly or oligopoly situation which swiftly transformed into MNCs. However Russia did not promote OFDI under the Yeltsin presidency. Under the Putin presidency, the Russian state has clearly shifted its objectives toward promoting OFDI, mostly in the service of national strategic goals. Since then Russia conducts a “national champions” policy providing support to companies investing abroad in key industries.
In the 2000s, the government has reinforced its role in the economy through a swifter SOEs‟ expansion and partial re-nationalisation in some industries. Since 2001, state ownership appeared to be on the rise in Russia and this affected Russian MNCs as well. Public participation in previously privatised Gazprom increased from 38.4% to more than 50%, Gazprom acquired the privately-owned Sibneft while the state-owned Rosneft acquired various assets of the defunct Yukos. State participation in the stock equity of some Russian MNCs and their internationalisation strategy have increasingly been influenced by Russia‟s foreign policy. In addition, in 2007 seven big “state corporations” were launched whose CEOs were appointed directly by the president of the Russian Federation. The most important are Rostekhnologii, Rosnano, Rosatom, Rosoboronexport, and Vneshekonombank (VEB). These corporations are in charge of industrial restructuring through gathering activities into big industrial trusts under public control in aeronautics, shipyards, the nuclear energy, new technologies, and banking. They started up internationalising by acquiring technological assets abroad (Vahtra, 2010) while the pressure of the presidential administration on to them accentuated. They are not far from being MNCs whose strategies purely serve both a domestic policy of industrial modernising and Russia‟s foreign policy.
Moreover, SOEs have widely participated to hostile raids over privately-owned companies at the Moscow stock exchange; Gazprom and primarily Rosneft have acquired the assets owned by Yukos and Samaraneftegaz. In 2008, when Dmitry Medvedev, a former CEO of Gazprom, was elected President of the Russian Federation, and Igor Sechin, a former CEO of Rosneft, was appointed Deputy Prime Minister, the relationships between the government and its state-owned MNCs tightened a lot. The dividing line between government and business became totally blurred, more than at any time since the dawn of transition. The weakening political influence of oligarchs since the Yukos case and the government taking the big
20
Including as a result of the infamous and controversial scheme – even criticised by the World Bank – of loans for shares privatisation in 1996 which immediately came out with a phase of oligarchic capitalism in Russia (Andreff, 2005; Hedlund, 2001). These oligarchs are still today at the head of several significant Russian MNCs: Basic Element (Oleg Deripaska), Renova (Viktor Vekselberg), Alfa Group (Mikhaïl Friedman), Interros (Vladimir Potanin), Sistema (Vladimir Evtuchenkov) and so on (Kuznetsov, 2007).