HAL Id: halshs-00542235
https://halshs.archives-ouvertes.fr/halshs-00542235
Submitted on 2 Dec 2010
HAL is a multi-disciplinary open access archive for the deposit and dissemination of sci-entific research documents, whether they are pub-lished or not. The documents may come from teaching and research institutions in France or
L’archive ouverte pluridisciplinaire HAL, est destinée au dépôt et à la diffusion de documents scientifiques de niveau recherche, publiés ou non, émanant des établissements d’enseignement et de recherche français ou étrangers, des laboratoires
Untouchability And Public Infrastructure
Catherine Bros, Mathieu Couttenier
To cite this version:
Catherine Bros, Mathieu Couttenier. Untouchability And Public Infrastructure. 2010. �halshs-00542235�
Documents de Travail du
Centre d’Economie de la Sorbonne
Untouchability And Public Infrastructure
Catherine B
ROS, Mathieu C
OUTTENIERUntouchability And Public Infrastructure
DRAFT
CATHERINE BROS∗
Université Paris 1 Sorbonne - CES Centre de Sciences Humaines - Delhi
MATHIEU COUTTENIER†
Université Paris 1 Sorbonne - CES
Abstract
Caste rules prohibit the sharing of water between castes as a contact made by an untouchable with water ritually taints the source. Despite untouchability practices being outlawed by the Constitution of India, they are still vigorous and violently enforced. This is what is investigated in this article. The aim is to evidence a relationship between the number of acts of violence against untouchables and the way water is distributed. Our results show that, the more individual the source, the less scope there is for potential ritual pollution and hence, the lower the number of violent acts against untouchables. This is the first analysis, to the best of our knowledge, that quantifies and evidences the enforcement of untouchability rules with regard to water distribution. This paper underlines that water improvement programs have the nice side effect of alleviating caste based violence on top of improving sanitation.
Keywords: Castes, India, Water Distribution JEL: K42, J15, H4
∗
Contact information: Catherine Bros, Maison des Sciences Economiques, 106-112 Boulevard de l’Hopital, 75013 Paris. e-mail: [email protected]
†
Contact information: Mathieu Couttenier, Maison des Sciences Economiques, 106-112 Boulevard de l’Hopital, 75013 Paris. e-mail: [email protected]
Untouchability is abolished and its practice in any form is forbidden. The enforcement of any disability arising out of "Untouchability" shall be an offence punishable in accordance with the law Constitution of India; Fundamental Rights; Article 17 The State shall promote with special care the educational and economic interest of the weaker sections of the people and, in particular,of the Scheduled Castes and the Scheduled Tribes, and shall protect them from social injustice and all form of exploitation Constitution of India; Directive Principles of State Policy; Article 46
1
Introduction
The Constitution of India that came into force in 1949, three years after independence outlawed caste based discrimination and abolished untouchability that has been on for centuries in India. The caste sys-tem forbids contacts with lower castes, and has resulted in practices referred to as untouchability, while the so stigmatized low castes members are called untouchables that encompass both scheduled castes and schedules tribes (hereafter "SCs" and "STs"). The Constitution, on which the Indian legal system rests, has placed on the State the responsibility for improving the welfare of untouchables. For more than 60 years, Indian governments have spared no effort to design and implement policies dedicated to SCs and STs, such as the controverted reservation of administrative positions, parliamentary and assembly seats and access to universities, in accordance with the 46th article of the Directive Principles of State Policy that enounces that "the State shall promote with special care the educational and economic interest of the weaker sections of the people and, in particular, of the Scheduled Castes and the Scheduled Tribes, and shall protect them from social injustice and all form of exploitation". Policies directed at SCs and STs have mainly focussed, besides reservations, on improving access to education and poverty allevia-tion programs in the forms of grants and credit. Yet, these domains are not the sole where SCs and STs are at a strong disadvantage because of their caste membership. They have been often denied access to public infrastructure on the ground that they are untouchables. Although some efforts have been made to improve SCs and STs access to common infrastructures such as roads, water sources or electricity, evidence show that universal and equal access to public goods is far from being achieved (Anderson (2007), Tiwary (2006)) and that efficient policies in this area have been too few. This situation does not only arise from unequal wealth distribution across castes but also from caste based discrimination. For instance, Ghanshyam et al. (2006) presents the results from a survey conducted in 2001-2002, in 565 villages of 11 states and show that, in nearly half of the surveyed villages, untouchables were denied access to water facilities. In 28% of them they were denied entry into police stations and in 18% access to
public roads or entry to primary health centers. Indeed, caste prescriptions prohibit the sharing of some common resources, the most salient example being the sharing of water. The Constitution of India, rec-ognized this issue as its 15th article of the Fundamental rights states that "no citizen shall, on grounds of religion, race, caste, sex, place of birth or any of them, be subject to any disability, liability, restriction or condition with regard to (a) access to shops, public restaurants, hotels and places of public entertainment; or (b) the use of wells, tanks, bathing ghats, roads and places of public resort maintained wholly or partly out of State funds or dedicated to the use of the general public [...]".
The aim of this article is to put the emphasis on the role played by the mode of water distribution, either collective or individualized on castes relationships and practices of untouchability. It is a well known fact to anthropologists that willingness to accept water from another caste member is an indicator of castes relationships1. In the Indian sociocultural context, water plays a specific role as a measure of social distance as explained in a later section. As an example, Indian local newspapers abound with stories of untouchables being beaten up for using higher caste wells. Our results, produced from a new database on acts of violence against SCs and STs, show that (i) common water sources, such as tanks and wells increase the proportion of crimes committed against the SCs and STs, (ii) while more individ-ualized sources such as tubewells are effective at reducing the number of violent acts. All these results are robust to the inclusion of many district and states controls. These analysis evidence that practices of untouchability are still vigorous and that governments may be effective at alleviating if not the causes at least the symptoms of social tensions by intensifying its public spending program in water access im-provements. This is, to the best of our knowledge, the first large scale attempt to quantify and evidence the phenomenon.
This article is an extension of the literature about the effect of social fragmentation on the provision of public goods and on conflicts. Previous works have found that high levels of social fragmentation do im-pair public goods provision (Alesina et al., 1999; Banerjee and Somanathan, 2001; Banerjee et al., 2005; Dayton-Johnson, 2000; Khwaja, 2009; Miguel and Gugerty, 2005; Bardhan, 2000) or induce conflict (Collier, 2001; Montalvo and Reynal-Querol, 2002, 2005). These studies implicitly rest upon upon the idea that individuals feel a sense of community with members of their groups and perceive antagonisms with outsiders. These two features are more clearly laid out in the design of the polarization measure by Esteban and Ray (1994). The now popular polarization index includes a sense of group identification that depends on the population frequency within the group and group alienation that can be considered
1
as a measure of intergroup antagonisms. Many experiments in social psychology such as, among others, the ones conducted by Tajfel et al. (1971); Chen and Li (2009) confirm these assumptions: individuals exhibit strong in-group preferences and reluctance towards members of other groups, even when groups are formed arbitrarily. These outcomes are strongly related to the process of social identification. Indi-viduals easily class themselves and other into groups and identify with them.
Such an identification process may induce a wide array of economic outcomes as Akerlof and Kran-ton (2010, 2005, 2000) have shown, ranging from heterogeneity of preferences (Chen and Li, 2009), differences in prices (Ball et al., 2001), or conforming to detrimental stereotypes (Hoff and Pandey, 2006). One of the most obvious implication of social identity is the setting of social norms. However, the social norms researchers mostly focus on govern within groups behaviors. Little stress has been put on norms ruling interactions between groups. Still they have to exist. Even segregation is a norm. Given that public goods give rise to groups interactions, it would seem fair to assume that there has to be norms governing the use of public goods. Therefore social fragmentation does not only possibly impair the provision of public goods, it may also mold the use that is made of these goods. The hypothesis on which our analysis is built is that if norms govern the use of public goods, violations have to be punished. This claim may help at understanding why the sharing of water sources is a ground for conflict in India. Indeed the caste system provides many examples of the arguments above. Undoubtedly caste shapes social identity. The ideology, tradition and texts that support the institution make a large way for rules that should be observed within the caste but also in interacting with other castes. They clearly define with whom one is to share his meal, water, street or to marry. Many of these bans include the sharing of com-mon resources. For instance, each neighborhood is to be homogenous in terms of caste and has to have its own water facility. This echoes the result obtained by Banerjee et al. (2005) that caste fragmentation has a positive effect on the provision of water facilities. The rule governing some inter-caste relationships is the absolute avoidance of contact and is referred to as untouchability as explained in the next section. Our results show that these norms, as far as water sources are concerned, are still vigorous and that they may be violently enforced. Indeed, it will be shown that shared water sources do significantly increase the number of crimes against untouchables. Thereby, the results suggest that social fragmentation may also impact the use of public goods and that the latter may sharpen social divide.
The rest of the paper is structured as follows: section (2) explains why water may be viewed as a source of caste based conflicts. Section (3) show how this study falls in line with research on social identity and its relationship with conflicts and the provision of public goods. Section (4) presents the data and section (5) the empirical strategy, while results are commented in section (6). Section (7) concludes.
2
Ritual Pollution Through Water
2.1 Castes And Ritual Pollution
The concept of ritual pollution governs relations between different castes. It is central to the institution. As Srinivas (1974) puts it: "every type of inter-caste relation is governed by the concept of pollution. Contact of any kind, touching, dining, sex and other relations between castes which are structurally distant results in the higher of the two castes being polluted [...] Where contact does result result in pollution, however, the polluted member of the higher caste has to undergo a purificatory rite in order to be restored to normal ritual status. Such a purificatory rite is fairly simple where the structural dis-tance between the castes is not very great and the type of contact is not serious. Sometimes, as when a Brahmin eats food cooked by an Untouchable, the resultant pollution is so great that he or she has to be excommunicated. Given untouchables very low status, structural distance between untouchables and the rest of the population is probably one of the largest.
As stressed by Srinivas (1974), the degree of pollution does vary depending on the kind of contact. For instance, entering a higher caste courtyard may be considered as an offense while touching an higher caste glass or water results in one of the most extreme degrees of pollution. Food and water are the paramount conveyors of ritual pollution. The geographical setting of traditional villages in India maps the social structure and the ban on caste mingling. The heart of the village is the higher caste district, while untouchables usually live in peripheral hamlets and rarely go through higher castes neighborhoods Beteille (1965). As a consequence, publicly provided goods such as water sources are segregated, each hamlet and thus caste groups having their own sources. Given the ritual pollution attached to untouch-ables and the ban on physical contact with them, they are forbidden access to other castes water sources. It is common knowledge in India that attempts from untouchables to draw water from higher caste wells sparks rural violence. Nevertheless, this prohibition may take different shape depending on the water source.
2.2 Individualized Versus Common Sources
Physical contact of an untouchable with water taints the source. Even the contact of a vessel belonging to an untouchable does alter the ritual purity of the water (Dumont, 1970). Therefore, untouchables are not allowed to access sources where their jars have to be immersed. Out of the four distribution types iden-tified in our data (2001 Census of India), that are wells, tanks, tubewells and taps, this prohibition would chiefly pertain to the first two. These two sources are therefore referred to as common. Of course, we are
not able to rule out the possibility for tanks to have taps, in which case, little pollution would result from an untouchable using it. Nevertheless, we envisage most tanks as open and water collected with vessels. In villages where tubewells have been drilled, experience show that untouchables are not banned from using them, given that such a use would not imply any direct physical contact of either the individual or his vessel with water, but provided that untouchables stand last in lines. Therefore, this sort of water access is considered in our study as individualized, although it is of common use. Tap distribution is obviously considered as an individualized source. It may either be of common usage, in which case the situation resembles that of tubewell or private, in which case it is the utmost individualized water source.
So far, the word individualized, in opposition to common has been used. We must reckon that the choice of the words is not very fortunate. We tried to give a description of what is meant by individualized and common in the precedent paragraph. We could have said that common sources are sensitive to untouchables pollution, while individualized are less sensitive. Nevertheless, for the sake of clarity and conciseness, we carry on with the words common versus individualized, in the hope that what is meant by these words is from now on more clear.
3
Data Description and Construction
3.1 Acts Of Violence
To the best of our knowledge, the database used in this article has not been analyzed before. Data on crimes, both against SCs and STs as well as any crime that falls under the Indian Penal Code ("IPC"), were collected from the National Crime Records Bureau ("NCRB") of the Indian Ministry of Home Affairs at the district level for the year 2001. Data cover 31 states and union territories and spread across 581 districts2. The total number of crimes include murders, rape, kidnapping and abduction, dacoity, robbery, arson, hurt as well as complaints under the 1955 Protection of Civil Rights Act and under the 1989 Prevention of Atrocities Act3. Acts of violence were collected irrespective of the perpetrators. The national average number of crimes against untouchables is 16 per 100,000 individuals but exhibits strong
2Missing data are those of the following union territories: Lakshwadeep, Chandigarh, Dadra and Nagar Haveli, and
Puducherry
3
The Protection of Civil Rights Act and the Prevention of Atrocities Act specifically target discriminatory and humiliating practices, assaults, forced labour and crimes in relationship with untouchability. However, it seems that very few resort to this legislation as it has not been very operative for several reasons ranging from low conviction rates, court partiality and the use of SCs or STs as instruments by crime perpetrators. To be on the safe side, the total number of crimes perpetrated against SCs and STs was retained as more representative
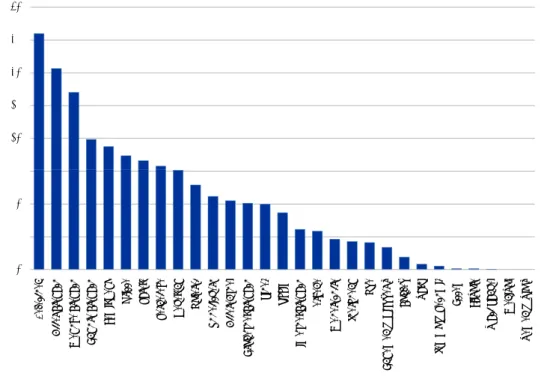
variations across states as shown in the figure 1 below:
Figure 1: State-wise number of crimes against SCs and STs per 100,000 SCs and STs individuals in 2001 15 20 25 30 35 40 0 5 10 15 R a ja st h a n U tt a r P ra d e sh M a d h y a P ra d e sh A n d h ra P ra d e sh Ta m il N a d u O ri ss a K e ra la K a rn a ta k a N a g a la n d G u ja ra t C h h a ti sg a rh U tt a ra n ch a l A ru n a ch a l P ra d e sh B ih a r S ik k im H im a ch a l P ra d e sh H a ry a n a M a h a ra sh tr a Jh a rk h a n d G o a A n d a m a n & N ic o b a r * P u n ja b D e lh i Ja m m u & K a sh m ir A ss a m Tr ip u ra W e st B e n g a l M a n ip u r D a m a n & D iu * M a d h y a P ra d e sh A n d h ra P ra d e sh A ru n a ch a l P ra d e sh H im a ch a l P ra d e sh A n d a m a n & N ic o b a r * Ja m m u & K a sh m ir D a m a n & D iu *
Source NCRB, Ministry of Home Affairs, Government of India
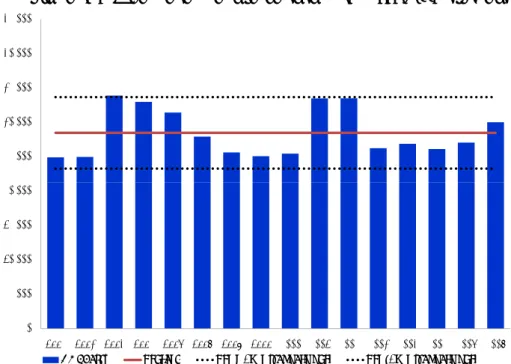
Variations are even larger at the district level ranging from 0 to 199 in the Angul district of Orissa. Although 2001 and 2002 saw an increase in the number of acts of violence committed against untouch-ables , such an increase is not out of proportions as shown by figure 2. Indeed, the number of crimes lies 1.5 standard deviations away from the mean over the 1992-2007 period. Data at the district level were only available for the year 2001 and lack of details for other years prevented us from using panel data.
Arguably, the variations in the number of acts of violence against SCs may come from regions or state specificities such as proneness to violence irrespective of the crimes’ targets. The relationship between the number of crimes against untouchables and the level of crimes in general, if it exists is only quite weak. Correlation coefficient between the number of crimes against untouchables and against the rest of the population is -0.0752 and significant only at the 10% threshold. In order to neutralize the potential inertia of violence and to be on the safe side, the dependent variable used is the percentage of acts of violence that specifically target SCs and STs over the total number of crimes as defined by the Indian Penal Code. It is denoted hereafter crime. Please bear in mind that the number of charges accounted for in the total number of crimes is larger than in the number of crimes against SCs and STs4. The
4
Figure 2: Number of acts of violence against SCs 1992-2007 All India 25 000 30 000 35 000 40 000 45 000 0 5 000 10 000 15 000 20 000 1992 1993 1994 1995 1996 1997 1998 1999 2000 2001 2002 2003 2004 2005 2006 2007
Nb of acts Average Avg + 1.5 x standard dev. Avg -1.5 x standard dev. Nb of acts Average Avg + 1.5 x standard dev. Avg -1.5 x standard dev.
source NCRB, Ministry of Home Affairs, Government of India
crime variable exhibits large variations at the district level ranging from 0 to 0.51. 99 out of the 581 observations are at zero. For positive values, the variable exhibits an average of 0.035 and a standard deviation of 0.05. Total population as well as the percentage of SCs and STs will be introduced as control variables.
Data on crimes against untouchables may underestimate the actual number of acts of violence for three reasons: first, they only account for untouchables that file a complaint which is likely to be only a fraction of the victims. Second, police forces are often thought as being on the side of higher castes. Third, as the survey conducted by Ghanshyam et al. (2006) has shown, untouchables are sometimes denied entry to police offices.
3.2 Access To Water And Other Public Goods
Main Variables
Data on the availability of different public goods come from the 2001 Census of India. The Census gives details at the village and town levels about the presence of taps, tubewells, tanks and wells. Based on this information we have calculated the percentage of the district population that has access to water
"other" category in the composition of the number of crimes against untouchables and due to the presence of a specific legisla-tion related to untouchability.
through taps, tubewells, wells and tanks for 573 districts. Whenever one source was present in a vil-lage, the village population was accounted for as having access to water through such a source. In some instances, two or more sources were mentioned. In this case, village population was ascribed to each source. For instance, if a village of, say 5,000 inhabitants, had water distributed through tap and well and tank, the number of people for that village that have access to tap is 5,000, and the same number is reported for tanks and wells. The numbers are then aggregated at the district level and then divided by the total district’s population. Therefore the percentages of inhabitant that access water through tap, tank, well or tubewell do not sum up to 1. The reason for such a method is to avoid ranking the types of water distribution modes. Indeed, had we taken the best of the three modes, we would have made a judgement call that may not be relevant and increased the correlations among the water distribution modes.
A note of caution is necessary. The Census does not provide information on whether these sources are private or public. For instance, tanks may be of common usage or privately maintained. Given that the Census mainly focuses on public goods, sources have been supposed to be of common usage. Such an assumption might introduce a downward bias in our results since the influence of truly public sources might be spread across both private and public sources.
Despite governments endeavors to improve water access, especially since it has been set as a core target of poverty alleviation programs, heterogeneity remains. Large disparities exist across states as well as between urban and rural regions. For instance, in 2001, only 23% of the households had access to water through either taps or tubewell in Kerala, while this number was 98% in Punjab.
On average 56% of a population’s district access water through tap (standard deviation 0.31), 20% through tanks (standard deviation 0.19), 40% through tubewell (standard deviation 0.29) and 52% through wells (standard deviations 0.31). Although large disparities are found between districts, heterogeneity within states is relatively low as shown by figure 3 displayed on next page. Standard deviations asso-ciated with the four water variables are rather low at the state level especially compared to the overall sample.
As already mentioned, for our results to hold, we need to rule out states’ specificities such as cultural violence or tensed caste relationships. In order to do so, we will resort to state fixed effects. The trouble is that the lack of heterogeneity of the water sources variables within states may weaken the water source effect. If the water source variables were introduced as such in a fixed effect regression, we request a small variations in the percentage of people who have access to the various sources to have an effect on a comparatively large variation in the dependent variable, i.e. the number of crimes. Besides, the potential multi-collinearity arising from the four water source variables may also be an issue.
Figure 3: Districts a v erage access and standard de viations within states and India T ap access T ube well access 0 ,4 0 0 ,6 0 0 ,8 0 1 ,0 0 1 ,2 0 0 ,0 0 0 ,2 0 Ja mm u & K ash mir Him ach al Pra de sh Pu nja b Utt ara nch al Ha ry an a De lh i Ra ja sth an Utt ar Pra de sh Bih ar Sik kim Aru na ch al P ra de sh Na ga la nd Ma nip ur Miz ora m Tri pu ra Me gh ala ya Ass am We st Be ng al Jh ark ha nd Ori ssa Ch ha tis ga rh Ma dh ya P ra de sh Gu ja ra t Da ma n & D iu Ma ha ra sh tra An dh ra P ra de sh Ka rn ata ka Go a Ke ra la Tam il Na du An da ma n & N ico ba r D is tr ic ts s ta n d a rd d e v ia ti o n s w it h in s ta te s S ta te s a v e ra g e D is tr ic ts s ta n d a rd d e v ia ti o n s w it h in I n d ia D is tr ic ts s ta n d a rd d e v ia ti o n s w it h in I n d ia 0 ,4 0 0 ,6 0 0 ,8 0 1 ,0 0 1 ,2 0 0 ,0 0 0 ,2 0 Ja mm u & K ash mir Him ach al Pra de sh Pu nja b Utt ara nch al Ha ry an a De lh i Ra ja sth an Utt ar Pra de sh Bih ar Sik kim Aru na ch al P ra de sh Na ga la nd Ma nip ur Miz ora m Tri pu ra Me gh ala ya Ass am We st Be ng al Jh ark ha nd Ori ssa Ch ha tis ga rh Ma dh ya P ra de sh Gu ja ra t Da ma n & D iu Ma ha ra sh tra An dh ra P ra de sh Ka rn ata ka Go a Ke ra la Tam il Na du An da ma n & N ico ba r D is tr ic ts s ta n d a rd d e v ia ti o n s w it h in s ta te s S ta te s a v e ra g e D is tr ic ts s ta n d a rd d e v ia ti o n s w it h in I n d ia D is tr ic ts s ta n d a rd d e v ia ti o n s w it h in I n d ia T ank access W ell access 0 ,2 0 0 ,3 0 0 ,4 0 0 ,5 0 0 ,6 0 0 ,7 0 0 ,8 0 0 ,0 0 0 ,1 0 Ja mm u & K ash mir Him ach al Pra de sh Pu nja b Utt ara nch al Ha ry an a De lh i Ra ja sth an Utt ar Pra de sh Bih ar Sik kim Aru na ch al P ra de sh Na ga la nd Ma nip ur Miz ora m Tri pu ra Me gh ala ya Ass am We st Be ng al Jh ark ha nd Ori ssa Ch ha tis ga rh Ma dh ya P ra de sh Gu ja ra t Da ma n & D iu Ma ha ra sh tra An dh ra P ra de sh Ka rn ata ka Go a Ke ra la Tam il Na du An da ma n & N ico ba r D is tr ic ts s ta n d a rd d e v ia ti o n s w it h in s ta te s S ta te s a v e ra g e D is tr ic ts s ta n d a rd d e v ia ti o n s w it h in I n d ia D is tr ic ts s ta n d a rd d e v ia ti o n s w it h in I n d ia 0 ,4 0 0 ,6 0 0 ,8 0 1 ,0 0 1 ,2 0 0 ,0 0 0 ,2 0 Ja mm u & K ash mir Him ach al Pra de sh Pu nja b Utt ara nch al Ha ry an a De lh i Ra ja sth an Utt ar Pra de sh Bih ar Sik kim Aru na ch al P ra de sh Na ga la nd Ma nip ur Miz ora m Tri pu ra Me gh ala ya Ass am We st Be ng al Jh ark ha nd Ori ssa Ch ha tis ga rh Ma dh ya P ra de sh Gu ja ra t Da ma n & D iu Ma ha ra sh tra An dh ra P ra de sh Ka rn ata ka Go a Ke ra la Tam il Na du An da ma n & N ico ba r D is tr ic ts s ta n d a rd d e v ia ti o n s w it h in s ta te s S ta te s a v e ra g e D is tr ic ts s ta n d a rd d e v ia ti o n s w it h I n d ia D is tr ic ts s ta n d a rd d e v ia ti o n s w it h I n d ia
Principal Component Analysis
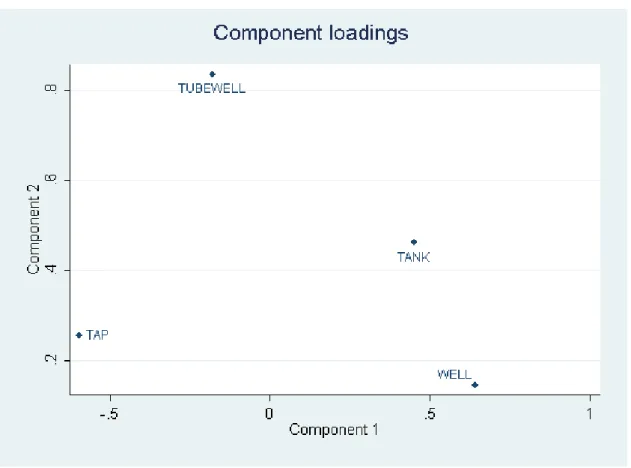
To tackle both the issues of low within states heterogeneity in the water source variables and of potential multi-collinearity, a principal component analysis ("PCA") of the water sources variables is performed. Moreover, reducing the four variables to a single indicator (named "water") measuring the degree of individualization of the source will prove useful. Because PCA maximizes the variance of the original variable space, such a procedure is expected to reintroduce heterogeneity within the variables. The first component derived from the PCA has an Eigenvalue of 1.66 and accounts for 41% of the variance. The Kaiser-Meyer-Olkin measure of sampling adequacy takes on values between 0 and 1 and assesses whether the overall variables have too little in common to warrant a PCA. Cutoff point is 0.49. Lower values would indicate that PCA is not appropriate. This test, in our example is 0.54 which, although low, passes. We chose to retain the first component although the second component Eigenvalue is 1.06 and explains 26% of the variance (the rule of thumb being to retain Eigenvalues whose values are greater than 1). The decision to retain only the first component rests on the scoring coefficients, whose ordering makes more sense in our example. Figure below 4 presents the scoring coefficients for the two components:
The ordering of the variables according to the first component is in adequacy with the concept of common versus individualized sources. The scoring coefficient decreases with the individualization of the source. They are presented in table 1 below.
Table 1: Scoring coefficients
Component 1 Component 2 Tap -0.5945 0.2564 Tubewell -0.1789 0.836 Tank 0.4496 0.4624 Well 0.6422 0.1465
Given the scoring coefficients, the first component may be thought of as an inverse index of source individualization. The ordering of the sources according to the second component makes the interpreta-tion more difficult. As a consequence only the first component is retained. The variables, tap, tubewell, tank and well are then standardized and scoring coefficients are applied according to create the variable water according to the following formula:
water = −0.5945 × tap standardized −0.1789 × tubewell standardized +0.4496 × tank standardized +0.6422 × well standardized
As mentioned, given the weights attributed to the variables, the water variable may be thought of as an index of the collectiveness of the variable. The minimum attained by the water variable is -2.74 and occurs when 100% of the population access water through tap and tubewell. Maximum is 3.4 and occurs when 96% of the population access water through wells, 77% through tanks and 5% through taps and tubewells. The variables approximates 0 when access is equally spread between taps, tubewells and tanks, wells.
Other Public Goods
In order to clearly mark the specific role of water access on crimes against untouchables, other measures of access to public goods will be included as control variables such as the percentage of the district population that live in villages that are electrified or connected by paved roads as well as the number of schools per district inhabitant. On average, 88% of the district population live in electrified areas (standard deviation 0.18), 75% in villages or towns connected by road (standard deviation 0.20).
On average a district has 9 primary and 3 middle schools per 100 inhabitants (standard deviation are 0.06 and 0.02 respectively).
3.3 Polarization
In order to control for potential antagonisms between castes, a polarization index has been calculated following Montalvo and Reynal-Querol (2002) as:
P =
N
P
i
πi1+απj
where πi is the population’s share of the ith group or caste among N . α is a parameter that may be
considered as polarization’s sensitivity. It measures the sensitivity of the index to a shift from a low polarized society to highly polarized one. For α = 0, the polarization index comes down to the standard factionalization index that measures the probability that two randomly chosen individuals belong to the same group. The fractionalization index increases with the number of groups and is maximized at the uniform population distribution over these groups. Yet, this situation is not the one where the greatest level of antagonisms will be found. A situation where two large groups face each other is rather more conducive to potential conflicts. Polarization indices account for a such a situation and departs from the standard fractionalisation index by increasing the weights on population frequencies through the parameter α. α is to lie in the [0;1.6] interval to ensure polarization is maximized when population is concentrated on two equally sized groups. The larger α, the larger the increase in the polarization measure when shifting from a low polarized society to a highly polarized one.
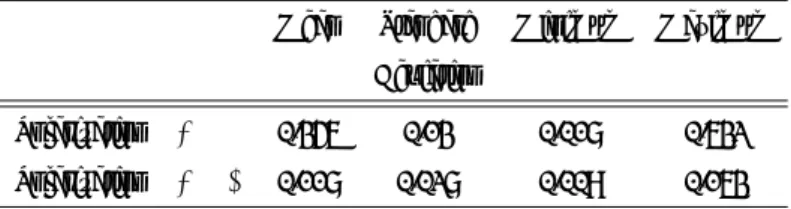
Caste polarization index has been calculated with i={SCs, STs, Others}. We must admit this is quite a rough measure as Indian society is much more fragmented along the lines of caste than merely split into three groups. Besides, intergroup social distance between SCs and STs may be smaller than between SCs and the rest of the population. However, this indicator has the virtue of accounting for the relative size of each group and to capture a potential non linear relationship between crimes against SCs and STs and their relative weights within the population. Summary statistics for the polarization measures are given in the table below:
A similar index of religious polarization is included to account for the fact that caste based antago-nisms may vary depending on the relative size of the different religious denominations, although castes transcend religions. The index of religious polarization has been calculated for α = 0 and α = 1.6.
Table 2: Polarization summary statistics
Mean Standard Minimum Maximum Deviation
Polarization α = 0 0.356 0.13 0.018 0.632 Polarization α = 1.6 0.118 0.028 0.009 0.163
4
Estimation Strategy
4.1 Base Specification
Given that observations are left censored at 0 and that 17% of the observations are at 0, a Tobit model has been used with left censoring.
Let yi∗be the latent variable associated with crimei, where crimeiis the number of crimes targeting SCs
and STs over the total number of crimes in district i, so that
crimei= 0 if yi∗ ≤ 0 yi∗ if yi∗ > 0
yi∗is assumed to have a normal, homoskedastic distribution with zero conditional mean. Let’s note Xik
the vector of explanatory variables, i standing for the district and k serves at identifying the explanatory variable. The intercept has been absorbed into Xikfor notational simplicity. The following equation may
be written
y∗i = βkXik+ εi
εi/Xik ∼ N (0, σ2)
(1)
Since ε/σ is assumed to be normally distributed and independent from Xkit could be written:
P (crimei = 0|Xik) = 1 − Φ(
Xikβk
σ ) (2)
where Φ is the standard normal density function. Let’s note di = 0 if crimei = 0 1 if crimei > 0
Hence the likelihood function for each observation i out of a total of N :
L = N Y i=1 [1 σφ (crimei− Xikβk) σ ] di[1 − Φ(Xikβk σ )] (1−di) (3)
where φ is the standard normal cumulative function. The log-likelihood function for each observation i ln(L) = `i(β, σ) = N X i=1 {di(−lnσ + lnφ( crimei− Xikβk σ )) + (1 − di)ln(1 − Φ( Xikβk σ ))}
The vector of explanatory variables Xikencompasses, in addition to the intercept the following variables
for district i:
W ateri is the component obtained from the PCA as described in section 3.2
ln(population)i is the log of the district’s population
rurali is the percentage of the districts’ population that is rural
literacyi is the literacy rate
castecompositioni is a measure of the social composition by caste. In a first step, this measure
will be the percentage SC and ST in the population together with their quadratic form.
In a second step, it will be represented by polarization indices for α = 0 (i.e. fractionalization) and α = 1.6 (i.e. the highest possible polarization) religiouscompositioni is the religious polarization index for α = 0 and α = 1.6
Equation 1 may then be written in full as
yi∗=β0+ β1wateri+ β2ln(population)i+ β3rurali+ β4literacyi
+ β5castecompositioni+ β6religiouscompositioni+ εi
εi∼ N (0, σ2)
(4)
Naturally, water is the variable of interest and the lower the index, the more districts inhabitants access water from individualized sources. The higher the index, the more common is the access to water. β1 is therefore anticipated positive given our main assumption: the more common the water source the
higher the number of acts of violence against untouchables.
Other control variables come from the 2001 Census of India. As far as the role of caste composition is concerned, we expect an inverse U shape relationship between the percentage of untouchables and the crime variable in the spirit of polarization. Indeed, literature on polarization Montalvo and Reynal-Querol (2002), Esteban and Ray (1994) show that the highest probability of conflicts occurs when two equally sized group face each other. With respect to the caste polarization measure, a positive relationship is expected for a high α while fractionalization is anticipated to be hardly relevant. Indeed, as already discussed, fractionalization is maximized by an equal distribution of the population on a large number
of groups, a situation which may not necessarily lead to violence5. The role of religious composition is far from obvious. Although caste mainly stems from Hinduism, the institution does transcend religions and is found among Muslims, Christians and, although in a much attenuated way, even in religions that originally rejected the system such as Sikhism or Jainism. Therefore the expected sign is not clear. Nev-ertheless, religious violence is unfortunately not a rare phenomenon in India and may be exacerbated in a polarized context. Religious violence may replace caste based violence in highly religiously polarized environments. This hypothesis would lead us to anticipate a negative effect of religious polarization on caste based violence.
4.2 Potential Endogeneity Issues
4.2.1 Omitted Variables
It is a well known fact that some states in India, such as Rajasthan, Bihar or Uttar Pradesh for instance, are more prone to caste based violence than others. A variety of reason may be invoked such as economic backwardness, local traditions or political representations. Indeed, some parties such as the Bharatiya Janata Party ("BJP") have a reputation for inspiring caste based violence, if not religious confrontations. The Ranvir Sena private militia largely run by upper castes landlords in areas of the state of Bihar is known for its exactions against untouchables. The role of traditions is particularly strong in Rajasthan. All these reasons are potentially correlated with public goods provision such as water distribution. This raises the issue of omitted variables. As far as economic backwardness is concerned, the states 2001 GDPs are introduced as control variables. We had to resort to state indicators, since district level GDPs are notoriously unreliable or nowhere to be found. We also introduce a human development index as of 1991, which more broadly accounts for economic development at the state’s level. Unfortunately, we were not able to control for political representation at the states parliaments. To be on the safe side, state fixed effects are introduced, which, arguably, would capture all the states specificities.
4.2.2 Reverse Causality
The provision of safe water has been given priority in the Constitution of India, with article 47 conferring the duty of providing clean drinking water. What the Census refers to as safe drinking water is water distributed through either taps or tubewells/handpumps. Many programs have been designed and imple-mented to improve water access. We would be faced with reverse causality if these programs were to
5
for an excellent review of why fractionalization is irrelevant to the analysis of conflict, please refer to Montalvo and Reynal-Querol (2005)
take into account the untouchables situation in one way or another. Either programs specifically target regions where untouchables are particularly at a disadvantage or they neglect zones where most caste based conflicts are found. Given that water improvement programs are often part of poverty alleviation programs, the first scenario is the most likely. The 2001 National Human Development Report published by the Indian Planning Commission specifically addresses access by SCs and STs to safe drinking wa-ter and compare them to the rest of the population, thereby showing government’s concerns for these groups. If water improvement programs are to take into account SCs and STs situations, this would be in the sense of favoring them rather than avoiding regions where they are the most at a disadvantage. Thus, if a reverse causality exists it is most likely to be unfavorable to our results and induce a downward bias.
It could be argued that the Indian government policies and programs have put an increasing emphasis on community participation and that such an emphasis may prompt reverse causality. Steps were initi-ated in 1999 to institutionalize community participation in the implementation of rural drinking water supply schemes6. Institutional mechanisms have been put in place at the national, state, district, block and panchayat levels to monitor water access improvement programs. It could be thought that highly vi-olent environments are less likely to show the local cooperation necessary to implement such programs. In this case, the reverse causality would favor our results and introduce an upward bias. We have two main reasons to believe that this is not the case. First, the communities empowerment programs only started a year before data were collected. This probably is not sufficient to change the patterns of water distribution modes to an extent that would greatly affect our results. Second, communities are not the sole actors. Authorities at the district and state levels also have a word to say and as mentioned earlier, it is unlikely that this word will be in disfavor of violent areas.
5
Results
5.1 Base Specification
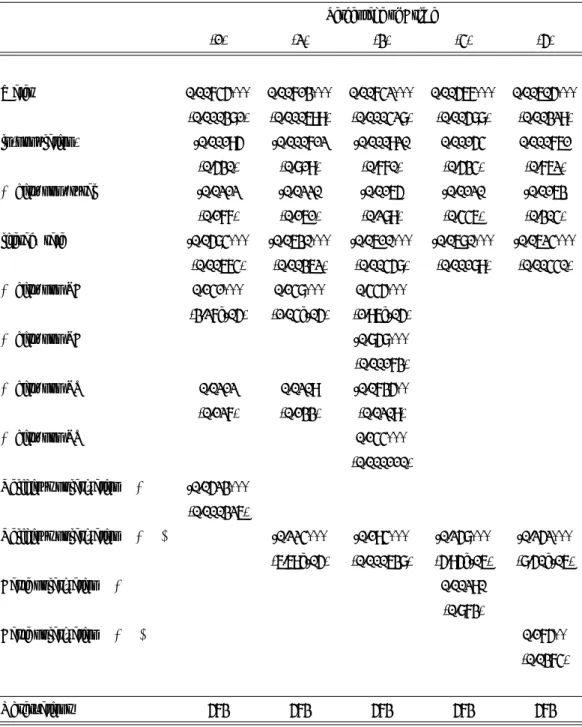
We wish to examine whether water access does impact the number of crimes against untouchables. Table 3 presents the results. As expected the index of water commonality is positive and significant. Shared water sources are significantly associated with a larger proportion of violent acts against untouchables. This effect holds for the various specifications presented. In specification (1) only the percentages of SCs and STs in the district population are entered together with an index of religious fractionalization.
6
Table 3: Water Access Effect on the Percentage of Crimes Percentage of Crime (1) (2) (3) (4) (5) Water 0.00745*** 0.00713*** 0.00742*** 0.00567*** 0.00605*** (0.000381) (0.000699) (0.000428) (0.00588) (0.00329) ln(population) -0.00195 -0.000712 -0.000920 0.00154 0.000761 (0.530) (0.819) (0.770) (0.534) (0.762) % dist. pop. rural -0.0212 -0.0220 -0.0165 -0.0120 -0.0163 (0.177) (0.161) (0.289) (0.446) (0.304) literacy rate -0.0584*** -0.0630*** -0.0610*** -0.0680*** -0.0624***
(0.00674) (0.00362) (0.00458) (0.00189) (0.00440) % dist. pop SC 0.141*** 0.148*** 0.445***
(3.27e-05) (1.04e-05) (1.96e-05)
% dist. pop SC2 -0.858*** (0.00173) % dist. pop ST 0.0212 0.0209 -0.0735** (0.127) (0.133) (0.0209) % dist. pop ST2 0.144*** (0.000110) Religious polarization α = 0 -0.0523*** (0.000326) Religious polarization α = 1.6 -0.224*** -0.194*** -0.258*** -0.252*** (6.69e-05) (0.000638) (5.95e-06) (8.50e-06)
Caste polarization α = 0 0.00290
(0.873)
Caste polarization α = 1.6 0.175**
(0.0374)
Observations 573 573 573 573 573
Robust p-values in parentheses
*** significant at 1%, ** significant at 5%, * significant at 10%
While the percentage of SCs significantly increases the likelihood of caste based violence, the per-centage of STs is not significant. This may be due to a potential non linear relationship between the percentage of untouchables and the number of acts of violence as the literature about conflicts and
polar-ization suggests. Indeed, when the quadratic term for the percentage of STs is introduced in specification (3), a U-shaped relationship is found. STs tend to predominantly live in North Western States such as Mizoram, Tripura, Manipur, Nagaland, Meghalaya and Arunachal Pradesh or in the Andaman and Nico-bar Islands. Tribes represent 52% of the population in these states against 8% for all India. When these states are removed from the sample, both the simple and quadratic form of the percentage of STs lose their significance7. Indeed, in states were they are not so numerous, tribes tend to live in isolated villages and do not mingle much with the rest of the population. This would explain why, when tribal states are removed from the sample, the percentage of STs is found to be irrelevant.
On the other hand, there is an inverted U-shaped relationship between the percentage of SCs and the number of acts of violence against them. SCs are more spread across the country. They represent on av-erage 15% of the district’s population ranging from 0 to 50%, although they account for more than 40% in only 29 of the 581 districts sampled. This inverted U-shaped relationship confirms the results found in the literature that studies the impact of polarization on conflict. The highest probability of conflict occurs when two equally sized groups face each other. Thus a caste polarization index is introduced in lieu of the percentages of SCs and STs in specifications (4) and (5). Not surprisingly the polarization index for α = 0 (i.e. the fractionalization index) is not found significant while it is and positive for α = 1.6, which makes sense given that polarization indices are best suited than the fractionalization index to capture potential antagonisms. The religious polarization index was introduced for the two values of α (specifi-cation (1) versus (2) and next) and both the religious fractionalization and polarization indices are found significant. Given the previous discussion about the impact of polarization versus that of fractionaliza-tion, we chose to retain the religious polarization index for α = 1.6 in subsequent estimations. The negative sign associated with the religious polarization index is difficult to interpret. One explanation could be brought forward, although it is a mere assumption. In religiously polarized contexts, religion based conflicts may overtake caste based conflicts and thus would reduce the number of acts of violence against untouchables. Nevertheless, the positive impact of the water index is robust to the introduction of the polarization indices, meaning that even when the various potentially confrontational contexts are accounted for, water communality remains associated with caste based violence.
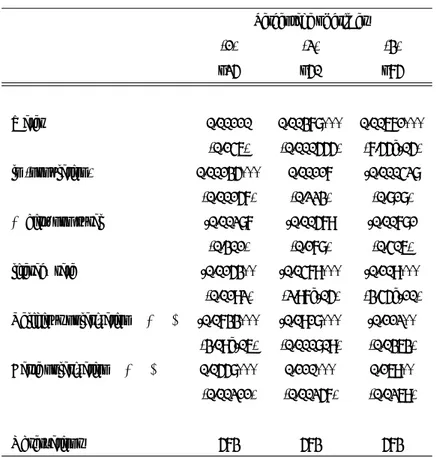
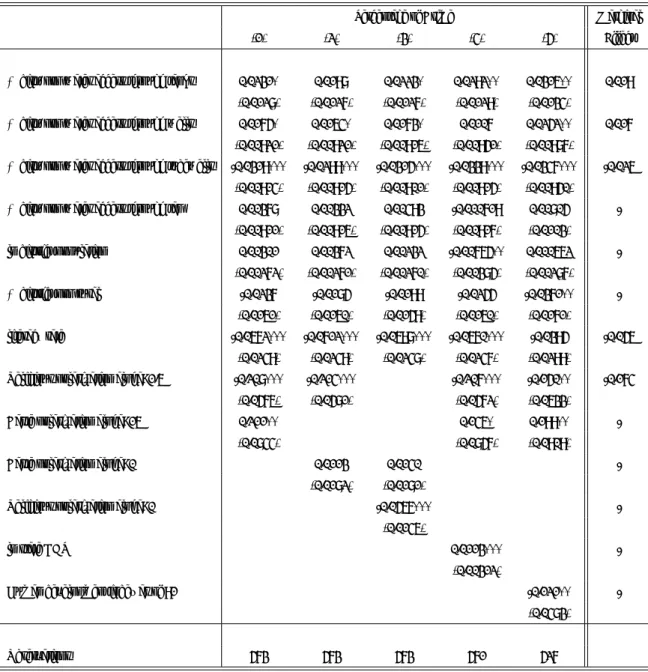
Please recall that the water commonality index, which is the variable of interest was obtained through a PCA in order both to reintroduce heterogeneity in the data and to reduce potential multi-collinearity. Yet, in order to dispel doubts about the genuineness of the procedure, estimations with the four variables included in the PCA are presented in table 7 in appendix. Results show that access through tanks and
7
wells significantly increase the number of acts of violence against untouchables, while access through tubewells significantly decrease this number. Tap access however is not significant. The table shows that increasing by 1 unit the percentage of people that can access water by tubewell may reduce by 3% the percentage of acts of violence targeting SCs and STs.
5.2 State Specificities
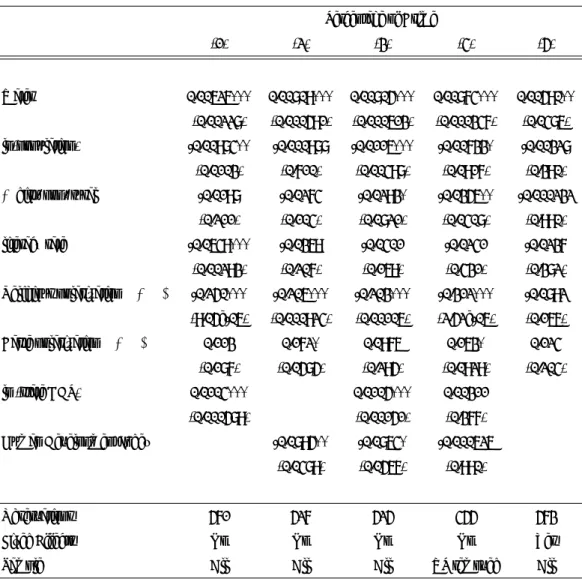
As already mentioned other factors may influence the level of public goods supply such as economic or human development, politics or tradition. Since these factors may be correlated with caste based violence, we need to control for these possibilities. Table 4 below presents the results when the state GDP is entered (specification (1), (3) and (4)), when the Human Development Index (hereafter "HDI") is included (specification (2), (3) and (4)) and state fixed effects (specification (5)). Again, the water commonality index is positive and significant across all specifications. Both the log of the state’s GDP and the HDI are significant, although this mainly stems from the state of Uttar Pradesh, that is one of the wealthiest and most populated state, but also one where caste relationships are tensed to put it mildly. When Uttar Pradesh ("UP") is removed from the sample (specification (4)), both GDP and HDI lose significance. The particularity of this state supports the necessity to account for state specificities. This is what specification (5) does by introducing states fixed effects in the equation. Interestingly, caste polarization loses its significance when states variables are introduced. This probably stems from the fact that the index does not sufficiently vary within states. Indeed within states average standard deviation of the index is 0.019 compared to an average of 0.12. Even when state specificities are taken into account, the more common the water source, the higher the number of acts of violence against untouchables.
Table 4: Water Access Effect - State Controls and Fixed Effects Percentage of Crime (1) (2) (3) (4) (5) Water 0.00626*** 0.00809*** 0.00805*** 0.00874*** 0.00590** (0.00228) (0.000591) (0.000613) (0.000347) (0.0486) ln(population) -0.00984** -0.000988 -0.0116*** -0.00733* -0.00328 (0.0103) (0.710) (0.00498) (0.0917) (0.390) % dist. pop. rural -0.0198 -0.0274 -0.0293* -0.0356** -0.000232
(0.211) (0.104) (0.0821) (0.0408) (0.990) literacy rate -0.0649*** -0.0369 -0.0401 -0.0241 -0.0237 (0.00293) (0.207) (0.169) (0.431) (0.382) Religious polarization α = 1.6 -0.250*** -0.206*** -0.203*** -0.312*** -0.0892 (9.05e-06) (0.000924) (0.00106) (2.52e-06) (0.166) Caste polarization α = 1.6 0.113 0.172* 0.0976 0.163* 0.124 (0.187) (0.0585) (0.295) (0.0929) (0.204) ln (state GDP) 0.0104*** 0.0105*** 0.00311 (0.000589) (0.00151) (0.377) Human Development Index -0.0895** -0.0864* -0.000626
(0.0489) (0.0567) (0.990)
Observations 571 527 525 455 573
Fixed Effects No No No No Yes
Sample All All All UP removed All
Robust p-values in parentheses
*** significant at 1%, ** significant at 5%, * significant at 10%
5.3 Other Public Investments
There are three reasons to introduce public investments in other types of infrastructure in the equation. First, it will underline the unique position enjoyed by water supply. As exposed earlier, public invest-ments in water supply plays a specific role in crimes against untouchables, due to the Indian sociocultural context. Second, although we have done our best to control for all the usual variables that influence pub-lic goods provision such as polarization, wealth or state specificities, introducing other types of pubpub-lic goods may help at controlling for potentially omitted factors. Third, other public investments such as education for instance may be thought of having an incidence on crimes against untouchables. Table 5 below presents the results when other kinds of public investments are introduced without and with state
fixed effects (specifications (1) to (4) and (5) to (8) respectively).
Table 5: Water Access Effect - Including other Infrastructures
Percentage of Crime (1) (2) (3) (4) Water 0.00738*** 0.00685*** 0.00482** 0.00598*** (0.000776) (0.00138) (0.0275) (0.00572) % villages electrified 0.0299* (0.0837)
% villages connect. by road 0.0210 -0.00597 0.0115 (0.169) (0.723) (0.463) Nbr primary school / inhab. -0.239***
(0.000442)
Nbr middle school / inhab. -0.356** (0.0214) Observations 573 573 573 573 Fixed Effects No No No No (5) (6) (7) (8) Water 0.00548* 0.00530* 0.00527* 0.00499* (0.0675) (0.0765) (0.0773) (0.0955) % villages electrified -0.0360 (0.112)
% villages connect. by road -0.0458** -0.0621*** -0.0502** (0.0304) (0.00497) (0.0185) Nbr primary school / inhab. -0.178**
(0.0153)
Nbr middle school / inhab. -0.342 (0.108)
Observations 573 573 573 573
Fixed effects Yes Yes Yes Yes
Robust p-values in parentheses
*** significant at 1%, ** significant at 5%, * significant at 10%
The 1st and 5th specifications introduce the percentage of villages that are electrified in a district. This does not change the sign of coefficients associated with the variable of interest although it becomes significant only at the 10% level when state fixed effects are introduced. The coefficient for electricity is barely significant without fixed effects and loses its significance with fixed effects.
When the percentage of villages accessible by road is introduced, coefficients associated with the water variable remain significant, although only at the 10% threshold with fixed effects. The road variable is significant and negative once states fixed effects are introduced. Presumably, what this variable captures is the district’s level of isolation and backwardness. Therefore, even controlling for this aspect of the district, results concerning water still hold. Please note that the diminished coefficient may stem from a significant correlation of -0.43 between the water index and the percentage of villages accessible by road.
As mentioned, education could be thought of having a negative impact on caste based violence. Pre-sumptive evidence is found with the negative and significant coefficient associated with the population’s literacy rate in previous tables. Indeed, the numbers of primary and middle schools per inhabitant have a negative significant effect on caste based violence, although the effect looses its significance for middle school once fixed effects are introduced. This may be due to the fact that middle schools are less local. They recruit within a larger radius, which dampens the variable’s variance within states. Nevertheless, a reassuring result is that infrastructure in primary education are also effective at reducing violence against SCs and STs. Yet, the results associated with the index of water communality are robust to all these in-clusions, thereby stressing the fact that water distribution plays a role of its own, even when other public investments are also effective at reducing the number of acts of violence against SCs and STs and when state specificities are accounted for.
We have seen that the number of crimes against untouchables is affected by the water distribution mode. This result is robust to various specifications including state specificities and other public invest-ments. Therefore, a nice unexpected side effect of water improvement programs is the reduction in the number of possible bones of contention between castes. A note of caution is necessary. We do not claim that generalizing access to tap water will eradicate caste based violence. This would be presumptuous and absurd. What is claimed is that the government’s efforts to provide safe drinking water (i.e. through taps or tubewells) with the intent of improving public health, have the nice side effect of weakening the role of excuse played by water for caste based violence. No doubt that caste confrontations will occur on other grounds. Yet given the salience of water in caste prohibitions, eliminating such a bone of con-tention is of great interest. This recommendation may appear shortsighted and pointless if the institution
of caste is not fought at its base. We fully concur on this view, yet these water improvement programs would provide some temporary relief to oppressed caste besides improving public sanitation. What our results stress is a side effect of public investments rather than its essential purpose.
5.4 Violence Inertia
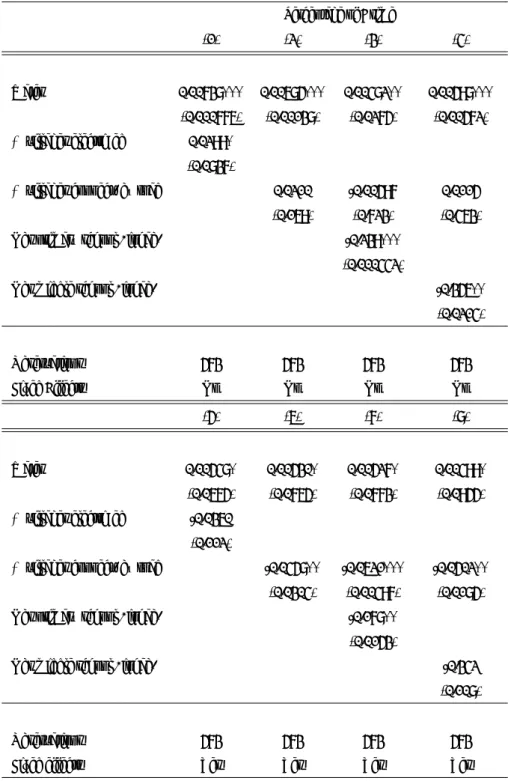
The question we now wish to address is: "does the effect of water supply vary according to different lev-els of violence?". It may very well be the case that the same source of social tensions, water for instance, has a larger impact in an already violent environment. In order to provide some elements, a simultaneous quantile regression has been carried out. This methodology considers the error correlation between dif-ferent quantiles thanks to the bootstrapped variance-covariance matrix. It enables comparison between coefficients in different quantiles (Koenker and Hallock (2001)). The percentage of crimes is split into four quantiles. Results are presented in table 6.
Table 6: Quantiles Regressions
Percentage of crimes (1) (2) (3) q25 q50 q75 Water 0.00110 0.00378*** 0.00671*** (0.146) (0.000555) (7.55e-05) ln (population) 0.00135*** 0.00117 -0.000428 (0.00157) (0.223) (0.818) % dist. pop rural -0.00287 -0.00579 -0.00781
(0.301) (0.178) (0.406) literacy rate -0.0153** -0.0479*** -0.109*** (0.0192) (2.97e-05) (3.45e-10) Religious polarization α = 1.6 -0.0733*** -0.0918*** -0.112** (3.09e-06) (0.000809) (0.0363) Caste polarization α = 1.6 0.0558*** 0.110*** 0.169** (0.00211) (0.00257) (0.0269) Observations 573 573 573
Robust p-values in parentheses
These results clearly evidence that water is only an excuse for caste based confrontations. Indeed, where violence is low, the water distribution mode has no impact. Yet, in already violent environments, the impact of water increases together with the level of violence. Conclusions that may be drawn from this analysis are twofold. First, water really is an excuse for already existing caste based violence and as mentioned earlier, investments in public infrastructure would not eradicate the problem, but rather provide some temporary relief. Second, if a choice has to be made about which zones should be given priority in terms of water access improvements, such a decision would benefit from taking caste based violence as one of the criteria.
6
Conclusions
It has been demonstrated in this paper that violence targeting untouchables is significantly linked to the water distribution mode. These results induce many consequences. First, they show that untouchability practices are still common in India. In compliance with caste prescriptions, untouchables are denied access to common water sources and in accordance with stories of caste based violence recounted in newspapers, this prohibition is violently enforced. One could think that this study is India specific. Yet, this Indian example encourages us to question the role of social norms on public goods usage. So far, the literature has attempted to show the negative impact of social fragmentation on the provision of public goods, through diminished collective action. Yet, the collective action problem may arguably be solved by the creation of intergroup norms, such as the exclusion of a group in our case. In this event, there is not much ground to think that social fragmentation impacts public goods provision. Rather, publicly provided goods and their attached social norms may sharpen social antagonisms and divides.
Another point evoked by the study is the need for policy makers to look into the usage that is made of public goods. Most development programs focus on the level of public goods and do not attach the necessary importance to what use is made of the goods.
Lastly, improving water access does reduce the number of crimes against untouchables. Although water improvement programs are mainly designed out of public health concerns, recognizing that it has a side effect on caste based violence adds an argument for increased efforts in this domain. As already mentioned, it is not claimed that water improvement programs will uproot caste violence and there is little doubt that confrontations between caste will occur on other grounds. Excuses for caste based violence do not lack. Yet, given the salience of water in caste traditions, improving water access may provide temporary relief to oppressed groups on top of improving sanitation.
Appendix
Table 7: Type of Water Access Effect on the Percentage of Crime - individual water access modes
Percentage of Crime Marginal
(1) (2) (3) (4) (5) Effect
% dist. pop water access through tanks 0.0231* 0.0198 0.0223* 0.0292** 0.0316** 0.019
(0.0128) (0.0127) (0.0127) (0.0129) (0.0134)
% dist. pop water access through wells 0.0175* 0.0164* 0.0173* 0.0107 0.0252** 0.017
(0.00921) (0.00921) (0.00916) (0.00951) (0.00987)
% dist. pop water access through tubewells -0.0319*** -0.0299*** -0.0315*** -0.0339*** -0.0347*** -0.026
(0.00914) (0.00915) (0.00901) (0.00915) (0.00950)
% dist. pop water access through tap 0.00378 0.00332 0.00493 -0.000719 0.00805
-(0.00911) (0.00916) (0.00915) (0.00917) (0.0103)
ln district population 0.00301 0.00372 0.00232 -0.00765** 0.000662
-(0.00272) (0.00271) (0.00270) (0.00385) (0.00287)
% district pop rural -0.0237 -0.0185 -0.0199 -0.0255 -0.0371**
-(0.0161) (0.0160) (0.0159) (0.0160) (0.0171)
literacy rate -0.0672*** -0.0712*** -0.0698*** -0.0670*** -0.0395 -0.056
(0.0249) (0.0249) (0.0248) (0.0247) (0.0299)
Religious polarization alpha=1.6 -0.208*** -0.214*** -0.207*** -0.150** -0.174
(0.0576) (0.0581) (0.0572) (0.0633)
Caste polarization alpha=16 0.211** 0.146* 0.199**
-(0.0844) (0.0857) (0.0909)
Caste polarization alpha=0 0.0113 0.0140
-(0.0182) (0.0181)
Religious polarization alpha=0 -0.0567***
-(0.0146)
ln state GDP 0.0113***
-(0.00312)
Human development index as of 91 -0.121**
-(0.0483)
Observations 573 573 573 571 527
Robust standard errors in parentheses *** p<0.01, ** p<0.05, * p<0.1
Table 8: Type of Water Access Effect on the Percentage of Crime Percentage of Crime (1) (2) Water 0.00742*** 0.00874*** (0.000428) (1.49e-07) ln district population -0.000920 -0.000695 (0.770) (0.791)
% district pop rural -0.0165 -0.0185
(0.289) (0.125) % dist. pop SC 0.445*** 0.467*** (1.96e-05) (1.60e-08) % dist. pop SC2 -0.858*** -0.896*** (0.00173) (2.65e-05) % dist. pop ST -0.0735** -0.0331 (0.0209) (0.249) % dist. pop ST2 0.144*** 0.0509 (0.000110) (0.233) literacy rate -0.0610*** -0.0594*** (0.00458) (0.000456)
Religious polarization alpha=1.6 -0.194*** -0.152***
(0.000638) (0.000559)
Observations 573 530
Sample All states Tribal states removed
Robust standard errors in parentheses *** p<0.01, ** p<0.05, * p<0.1
References
Akerlof, G. A. and R. E. Kranton (2000, August). Economics and identity. The Quarterly Journal of Economics 115(3), 715–753.
Akerlof, G. A. and R. E. Kranton (2005, Winter). Identity and the economics of organizations. Journal of Economic Perspectives 19(1), 9–32.
Akerlof, G. A. and R. E. Kranton (2010). Identity Economics: How Our Identities Shape Our Work, Wages, and Well-Being. Princeton University Press.
Alesina, A., R. Baqir, and W. Easterly (1999, November). Public goods and ethnic divisions. The Quarterly Journal of Economics 114(4), 1243–1284.
Anderson, S. (2007). Caste as an impediment to trade; working paper.
Ball, S., C. Eckel, P. J. Grossman, and W. Zame (2001, February). Status in markets. The Quarterly Journal of Economics 116(1), 161–188.
Banerjee, A., L. Iyer, and R. Somanathan (2005, April). History, social divisions, and public goods in rural india. Journal of the European Economic Association 3(2-3), 639–647.
Banerjee, A. and R. Somanathan (2001). Caste, community and collective action: The political economy of public good provision in india. mimeo, Massachusetts Institute of Technology.
Bardhan, P. (2000, July). Irrigation and cooperation: An empirical analysis of 48 irrigation communities in south india. Economic Development and Cultural Change 48(4), 847–65.
Beteille, A. (1965). Caste, Class and Power: Changing Patterns of Stratification in a Tanjore Village. University of California Press.
Beteille, A. (1974). Social Inequality: Selected Readings. Penguin modern sociology readings.
Chen, Y. and S. X. Li (2009, March). Group identity and social preferences. American Economic Review 99(1), 431–57.
Collier, P. (2001, April). Implications of ethnic diversity. Economic Policy 16(32), 127–166.
Dayton-Johnson, J. (2000). Determinants of collective action on the local commons: A model with evidence from mexico. Journal of Development Economics 62, 181–208.
Dumont, L. (1970). Homo Hierarchicus: The Caste System and Its Implications. University of Chicago Press.
Esteban, J.-M. and D. Ray (1994, July). On the measurement of polarization. Econometrica 62(4), 819–851.
Ghanshyam, S., H. Mander, S. Thorat, S. Deshpande, and A. Baviskar (2006). Untouchability in Rural India. Sage Publications, New Delhi.
Hoff, K. and P. Pandey (2006, May). Discrimination, social identity, and durable inequalities. American Economic Review 96(2), 206–211.
Khwaja, A. I. (2009, August). Can good projects succeed in bad communities? Journal of Public Economics 93(7), 899–916.
Koenker, R. and K. F. Hallock (2001). Quantile regression. Journal of Economic Perspectives 15(4), 143–156.
Miguel, E. and M. K. Gugerty (2005, December). Ethnic diversity, social sanctions, and public goods in kenya. Journal of Public Economics 89(11-12), 2325–2368.
Montalvo, J. G. and M. Reynal-Querol (2002, February). Why ethnic fractionalization? polarization, ethnic conflict and growth. Economics working papers, Department of Economics and Business, Universitat Pompeu Fabra.
Montalvo, J. G. and M. Reynal-Querol (2005, June). Ethnic polarization, potential conflict, and civil wars. American Economic Review 95, 796–816.
Srinivas, M. N. (1974). The caste system in india. In Social Inequality: Selected Readings, Chapter Caste as a Form of Social Inequality, pp. 265–272. Penguin modern sociology readings.
Tajfel, H., M. Billig, R. Bundy, and C. Flament (1971). Social categorization and intergroup behaviour. European Journal of Social Psychology 1(2), 149–178.
Tiwary, R. (2006, July). Explanations in resource inequality: Exploring scheduled caste position in water access structure. International Journal of Rural Management 2(1), 85–106.