• 573
A long- standing and central objective within evolutionary biology has been to elucidate and describe mechanisms governing specia-tion (Darwin, 1859; Gottlieb, 1984; Schluter, 2001; Rieseberg and Willis, 2007; Kay and Sargent, 2009; Givnish, 2010; Sobel et al., 2010; Edwards and Donoghue, 2013; Ricklefs, 2014). In this context, one of the key questions raised is why some organismal lineages are more successful (widespread geographically, biome diverse, or
species- rich) than others. An often- espoused hypothesis has been adaptive radiation—the rise of a diversity of ecological roles and role- specific adaptations within a lineage (Givnish, 2015). Others have emphasized the role of dispersals to new areas and subse-quent diversification into new ecological zones (“dispersification” of Moore and Donoghue, 2007). However, definitively evaluating lineage success and adaptive radiations has been elusive due to the
Tracking temporal shifts in area, biomes, and pollinators in
the radiation of Salvia (sages) across continents: leveraging
anchored hybrid enrichment and targeted sequence data
Ricardo Kriebel1, Bryan T. Drew2, Chloe P. Drummond1, Jesús G. González-Gallegos3, Ferhat Celep4, Mohamed M. Mahdjoub5, Jeffrey P. Rose1, Chun-Lei Xiang6, Guo-Xiong Hu7, Jay B. Walker8, Emily M. Lemmon9, Alan R. Lemmon10, and Kenneth J. Sytsma1,11Manuscript received 4 September 2018; revision accepted 31 January 2019.
1 Department of Botany, University of Wisconsin-Madison, Madison, WI 53706, USA
2 Department of Biology, University of Nebraska at Kearney, Kearney, NE 68849, USA
3 CONACYT, Instituto Politécnico Nacional, CIIDIR - Durango, Durango C.P. 34234, Mexico
4 Mehmet Akif Ersoy mah. 269. cad. Urankent Prestij Konutları, C16 Blok, No. 53, Demetevler, Ankara, Turkey
5 Research Laboratory of Ecology and Environment, Department of Environment Biological Sciences, Faculty of Nature and Life Sciences, Université de Bejaia, Targa Ouzemmour, 06000 Bejaia, Algeria
6 Key Laboratory for Plant Diversity and Biogeography of East Asia, Kunming Institute of Botany, Chinese Academy of Sciences, Kunming, Yunnan 650201, China
7 College of Life Sciences, Guizhou University, Guiyang 550025, Guizhou, China
8 Union High School, 6636 S. Mingo Road, Tulsa, OK 74133, USA 9 Department of Biological Science, Florida State University, Tallahassee, FL 32306, USA
10 Department of Scientific Computing, Florida State University, Tallahassee, FL 32306, USA
11 Author for correspondence (e-mail: kjsytsma@wisc.edu) Citation: Kriebel, R., B. T. Drew, C. P. Drummond, J. G. González-Gallegos, F. Celep, M. M. Mahdjoub, J. P. Rose, et al. 2019. Tracking temporal shifts in area, biomes, and pollinators in the radiation of Salvia (sages) across continents: leveraging anchored hybrid enrichment and targeted sequence data. American Journal of Botany 106(4): 573–597. doi:10.1002/ajb2.1268
PREMISE OF THE STUDY: A key question in evolutionary biology is why some clades are more successful by being widespread geographically, biome diverse, or species- rich. To extend understanding of how shifts in area, biomes, and pollinators impact diversification in plants, we examined the relationships of these shifts to diversification across the mega- genus Salvia.
METHODS: A chronogram was developed from a supermatrix of anchored hybrid enrichment genomic data and targeted sequence data for over 500 of the nearly 1000 Salvia species. Ancestral areas and biomes were reconstructed using BioGeoBEARS. Pollinator guilds were scored, ancestral pollinators determined, shifts in pollinator guilds identified, and rates of pollinator switches compared.
KEY RESULTS: A well- resolved phylogenetic backbone of Salvia and updated subgeneric designations are presented. Salvia originated in Southwest Asia in the Oligocene and subsequently dispersed worldwide. Biome shifts are frequent from a likely ancestral lineage utilizing broadleaf and/or coniferous forests and/or arid shrublands. None of the four species diversification shifts are correlated to shifts in biomes. Shifts in pollination system are not correlated to species diversification shifts, except for one hummingbird shift that precedes a major shift in diversification near the crown of New World subgen. Calosphace. Multiple reversals back to bee pollination occurred within this hummingbird clade. CONCLUSIONS: Salvia diversified extensively in different continents, biomes, and with both bee and bird pollinators. The lack of tight correlation of area, biome, and most pollinator shifts to the four documented species diversification shifts points to other important drivers of speciation in Salvia.
KEY WORDS adaptive radiation; BioGeoBEARS; evolution; historical biogeography; hummingbird; Lamiaceae; long-distance dispersal; niche; phylogenomics; species diversification.
American Journal of Botany 106(4): 573–597, 2019; http://www.wileyonlinelibrary.com/journal/AJB © 2019 The Authors. American Journal of Botany is
published by Wiley Periodicals, Inc. on behalf of the Botanical Society of America. This is an open access article under the terms of the Creative Commons Attribution-NonCommercial-NoDerivs License, which permits use and distribution in any medium, provided the original work is properly cited, the use is non-commercial and no modifications or adaptations are made.
myriad factors responsible for speciation and evolutionary success, suboptimal phylogenetic contexts, and lack of analytical and statis-tical frameworks.
Recent and continuing intellectual and computational ad-vancements have facilitated the integration of phylogenetics, bio-geography, ecology, morphometrics, diversification, and character transitions, thus enabling evolutionary biologists to explore and perhaps more rigorously test hypotheses in ways not possible a decade ago. In the process, these advances have transformed the study of plant diversification from a field of oft- speculative narra-tive to a complex discipline that uses sophisticated computational methods to meld, correlate, and interpret results from these dispa-rate fields (e.g., Crisp et al., 2009; Drummond et al., 2012; van der Niet and Johnson, 2012; Beaulieu et al., 2013; Cornwell et al., 2014; Givnish et al., 2014, 2015; Linder et al., 2014; Zanne et al., 2014; Uribe- Convers and Tank, 2015; Lagomarsino et al., 2016; Roalson and Roberts, 2016; Rose et al., 2016; Spalink et al., 2016a, b; Cardillo et al., 2017; Vamosi et al., 2018). Additionally, the underlying as-sumptions and thus interpretation of such correlated findings are now the subject of healthy debate (Maddison and FitzJohn, 2014; Rabosky and Goldberg, 2015; Uyeda et al., 2018).
Salvia L. (sages, Lamiaceae), with a nearly worldwide
distribu-tion (Fig. 1), multiple diversity hotspots, extraordinary evoludistribu-tionary success in terms of both numbers of species and ecological ampli-tude, diverse vegetative and floral forms, and a unique staminal ar-chitecture to promote outcrossing provides an excellent model to address these questions (Claßen- Bockhoff et al., 2003, 2004; Walker et al., 2004, 2015; Walker and Sytsma, 2007; Wester and Claßen- Bockhoff, 2007; Takano and Okada, 2011; Jenks et al., 2012; Li et al., 2013; Wang et al., 2013; Celep et al., 2014; Drew et al., 2017a; Will and Claßen- Bockhoff, 2017). Salvia (sensu Drew et al., 2017a), defined in part by only two stamens with at least some elongation in the anther connective, is sister to a relatively depauperate four- stamen lineage comprising Lepechinia Willd. and Melissa L.; these three genera together form the subtribe Salviinae within the species- rich tribe Mentheae (Walker and Sytsma, 2007; Drew and Sytsma,
2012). The five small, previously recognized genera, Dorystaechas Boiss. & Heldr., Meriandra Benth., Perovskia Kar., Rosmarinus L., and Zhumeria Rech.f. & Wendelbo are embedded within Salvia, share a suite of synapomorphic, morphological traits with Salvia (including having only two stamens with some connective elonga-tion), and have thus been recently included in a recircumscribed
Salvia (Drew et al., 2017a). Breaking up Salvia s.l. into upward of
11 genera, although not all are confirmed monophyletic, has been recently advocated (Will et al., 2015; Will and Claßen- Bockhoff, 2017). We disagree with this approach following the arguments of Drew et al. (2017a) based on phylogenetic, taxonomic, and practi-cal considerations and instead recognize subgenera within a broad
Salvia (Drew et al., 2017a; Hu et al., 2018; Table 1).
Salvia as circumscribed in the broader sense, with nearly 1000
species, is one of the largest genera of flowering plants and displays a remarkable range of morphological, ecological, and geographical variation. The distribution of Salvia is noteworthy not only because the lineage is young and widespread (ca. early Oligocene for stem clade, Drew and Sytsma, 2012), but also because it has diversity hotspots on four continents. Salvia is hyperdiverse from north-ern Mexico through central South America (subgen. Calosphace), but also has centers of diversity in East Asia, as well as Southwest Asia and the Mediterranean region (extending to southern Africa). Perhaps more surprisingly, Salvia has apparently evolved variants of a staminal lever mechanism via an elongated connective in-dependently in each of these three geographic regions (Claßen- Bockhoff et al., 2003, 2004; Walker et al., 2004, 2015; Walker and Sytsma, 2007; Drew et al., 2017a; Hu et al., 2018). In this back-ground of geographic and floral diversification, Salvia has radiated into different biomes and adapted to different pollinators (Wester and Claßen- Bockhoff, 2006, 2007, 2011; Claßen- Bockhoff, 2007; Celep et al., 2014; Walker et al., 2015; Fragoso- Martínez et al., 2018).
We explore patterns of geographical and species diversification in Salvia by leveraging anchored hybrid enrichment genomic data (Buddenhagen et al., 2016 [preprint]; Cardillo et al., 2017; Fragoso- Martínez et al., 2017; Mitchell et al., 2017), along with an emerging
FIGURE 1. Biogeographic, ecological, and floral diversity of Salvia. Dashed lines represent general distribution of Salvia (see Fig. 6 for specific
biogeo-graphical regions). The five broad biome regions of the world occupied by Salvia and used in this study are depicted. Images illustrate some of the range of floral diversity seen in Salvia across different biogeographical regions.
phylogenetic data set and framework for the genus based on tar-geted gene sequencing (e.g., Drew et al., 2017a), fossil evidence for calibrating this phylogeny, online distributional data for most of the species, and a rich pollinator data set. We evaluate correlations between biogeographic change (i.e., dispersals into new areas), transitions into biomes or pollination systems, and shifts in rates of species diversification across this time- calibrated tree. Specifically, we examine the hypothesis that dispersals to new areas are an
important first and over- arching step in subsequent habitat, mor-phological, pollination, and species diversification. Secondarily, we examine the role that shifts in biomes and/or pollination system might have had in subsequent shifts in the ability of Salvia sub-clades to explore and diversify in different ecological niches. For example, we ask: Are shifts to bird pollination frequent and cor-related to shifts in diversification? Are shifts to new biomes repeated across continents in a parallel fashion and correlated to subsequent
TABLE 1. Subgeneric classification of Salvia s.l. used in this study, following in part Drew et al. (2017a) and as updated by Hu et al. (2018). For an alternative classification
system of Salvia s.l. in which up to 11 genera (some not monophyletic by the present study) are recognized, see Will and Claßen- Bockhoff (2017). The “Salvia aegyptiaca clade” of Drew et al. (2017a) is placed informally for now with subgen. Zhumeria. The informal name “Heterosphace” is provided for now to New World sect. Salviastrum, the Old World “Salvia verticillata group” of Will and Claßen- Bockhoff (2017), and their close relatives.
Subgenus
Estimated number of
species Biogeographic distribution Notes
Clade number of Will and Claßen- Bockhoff
(2014)
Staminal type based on Walker and Sytsma (2007)
Audibertia (Benth.) J.B.Walker, B.T.Drew, & K.J.Sytsma
19 Western North America to northern Mexico
See Walker et al. (2015); originally considered sect. Audibertia Epling or as the genus Audibertia Benth. (incorrectly) or the genus Ramona Greene; now comprises two sections (Echinosphace Benth. and Audibertia)
Clade II H, I
Calosphace (Benth.)
Epling 550 North America, Central America, Caribbean, South America
Will and Claßen- Bockhoff (2017) refer to
this as the genus Lasemia Raf. Clade II E, F, G
Dorystaechas (Boiss. & Heldr. ex Benth.) J.B.Walker, B.T.Drew, & J.G.González
1 Endemic to Antalya
region of Turkey See Drew et al. (2017a); originally named as the genus Dorystaechas Boiss. & Heldr. ex Benth.
K
Glutinaria (Raf.) G.X.Hu,
C.L.Xiang, & B.T.Drew 100 East Asia, with outliers in SE Asia, eastern Australia, and central Eurasia
See Hu et al. (2018); previously named as the genus Glutinaria Raf.; now comprises eight named sections. Six distinct stamen types now recognized.
Clade IV N
“Heterosphace” 43 E, S, SW North America, southern Africa and Madagascar, NE Africa, SW Asia, Mediterranean region, Europe
Includes the genus Salviastrum Scheele, Salvia sect. Hemisphace Benth., sect. Heterosphace Benth.; also includes (in part) Hymenosphace Benth. and Eusphace Benth. (see Will and Claßen- Bockhoff [2017])
Clade I A
Meriandra (Benth.) J.B.Walker, B.T.Drew, & J.G.González
2 NE Africa and Indian
Himalayas See Drew et al. (2017a); originally named as the genus Meriandra Benth. J Perovskia (Kar.)
J.B.Walker, B.T.Drew, & J.G.González
8 Central and SW Asia See Drew et al. (2017a); originally
named as the genus Perovskia Kar. D
Rosmarinus (L.) J.B.Walker, B.T.Drew, & J.G.González
3 Mediterranean region see Drew et al. (2017a); originally
named as the genus Rosmarinus L. C
Salvia L. 70 SW Asia, Europe,
Mediterranean region contains the type species for Salvia L., S. officinalis L.; includes sect. Hymenosphace Benth. (in part) and most of sect. Eusphace Benth. (see Will and Claßen- Bockhoff [2017])
Clade I A
Sclarea (Moench) Benth. 120 SW Asia, Europe, Mediterranean region, with outliers in southern Africa
Comprises Salvia sect. Aethiopis Benth. and sect. Plethiosphace Benth.; (see Will and Claßen- Bockhoff [2017])
Clade I B
Zhumeria (Rech. f. & Wendelbo) J.B.Walker, B.T.Drew, & J.G.González
31 Central and SW Asia,
Mediterranean region See Drew et al. (2017a); originally named as the monotypic genus Zhumeria Rech. f. & Wendelbo; we include informally for now other Salvia which were previously placed in genera Pleudia Raf. and Polakia Staf; this study demonstrates that Polakia is not monophyletic.
shifts in pollinator and/or to shifts in species diversification? The analytical design used to evaluate correlates of diversification in
Salvia involves four main steps. The first step entails estimating the
phylogenetic tree and divergence times for Salvia and its subclades. The second step locates significant shifts in species diversification rate (speciation and extinction). The third step identifies episodes of biogeographic dispersal across areas and continents and correlation of such events to species diversification. The fourth step evaluates the role of biome and/or pollinator shifts in species diversification and whether such shifts are correlated to exploration of new geo-graphical areas. We implement a novel, model- based approach to estimate biome transitions through time, taking into account his-torical evidence for the availability of a specific biome through the Neogene and Quaternary.
MATERIALS AND METHODS
Species sampling in Salvia and outgroups
Our aim was to construct an overall nuclear genome phylogeny us-ing both anchored hybrid enrichment (AHE) and nuclear ribosomal DNA (nrDNA) of Salvia where tip relationships are less affected by possible reticulation events involving chloroplast DNA (cpDNA). Although low- copy nuclear genes, nrDNA and cpDNA generally provide congruent relationships among the major lineages in the genus (e.g., Walker and Sytsma, 2007; Drew and Sytsma, 2012; Drew et al., 2017a; Hu et al., 2018), hybridization and/or chloro-plast capture can occur within these well- supported Salvia clades (e.g., Sudarmono, 2007; Walker et al., 2015). We largely followed the taxon sampling in the largest phylogenetic analysis of Salvia to date (Drew et al., 2017a) and enlarged the sampling with additional species from the Old World (Will and Claßen- Bockhoff, 2017; Hu et al., 2018) and subgenus Calosphace (Fragoso- Martínez et al., 2018). Our final nrDNA data set thus had 528 species including 519 (~52%) species of Salvia as well as seven species of Lepechinia and two species of Melissa, which were used as a monophyletic out-group. The complete nrDNA region (ITS/ETS) for 38 species from
Salvia, Lepechinia, and Melissa was obtained via the raw reads from
the anchored hybrid enrichment method (see below).
We subsampled 38 species from this 528 set to obtain sequences for 498 single- copy genes via anchored hybrid enrichment. Those selected included 35 representatives from all major clades of Salvia identified by Drew et al. (2017a); this sampling was done to obtain a well- resolved backbone for the Salvia- wide tree. Three close out-groups (two Lepechinia and one Melissa) were included to complete sampling of the subtribe Salviinae. To verify the relationships of the two outgroup genera Melissa and Lepechinia to Salvia (Drew and Sytsma, 2011, 2012, 2013), we sampled and used two genera (Prunella and Agastache) from the tribe Mentheae as a monophyletic, ultimate outgroup (based on Drew and Sytsma, 2012). Species and subgeneric placements (see Table 1) are provided in Appendices S1 and S2. Anchored hybrid enrichment: library preparation, enrichment, and sequencing
The anchored hybrid enrichment (AHE) method (Lemmon and Lemmon, 2012; Buddenhagen et al., 2016 [preprint]) was used to tar-get 498 moderately conserved, low- copy nuclear loci. DNA was ex-tracted from silica gel- dried or fresh leaf tissue using the DNeasy Plant
Mini Kit (Qiagen, Valencia, CA, USA). DNA concentrations were verified using the Qubit 2.0 Fluorometer (Life Technologies, Eugene, OR, USA). Library preparation and enrichment were performed at the Florida State University Center for Anchored Phylogenomics (www. anchoredphylogeny.com) following the methods of Lemmon et al. (2012) and Prum et al. (2015) as described by Buddenhagen et al. (2016 [preprint]). In summary, DNA was sonicated with a Covaris E220 Focused- ultrasonicator (Woburn, MA, USA) with Covaris microTUBES to obtain ca. 200–800 bp fragments. Libraries were prepared and indexed (8 bp) with a liquid- handling robot (Beckman- Coulter Biomek FXp, Brea, CA, USA), samples were pooled in equal quantities, and each pool was enriched using AHE Angiosperm v.1 kit. After enrichment, the libraries were sequenced on one lane (PE150bp, 48Gb output) of an Illumina HiSeq2500 at the Translational Science Laboratory in the College of Medicine at Florida State University.
After quality filtering using the high- chastity filter in Illumina’s Casava software, overlapping read pairs were merged and sequenc-ing adapters were trimmed followsequenc-ing Rokyta et al. (2012). Reads were then assembled using the quasi- denovo approach described in Hamilton et al. (2016), but with Arabidopsis thaliana (L.) Heynh.,
Billbergia nutans H.Wendl. ex Regel, and Carex lurida Wahlenb.
serving as references for the assembly. Assembled contigs de-rived from fewer than 20 reads were removed to avoid the effects of possible contamination and/or misindexing. The orthology of homologous contigs passing this filter was then assessed using pairwise distances as done by Hamilton et al. (2016). Orthologous sequences at each locus were then aligned using MAFFT (v. 7.023b, Katoh and Standley, 2013) and trimmed and masked using the methods of Hamilton et al. (2016), with MINGOODSITES=15, MINPROPSAME=0.3, and MISSINGALLOWED=38. Alignments were then manually inspected in Geneious R9 (Biomatters Ltd., Aukland, New Zealand; Kearse et al., 2012) and misaligned regions were masked. The final alignments consisted of both target regions and variable flanks for 498 target loci.
Finally, nrDNA (ITS and ETS) was obtained from the raw reads of each of the 38 species (eliminating the two ultimate outgroups) sequenced via AHE. The complete ITS sequence of Salvia hydrangea DC. ex Benth. (KP294355) and the ETS sequence of Salvia namaensis Schinz (KJ584290) were used as references to match and assemble reads in Geneious v7.1.7 (http://www.geneious.com, Kearse et al., 2012). Reads were assembled using an iterative mapping approach in the default Geneious mapper under medium sensitivity. Mapping was conducted for a maximum of 5 iterations. For calculating con-sensus sequences, minimum coverage was set to 2. If coverage was 0, no base was called. Residues in consensus sequences were called based on a minimum of 65% identical residues to account for pa-ralogy; otherwise, ambiguity codes were used. Subsequently, these sequences were aligned using MAFFT with other sequences of ITS and ETS. We concatenated this alignment with an alignment of ITS and ETS from previously sequenced or obtained from GenBank for a total of 538 taxa. GenBank accession information for both AHE and nrDNA are provided in Appendix 2; the aligned data sets for both AHE and nrDNA sequencing are available from the Dryad Digital Repository: https://doi.org/10.5061/dryad.8m40rb0. Construction of the Salvia phylogenetic and temporal framework
To generate a well- resolved backbone topology for Salvia based on AHE sequences, to which all ITS/ETS sequences of 528 species
would ultimately be added, three different maximum likelihood (ML) or Bayesian analyses were conducted. First, both coalescent and concatenated ML approaches were performed on the 40 spe-cies AHE data. Second, only ITS/ETS data for all 528 spespe-cies were analyzed under ML. And third, Bayesian estimates of topology and branching times were done with the 528 species ITS/ETS data set, but including topological prior constraints based on well- supported nodes obtained with the AHE data.
AHE phylogenetic analyses—The concatenated AHE data set was used to estimate a phylogeny under the GTRGAMMA model im-plemented in RAxML v8.1.21 (Stamatakis, 2014; with default pa-rameters), with the GTR model and branch lengths being allowed to vary across loci. One hundred bootstrap replicates were collected to estimate phylogenetic support. In addition, the species tree was es-timated under the coalescent model as implemented by ASTRAL- II (v.4.9.7, Mirarab and Warnow, 2015), using bootstrapped gene trees estimated under the GTRGAMMA model in RAxML v8.1.21 (Stamatakis, 2014).
nrDNA phylogenetic analyses—The nrDNA (ITS/ETS) data set was analyzed with RAxML under the GTRGAMMA model. To ex-plore the robustness of relationships among major clades and place-ment of species within in each clade based solely on nrDNA, we performed an additional RAxML analysis by implementing the “- g” topology constraint parameter in RAxML. The AHE ASTRAL- II tree (only nodes with 100% support) was used as a constraint tree, and all other 480 species were unconstrained.
Bayesian time- calibrated phylogenetic analysis—BEAST 2.4.3 (Bouckaert et al., 2014) in the XSEDE interface of CIPRES (Miller et al., 2010) was used to generate a time- calibrated tree by incor-porating an uncorrelated log- normal clock and both yule and separately birth–death speciation processes. Following previous recommendations (Baele et al., 2013; Condamine et al., 2015), we compared the yule and birth–death (BD) priors by estimating both AICM using the method- of- moments estimator (Baele et al., 2013) and the differences in log marginal likelihoods (and thus log Bayes Factors) using the smoothed harmonic mean estimator (Newton and Raftery, 1994; Suchard et al., 2001) in Tracer v.1.6 (Rambaut et al., 2014) using 1000 bootstrap replicates. BEAUti files were generated with the 528 taxa ITS/ETS nrDNA data set only, as the immense size of the supermatrix data set precluded efficient ex-ploration under the Bayesian framework in BEAST. Because ML analyses of both the AHE and AHE plus nrDNA data sets provided high support for all major clades, we enforced monophyly of clades as tree priors for major backbone (not internal) nodes with 100% bootstrap values in both the AHE coalescent and concatenated trees. The GTR + Γ + I model of sequence evolution was used. Based on the larger time- calibrated phylogeny of subfamily Nepetoideae (Drew and Sytsma, 2012), both the root of the tree (crown of sub-tribe Salviinae or stem of Salvia) and the crown of Salvia were set to normal distributions: offsets of 34 Ma (95% quantile = 32.4–35.6 Ma) and 30 Ma (95% quantile = 28.6–31.4 Ma), respectively. In ad-dition, we employed two published fossil records to calibrate inter-nal nodes with log- normal distributions. Following Lancaster and Kay (2013) who employed the fossil recorded by Mai and Walter (1988), we constrained the MRCA of Salvia officinalis, S. aucheri, and S. fruticosa with an offset of 2.6 Ma, mean of 2.0, and SD of 1.0. Second, we placed late Miocene Salvia pollen from Alaska at the
stem of S. greatae, S. funerea, and S. californica following Emboden (1965) with an offset of 5.3 Ma, mean of 1.0, and SD of 1.5. The shape and size of the fossil pollen grains are very similar to these three species of Salvia subgen. Audibertia sect. Echinospace but not to S. carduacea, the fourth and earlier- diverging species within the section (Walker et al., 2015). The location of these fossil pollen well outside the present distribution of sect. Echinospace supports place-ment of the fossil prior on the stem of the three species.
For each separate analysis using the yule or BD models, we ran four independent analyses of 100,000,000 generations each in BEAST, saving 10,000 trees from each run. This number was necessary to get effective sampling of all parameters as visualized in output log files in Tracer v.1.6 (Rambaut et al., 2014). After re-moving 20% of samples as burn- in, independent runs for the best- fitting model (yule or BD) were combined and a maximum clade- credibility (MCC) tree was constructed using TreeAnnotator v.1.8.4 (Bouckaert et al., 2014). Node heights were based on com-mon ancestor height values rather than the default median height values to avoid generating zero or negative length branches among recently diverged tip species. To examine additional BEAST trees for several downstream analyses (and to test whether results were conservative by being consistent across the most different topolo-gies), we randomly sampled 1000 trees from the posterior proba-bility distribution (PPD). Treespace (Kendall and Colijn, 2016) in R was used to identify 10 clusters comprising distinct groves of trees in this subset of PPD trees. The median tree of each of the 10 clus-ters was identified and saved.
Diversification shifts in Salvia
We used BAMM v2.5 (Bayesian Analysis of Macroevolutionary Mixtures; Rabosky, 2014, 2018; Rabosky et al., 2014, 2017) to esti-mate rates of speciation (λ), extinction (μ), and net diversification (r) within Salvia. Our specific focus was to identify clades exhibit-ing significant rate shifts in speciation and to conduct rate- through- time analysis of these rates. Although we strived for even coverage across Salvia in our taxa sampling, the incomplete sampling using 519 of a total 989 Salvia species (our latest count) required the use of a sampling probability file in which 12 clades (terminals) were identified to which all unsampled species could reliably be placed. The three largest clades, representing radiations in Asia, in the Mediterranean/Southwest Asian/African region, and in Central to South America, included 51%, 27%, and 36% of the species, re-spectively. Likewise, two additional terminals were constructed for
Melissa and Lepechinia in which all unsampled outgroup species
were placed in each. BAMM models the placements of unsampled species within their designated clade using the existing topology and branch lengths. Terminals, proportion of extant species sam-pled for each, and justification for clade numbers are provided in Appendix S3.
Priors for BAMM were generated using the package BAMMtools v.2.1 (Rabosky et al., 2014) for the R statistical environment (R Core Team, 2018). BAMM analyses were run for 500 million generations sampling every 100,000 generations. Metropolis coupled MCMC was implemented with four Markov chains and the numbers of gen-erations to propose a chain swap set to 1000. The expected number of shifts was set to 50 given the size of the phylogeny. Separate runs with 1, 4, or 10 expected shifts were conducted to test the sensi-tivity of the resulting shifts to this prior. After removing 20% of the samples from the posterior distribution sampled by BAMM,
we analyzed the output using BAMMtools and computed the 95% credible rate shift configurations. We also estimated the rate shift configuration with the maximum a posteriori probability as the sin-gle best shift configuration. We explored clade specific evolutionary rates by obtaining rates- through- time plots (λ, μ, and r) for Salvia subclades of interest. All these diversification analyses were done on the BEAST MCC tree as well as the as the 10 grove trees selected from the PPD tree distribution.
Ancestral range estimation in Salvia
Ancestral range estimation (ARE) for Salvia was done for the MCC tree and each of the 10 grove trees using the DEC (Ree and Smith, 2008) and DECj models in BioGeoBEARS (Matzke, 2013, 2014) in R v3.3.1. The “j” or jump parameter allows for a daughter lineage to immediately occupy via long- distance dispersal a new area that is different from the parental lineage. The jump parameter has been re-cently questioned, as well as the statistical (nested) relationship be-tween DEC and DECj (Ree and Sanmartín, 2018). We explored both models to evaluate any major differences in the inferred biogeo-graphical history of Salvia. We identified seven broad geographic ar-eas (see Figs. 1 and 7) important in the context of the distributions of
Salvia: (1) North America, including northern and central Mexico;
(2) South America, including southern Mexico, Central America, and the West Indies; (3) western Eurasia, including Europe, Mediterranean Africa; (4) Southwest Asia, from Turkey, Syria, Israel east through Iran, Pakistan, and to Bhutan; (5) northeastern Africa and southern Arabia; (6) southern Africa including Madagascar; and (7) east Asia, including the area from India, Southeast Asia, into eastern Australia for one species, S. plebeia R.Br.
The floristic patterns involving the horn of Africa, Arabia, and Southwest Asia (including the Irano- Turanian region) are compli-cated (Hedge, 1957, 1986; de Winter, 1971; Thulin, 1991; Jurgens, 1997; Salvo et al., 2011; Djamali et al., 2012), and thus we followed the arguments for dividing this region as in Manafzadeh et al. (2014, 2017). The separation between Mediterranean Europe and northern Africa from Southwest Asia is particularly contentious, especially in the context of Asia Minor (Anatolia) and the Palestine region. Thus, we ran parallel analyses with different definitions of western Eurasia and Southwest Asia; species occurring in the area comprising Turkey south to Israel were alternatively placed in one or the other of these two broad areas. Similarly, separation of the North, Central, and South American regions for Salvia is problem-atic. Salvia is especially diverse in Mexico and is represented there by Madrean- pine oak, subtropical, and tropical lineages. Broad flo-ristic (and faunistic) areas meet in southern Mexico, and thus we followed the emerging biogeographic consensus in placing most of Mexico north of the Isthmus of Tehuantepec with North America (Axelrod, 1958, Axelrod, 1975; Graham, 1999; Morrone, 2010; Escalante and Morrone, 2013; Berger et al., 2016). Areas south of the Isthmus of Tehuantepec in Mexico, Central America, and the Caribbean were placed with South America.
Species distributions were obtained from primary literature, previous analyses of groups within Salvia, and from the Global Biodiversity Information Facility (GBIF; www.gbif.org) as nec-essary following established protocols to ensure accurate species distributions from this data depository (Maldonado et al., 2015; Spalink et al., 2016a, b). Species scoring for area is provided in Appendix S2. We allowed the inferred ancestors to occupy up to four areas based on the fact that no extant species occupies more
than three, and max=4 then would be very conservative. Dispersal probabilities between allowed pairs of areas were specified for three separate time slices (37–15 Ma, 15–5 Ma, 5–0 Ma) to factor in the timing of possible important geological events affecting Salvia dis-persal (e.g., closure of the Mediterranean Sea, northern hemisphere land bridges, formation of the Panamanian Isthmus, separation of eastern and western Asia). Many of these events have been mod-eled specifically in DEC and DECj analyses elsewhere (e.g., Buerki et al., 2011; Drew and Sytsma, 2012; Sulman et al., 2013; Berger et al., 2016; Cardinal- McTeague et al., 2016; Spalink et al., 2016a, b). We conducted 100 biogeographical stochastic mapping (BSM) replicates in BioGeoBEARS (Matzke, 2016; Dupin et al., 2017) on the MCC tree and on each of the 10 grove trees. We summarized the probability of each class of cladogenetic event (vicariance, sym-patry, subset- symsym-patry, and jump dispersals) given the DEC or DECj model and distribution data across the 11 trees. Additional details regarding model development, temporal stratification, and dispersal probabilities among the geographical regions through time are provided in Appendix S4.
Biome shifts in Salvia
In addition to shifts in biogeographic areas, we were also interested in assessing the level of shifts between biome types as Salvia diver-sified in time and space. Specifically, are biome shifts more frequent following dispersal between areas (or continents), are biome shifts correlated with increased species diversification, and are shifts in pollinators linked to shifts in biomes? To accomplish this, we used the 14- biome framework of Olson et al. (2001) that are delimited within eight biogeographical realms (www.worldwildlife.org/wild-world). Species were scored for one or more biomes by extracting the biome type corresponding to the latitude/longitude coordinates of specimens obtained in GBIF or, when absent in GBIF, with geo-referenced localities based on type specimens and the literature. The extraction of biomes included representation in all but the tundra biome, and both the boreal forest (including taiga) as well as the mangrove biomes were represented by only six and two spe-cies, respectively. To reduce the number of polymorphic taxa for biome type, we removed these three poorly represented biomes. We also combined the categories of tropical and temperate coniferous forest to a broader coniferous forest biome, tropical and temper-ate broadleaf forest to broadleaf forest, the four grassland types into one grassland biome, and left the desert/xeric shrublands and Mediterranean forests/ woodlands scrub biomes as demarcated. The final data set thus included five combined biome types (Fig. 1): arid/ desert, Mediterranean, grassland, broadleaf forest, and coniferous forest (biome coding for each species is provided in Appendix S2).
We evaluated biome evolution in a phylogenetic context by using BioGeoBEARS to implement a Markov- k (Mk) model for a standard unordered character (i.e., biome) model with equal rates character evolution (but this model extended as described below). We used BAYAREALIKE with a (range- switching) implemented, but with d (anagenetic dispersal) and e (anagenetic extinction) = 0 (as well as both vicariance and jump dispersals parameters = 0, as default in BAYAREALIKE). We extended the biome shift model in BAYAREALIKE with two novel approaches. First, we used a “man-ual biome switching probability” file to allow greater probability of shifts between specific biome types (as done between adjacent areas with ARE). We used the logic that biome types shared by the same species should have higher transition probabilities. We constructed
a Jaccard’s similarity coefficient (Jaccard, 1912) matrix for all bi-omes based on shared presence among the 528 species sampled and scaled these values so that the highest value was given a probability of 1.0 in the “manual biome switching probability” file. Thus, we mimic the “all rates different” (but maintaining symmetry) model as implemented in other packages (e.g., ace).
Second, we incorporated time slices and a “stratified” occur-rence file to permit the rise of biomes only in specific time slices— Mediterranean biome from 4 Ma and grassland biome from 14 Ma to present. The Mediterranean climate and biomes of Europe and of California are known to have arisen only recently in the Pliocene or Pleistocene (Suc, 1984; Ackerly, 2009), and this ap-proach ensures that shifts to biomes do not occur until more recent time intervals when there is geological evidence for their presence. The Mediterranean fynbos climate of South Africa likely initiated at the end of the Miocene, although fynbos plant clades have been dated as recent (Pliocene) to older (early to mid- Miocene) radia-tions (e.g., Linder, 2005; Verboom et al., 2009; Linder and Verboom, 2015). Because we demonstrate that southern African Salvia fyn-bos lineages are Pliocene in age, using a 4 Ma stratification for all Mediterranean biomes is appropriate. Likewise, northern hemi-sphere grasslands were constrained to the late Tertiary as that bi-ome only became dominant following the mid- Miocene climatic optimum (Anderson, 2006; Edwards et al., 2010; Strömberg, 2011). Southern African grasslands also have been suggested to be older than northern hemisphere counterparts with early origins from openings in broadleaf forests during the Oligocene and again in the late Miocene (Linder and Verboom, 2015). Thus, our mid- Miocene stratification date (14 Ma) may be too conservative generally, but should be appropriate for Salvia as all southern African lineages are later radiating. To verify the use of these two biome constraints in the context of southern Africa, we compared the results to an anal-ysis without the biome stratifications enforced.
All biome shift analyses were done with the MCC tree as well as with the 10 grove trees obtained from the PP set. As BSM under the BAYAREALIKE (pure a+, d=e=0) models is still not fully imple-mented (Dupin et al., 2017), variation in biome shifts was assessed by comparing biome shifts across all 11 trees. Summary statistics of biome shifts through time were obtained across 11 trees by estimat-ing the biome with the highest probability at each node of the phy-logeny and counting the number of times switches from one biome to another in adjacent nodes. Additional details regarding model development, temporal stratification, and shift probabilities among the biomes through time are provided in Appendix S5.
Pollinator shifts in Salvia
We reconstructed the pollinators of Salvia onto the 11 trees used in the biogeographic analyses with maximum- likelihood by calculat-ing the marginal ancestral states for all nodes of each phylogeny with the rayDISC function of the R package corHMM (Beaulieu et al., 2013, 2017). This function allows for taxa to be coded polymorphic, which was ideal with our data set that includes several undetermined species. Pollinators were coded from the literature as being bee- or bird- pollinated, or polymorphic for the two (Wester and Claßen- Bockhoff, 2007, 2011); pollinator coding is provided in Appendix S2. Before the reconstructions, a series of evolutionary models for discrete traits were tested using the fitMK function of the R library phytools (Revell, 2012) and compared with the Akaike information criterion (AIC). These were the equal rates (ER), symmetric (SYM),
all rates different (ARD), and two ordered models. The method of Yang (2006) was used to fix the root state probabilities. In this ap-proach, the estimated transition rates are used to set the weights at the root (Yang, 2006; Beaulieu et al., 2013, 2017). To better estimate the number of transitions in pollinator type at different time inter-vals, we increased the random sampling of trees to 100 from the PP, and then discretized the node states using a 50% threshold.
RESULTS
Anchored hybrid enrichment of nuclear loci provides strong support among major clades of Salvia
The AHE sequencing generated an average of 453 gene loci per ac-cession (of 498 screened loci) at an average length of 623 bp. Across all 40 species, 438 loci were shared, and these were used for all sub-sequent analyses. The coalescent species tree based on ASTRAL- II (Fig. 2) is 100% supported at most nodes (branches with asterisks in Fig. 2 are used as prior constraints in subsequent BEAST analyses). Only four nodes within Salvia are not fully supported. Additionally, the sister relationship of Melissa and Lepechinia is weakly sup-ported. The RAxML bootstrap tree of concatenated AHE data is identical to the coalescent tree except in the weakly supported placement of Melissa sister to Lepechinia + Salvia (see Appendix S6). Thus, these analyses indicate strong relationships among the major clades within Salvia.
Salvia comprises three well- supported major clades. These three
clades include 11 named subgenera (see Discussion), which are provided in Table 1 and Fig. 2 (and subsequent figures and tables) to facilitate discussion of results. The first clade, including subgen.
Salvia, Sclarea, and “Heterosphace” (informal designation for this
group), comprises largely southwestern Asian and Mediterranean species, but also species from south and eastern Africa, Madagascar, and the eastern to southwestern United States and adjacent Mexico. Subgenera Perovskia and Rosmarinus (both formerly recognized at the generic level) represent early diverging lineages of this first clade. The second clade (subgen. Glutinaria) is almost exclusively eastern Asian with several species more broadly distributed into central and western Eurasia. The third clade, sister to the Asian subgen.
Glutinaria, comprises the two Old World subgen. Zhumeria (and
close relatives not currently placed in a subgenus) and Dorystaechas (Old World subgen. Meriandra not sampled here) and the exclu-sively New World subgen. Audibertia (western North America) and
Calosphace (primarily Mexico to South America).
nrDNA data with AHE- supported monophyletic clade priors in BEAST generate the most complete phylogenetic framework to date for Salvia
The RAxML likelihood tree based only on nrDNA (ITS and ETS) for 528 species is similar, but not entirely congruent with the broad re-lationships provided by AHE nuclear loci (Appendix S7). The three main clades in Salvia are maintained although relationships within each differ to some extent, although none of these differences are well supported. Notably in the first clade, subgen. Rosmarinus is sister to the remainder and subgen. Salvia is sister to subgen. “Heterosphace” + Sclarea. The RAxML likelihood trees based on nrDNA data and invoking the “- g” AHE topology constraint (Appendix S7) and on the supermatrix of nrDNA and AHE data (tree not shown), however,
are similar to each other and recover all the major clades seen with the AHE data alone (Fig. 2). Importantly, in each of the three analy-ses, all 528 species are placed consistently within one of the 11 sub-generic clades. Additionally, subgen. Zhumeria clearly comprises the former and recently recognized genera Polakia and Pleudia in addition to Zhumeria, this clade distributed from Southwest Asia, northeast Africa and Arabia, to the Mediterranean.
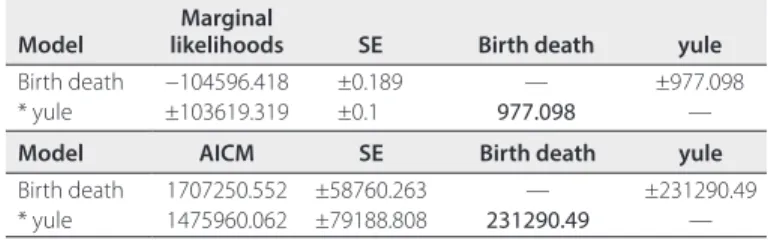
Based on these results, the nrDNA data set for 528 species was used to generate BEAST trees with topological constraints sup-ported by AHE analyses added as priors. The yule model had a larger marginal likelihood and lower AICM value compared to the birth–death model (Table 2), and thus had a better fit with the data with both estimates. All subsequent downstream analyses are based on the yule BEAST trees. The combined log files from four inde-pendent BEAST runs had high effective sampling sizes (ESS > 200). The BEAST MCC tree is depicted in Fig. 3 (the BEAST tree with
taxon labels and 95% confidence nodal time intervals is available in Appendix S8). The PCoA 1 and 2 distribution of 1000 PP BEAST trees and the 10 identified grove tree sets (and each median tree) from Treespace analysis is shown in Appendix S9.
Four diversification shifts evident in time- calibrated Salvia tree Divergence time estimates for major subclades within Salvia are largely overlapping, with respect to 95% confidence intervals, among the MCC and 10 median grove BEAST trees, and thus, all subsequent results and discussion will focus on mean times from the MCC BEAST tree. BAMM analyses achieved sufficient effective samples sizes after 100,000,000 generations. The best shift config-uration models across the MCC BEAST and 10 grove trees sam-pled from the PP favored four shifts in speciation rate to account for the pattern and levels of diversity across the subtribe Salviinae
FIGURE 2. Coalescent ASTRAL II tree of anchored hybrid enrichment genomic data based on 316 nuclear genes across 35 species of Salvia and five
outgroup genera in the tribe Mentheae. Support values are provided next to each node. Branch lengths are expressed in coalescent units. Asterisks in-dicate clades that are designated as monophyletic in the BEAST analyses of 528 species based on nrDNA. Edges are colored by subgenus (see Table 1). (The informal “Heterosphace” is used here and includes New World “Salviastrum” and Old World “Verticillata” and their relatives). The bootstrap RAxML tree based on concatenation of the 316 nuclear genes is provided in Appendix S6.
Prunella vulgaris Agastache pallida Melissa officinalis Lepechinia chamaedryoides Lepechinia leucophylloides Salvia yangii Salvia rosmarinus
Salvia lyrataSalvia verticillata Salvia africana−caerulea Salvia officinalis Salvia cadmica Salvia viridis Salvia canariensis Salvia sclarea Salvia virgata Salvia austriaca Salvia miltiorrhiza Salvia chinensis Salvia koyamae Salvia digitaloides Salvia przewalskii Salvia hians Salvia majdae Salvia dorystaechas Salvia columbariae Salvia californica Salvia axillaris Salvia scutellarioides Salvia patens Salvia regla Salvia oaxacana Salvia podadena Salvia corrugataSalvia thymoides
Salvia wagneriana Salvia holwayi Salvia carneaSalvia azurea
Salvia splendens 100 100 59 100 100 100 100 100 100 100 79 100 100 100100 100 100 100 100 100 100100 100 100 100 79 100 100 100 100 100 76 100 100 100 100 10079 Clade Calosphace Audibertia Dorystaechas Zhumeria Glutinaria Sclarea Salvia "Heterosphace" Rosmarinus Perovskia outgroup 2.0
(Fig. 4, Table 3). Shift configurations across eight of the grove trees exhibit all four of the shifts. Two grove trees only showed one shift (subgen. Sclarea) in the best shift configuration, but both exhibited alternative credible shift configurations with the four shifts. The MCC BEAST tree showed three shifts but lacked the shift in subgen.
Salvia, although an alternative but less likely credible shift
config-uration displayed all four. The overall rate of speciation in Salvia increased slowly but steadily from 32 to 15 Ma (λ going from 0.15 to 0.20), but beginning with the large shift in subgen. Calosphace around 15 Ma, the rate of speciation accelerated almost 3- fold during the last 15 Myr (λ going from 0.20 to 0.33 (Fig. 5)).
Rate shift 1 (crown of subgen. Salvia) occurred before 10.4 Ma in Southwest Asia, increased mean net diversification rates (r) to 0.295 (mean speciation rate or λ = 0.350, mean extinction rate or
μ = 0.055), and gave rise to a large number of species endemic to
Turkey. Shift 2 (two nodes within subgen. Sclarea) occurred between 9.9–7.8 Ma in Southwest Asia and/or the Mediterranean region (the
TABLE 2. Birth death and yule model comparison for BEAST analyses of Salvia
nrDNA. Marginal likelihood test uses the smoothed harmonic mean estimator. Provided are the marginal likelihoods, standard error (SE) estimated from bootstrap replicates, and differences between log marginal likelihoods (log Bayes factors). Positive differences (* yule model) indicate better fit of the row’s model compared to the column’s model. AICM test uses the methods- of- motion estimator. Provided are AICM values, SE estimated from bootstrap replicates, and differences between AICM values. Lower values indicate better model fit. Positive differences (* yule model) indicate better relative fit of the row’s model compared to the column’s model.
Model likelihoodsMarginal SE Birth death yule
Birth death −104596.418 ±0.189 — ±977.098
* yule ±103619.319 ±0.1 977.098 —
Model AICM SE Birth death yule
Birth death 1707250.552 ±58760.263 — ±231290.49
* yule 1475960.062 ±79188.808 231290.49 —
FIGURE 3. BEAST maximum clade credibility tree (yule model) using Salvia nrDNA and rooted with a monophyletic outgroup of Lepechinia and
Melissa. Major clades that were well supported based on AHE genomic data (see Fig. 2) were used as topological constraints in BEAST. Edges are colored by subgenus. (The informal “Heterosphace” is used here and includes New World “Salviastrum” and Old World “Verticillata” and their relatives; the “Salvia aegyptiaca clade” is informally placed here with previously recognized subgen. Zhumeria). The edges with the four BAMM species diversifi-cation shifts (see Fig. 4) are indicated. This MCC tree is used for all other subsequent analyses. An enlarged BEAST tree with species terminals and 95% nodal age intervals is provided in Appendix S8.
30 Ma
20 Ma
10 Ma
Clade
Calosphace
Audibertia
Dorystaechas
Meriandra
Zhumeria
Glutinaria
Sclarea
Salvia
“Heterosphace”
Rosmarinus
Perovskia
outgroup
Shift 1: subgen. Salvia Shift 2: subgen. Sclarea Shift 3: subgen. Glutinaria Shift 4: subgen. Calosphace
0.295 sp sp-1 Myr-1 0.486 sp sp-1 Myr-1 0.352 sp sp-1 Myr-1 0.298 sp sp-1 Myr-1
4
3
2
1
Salvia BAMM shifts
net diversification rates
Clade Calosphace Audibertia Dorystaechas Meriandra Zhumeria Glutinaria Sclarea Salvia “Heterosphace” Rosmarinus Perovskia outgroupOligocene
Miocene
Plioc. Pleist.
latter has less than 50% probability in ARE) and gave rise to a large number of species (including many Turkish and Iranian endemics) in both the broad Mediterranean and Southwest Asia regions, and to a small lineage in eastern and southern Africa. This rate shift, the second most recent, largest of the four in Salvia, and found across all grove trees, increased r to 0.486 (λ = 0.535, μ = 0.049). Shift 3 (two nodes within subgen. Glutinaria) occurred in East Asia during the mid- Miocene (13.1–10.7 Ma), increased r to 0.352 (λ = 0.400,
μ = 0.048), and gave rise to almost all eastern Asian Salvia. Shift 4
(five nodes internal to the crown of subgen. Calosphace) occurred in Mexico at 17.8–14.1 Ma, the oldest of any rate shift in Salvia, and increased r to 0.298 (λ = 0.328, μ = 0.030). The placement of this shift is constant in the core subgen. Calosphace but the timing of this shift by BAMM within the radiation of subgen. Calosphace in Mexico is less certain, relative to the preceding three, considering the proportional lack of species sampling (266 of ~600), extremely short branch lengths, and different topologies among grove trees evident in the core subgen. Calosphace.
Temporal and spatial differentiation within Salvia
The DECj model (Ln L = −498.01), incorporating the jump dispersal parameter along with those for dispersal, extinction, and cladogenesis, relative to the DEC model (Ln L = −526.06) was significantly better (p = 6.9e- 14) assuming they are nested models. DECj was also sup-ported for all 10 median grove BEAST trees. The inferred ancestral region estimation (ARE) for almost all nodes are identical with both DEC and DECj. The MCC BEAST tree showing ARE under the DECj model is depicted in Fig. 6. The alternative scoring of Asia Minor with
FIGURE 4. Rates of diversification across Salvia using BAMM based on the MCC BEAST tree. Edges colored in red and blue exhibit high and low rates of
net diversification, respectively. The four edges with shifts seen across the MCC BEAST trees and 10 grove trees from the PP are designated by number and include net diversification (r) values—the MCC tree does not show Shift 1 but 8 grove trees do (see Table 3). Terminals are color coded by subgenus. (The informal “Heterosphace” is used here and includes New World “Salviastrum” and Old World “Verticillata” and their relatives; the “Salvia aegyptiaca clade” is informally placed here with previously recognized subgen. Zhumeria). An enlarged BEAST tree with species terminals is provided in Appendix S8.
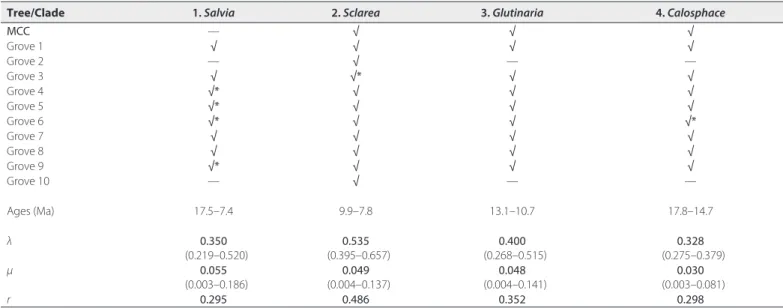
TABLE 3. BAMM diversification shift sets across the MCC and 10 median grove trees from the BEAST PP distribution (numbered as in Fig. 4). Clade names are based
on the subgeneric designations (see Table 1, Fig. 5). Asterisks designate slightly different shift positions in clade. Estimated rates (mean and 95% quantile) of speciation (λ), extinction (μ), and net diversification (r) are provided for the four shifts.
Tree/Clade 1. Salvia 2. Sclarea 3. Glutinaria 4. Calosphace
MCC — √ √ √ Grove 1 √ √ √ √ Grove 2 — √ — — Grove 3 √ √* √ √ Grove 4 √* √ √ √ Grove 5 √* √ √ √ Grove 6 √* √ √ √* Grove 7 √ √ √ √ Grove 8 √ √ √ √ Grove 9 √* √ √ √ Grove 10 — √ — — Ages (Ma) 17.5–7.4 9.9–7.8 13.1–10.7 17.8–14.7 λ 0.350 (0.219–0.520) 0.535 (0.395–0.657) 0.400 (0.268–0.515) 0.328 (0.275–0.379) μ 0.055 (0.003–0.186) 0.049 (0.004–0.137) 0.048 (0.004–0.141) 0.030 (0.003–0.081) r 0.295 0.486 0.352 0.298
FIGURE 5. Overall rate of speciation in Salvia (red graph) slowly
increas-ing from 32 to 15 Ma, but acceleratincreas-ing 3- fold beginnincreas-ing with the first large shift in subgen. Calosphace around 15 Ma. Speciation rate of just the four clades exhibiting significant BAMM shifts on their edges (see Fig. 4) is shown as the blue graph. The background rate of speciation in Salvia minus these four clades is shown as the green graph.
30 25 20 15 10 5 0 0.0 0.2 0.4 0.6 0.8 1.0
Time before present (Ma)
Speciation rate
Salvia clade
4 Salvia diversification clades Salvia clade minus 4 clades
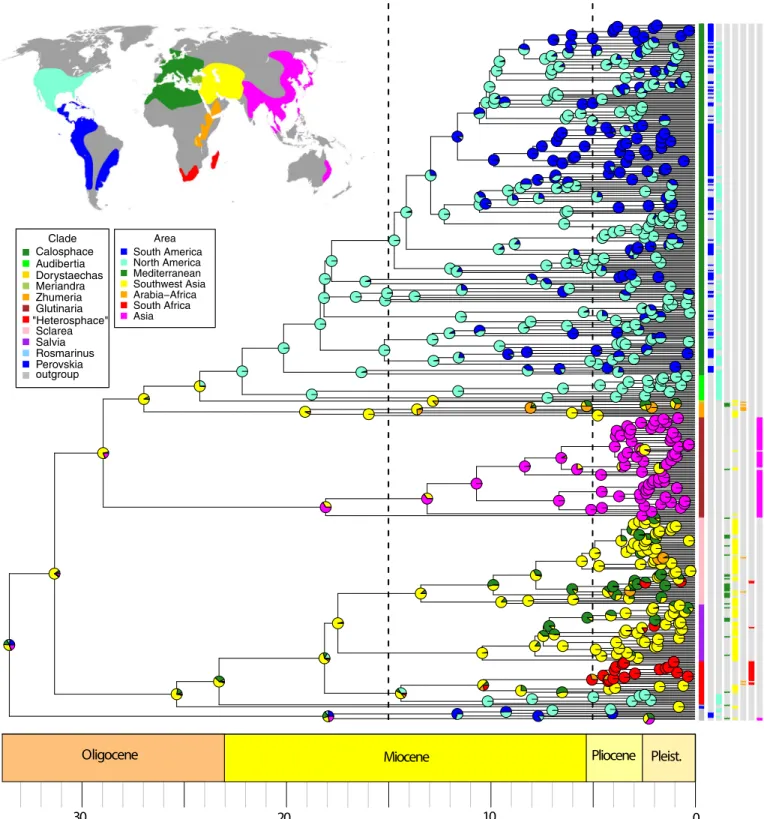
FIGURE 6. BioGeoBEARS DECj tree showing ancestral region estimation for Salvia using seven defined biogeographical regions and based on the
BEAST MCC tree (see Fig. 4). Worldwide distribution of Salvia in the map of biogeographical regions is based in part on Hedge (1974, 1986), Claßen- Bockhoff et al. (2003), Walker et al. (2004), Froissart (2007), Wester and Claßen- Bockhoff (2011), Wei et al. (2015), Will et al. (2015), Will and Claßen- Bockhoff (2014, 2017). Dashed lines separate the three time intervals used in BioGeoBEARS. Circles in the tree indicate frequencies of each area estimated for the node and are color coded by area. Terminals are color coded by subgenus. (The informal “Heterosphace” is used here and includes New World “Salviastrum” and Old World “Verticillata” and their relatives; the “Salvia aegyptiaca clade” is informally placed here with previously recog-nized subgen. Zhumeria.) To the right of the terminals and their subgeneric designations are seven columns indicating area scoring(s) for each termi-nal. Species names for each terminal are provided in Appendix S8.
Oligocene Miocene Pliocene Pleist.
30 20 10 0 Clade Calosphace Audibertia Dorystaechas Meriandra Zhumeria Glutinaria Sclarea Salvia Rosmarinus Perovskia outgroup Area South America North America Mediterranean Southwest Asia Arabia−Africa South Africa Asia "Heterosphace"
Europe and Mediterranean Africa rather than with Southwest Asia gave nearly similar ARE for the important nodes provided here and discussed later, and thus will no longer be con-sidered. Similarly, ARE for the 10 median grove BEAST trees gave similar results relative to ARE using the MCC BEAST tree. We found no in-stances where the most likely area estimated for nodes of interest in the MCC tree differed from the most commonly estimated area among these trees from the BEAST posterior. We base all subsequent discussions on the MCC tree constructed on the DECj model (Fig. 6).
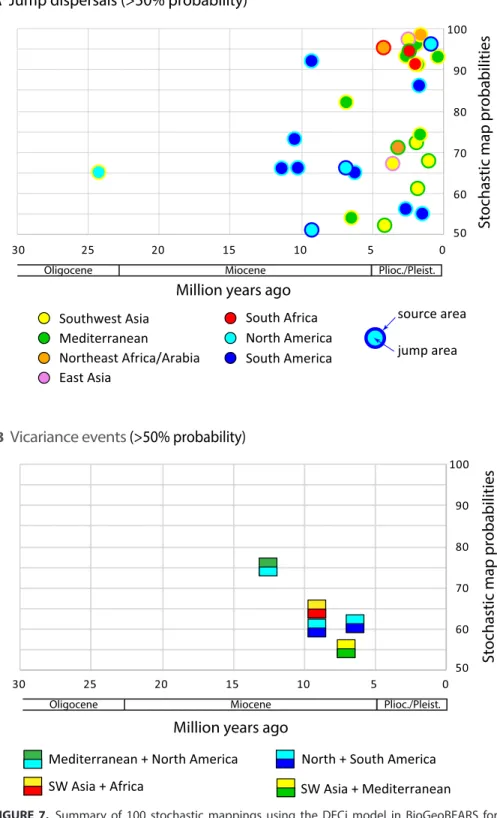
The 100 biogeographical stochastic map-pings (BSM) in BioGeoBEARS provided a probability distribution across the branches of the MCC BEAST tree for each of the dif-ferent cladogenetic events. Given the parame-ters of this model, 91% of cladogenetic events involve sympatry, 3% involve vicariance, and 6% involve jump- dispersals. All 30 jump dis-persals mapped between areas are depicted by nodal age and frequency of occurrence (<50% frequency were removed) from the 100 BSM (Fig. 7A). The oldest jump dispersal (24 Ma), at the Oligocene–Miocene transition, occurred between Southwest Asia and eastern North America giving rise to the large American ra-diation of subgen. Audibertia and Calosphace, the first of two movements of Salvia into the New World. Seven of the nine Miocene jump dispersals are within subgen. Calosphace and involve crossing the Isthmus of Panama (see Discussion on the disputed age of this geologi-cal event). During the Pliocene and Pleistocene the majority of the remaining jump disper-sals occurred between Southwest Asia and Mediterranean (10 dispersals), with dispersals between southern Africa and either Southwest Asia, Mediterranean, or Northeast Africa/ Arabia accounting for three jump dispersal events, and an additional four and two disper-sals occurred, respectively, between North and South America and between Southwest Asia and eastern Asia. The six vicariance events in the 100 BSM (>50% frequency) are all mid- late Miocene in age (Fig. 7B). The oldest (14 Ma) vicariant event involved an ancestral area of Mediterranean plus North America and gave rise to the second North American restricted lineage, within subgen. “Heterosphace”. A wide-spread flora from Southwest Asia to southern Africa fragmented at 9.5 Ma, resulting in a separate southern African area. Two vicariant events involving North and South America are
inferred in the late Miocene. Many other vicariance events are alter-native, lower probability (<<50%) stochastic mappings at nodes with inferred jump dispersals.
The subtribe Salviinae diversified in the early Oligocene (34 Ma), and the crown radiation of Salvia s.l. occurred soon after (31 Ma).
The diversification events for both the stem and crown of Salvia are unambiguously estimated as occurring in Southwest Asia. The radi-ation of the first large clade (subgen. Perovskia, Rosmarinus, Salvia,
Sclarea, and “Heterosphace”) from the Old World (excluding the
East Asian clade) is largely reconstructed as Southwest Asia (Fig. 6).
FIGURE 7. Summary of 100 stochastic mappings using the DECj model in BioGeoBEARS for
Salvia ancestral area estimation. Stochastic mapping probabilities >50% are shown for (A) jump dispersals and (B) vicariance events relative to stem node ages. Jump dispersals are color coded by source and jump areas. The four different types of vicariance events are color coded by origi-nal combined areas and resulting separated areas.
B
Vicariance events (>50% probability)
50 60 70 80 90 100 5 10 15 20 25 30 0
Stochastic map probabilitie
s
Million years ago
SW Asia + Mediterranean North + South America SW Asia + Africa
Mediterranean + North America
50 60 70 80 90 100 5 10 15 20 0
Stochastic map probabilities
Million years ago
25 30
A
Jump dispersals (>50% probability)
Southwest Asia Mediterranean Northeast Africa/Arabia East Asia South Africa North America South America source area jump area
Oligocene Miocene Plioc./Pleist.
Within this first clade, multiple shifts to Europe and Mediterranean Africa occurred in the mid- Miocene to Pliocene, and one range expansion (combined area) comprised Mediterranean to eastern North America (within subgen. “Heterosphace”). Three indepen-dent movements in this clade to Northeast and/or southern Africa are evident. The first, inferred as a vicariant event (at 10 Ma, see above), occurred within subgen. “Heterosphace” with the subse-quent African radiation commencing at the Miocene–Pliocene boundary (5 Ma). The first split within this clade separated Northeast Africa/Arabia (e.g., S. nilotica) and southern Africa/ Madagascar. Our sampling of the six Malagasy species is limited, but the two sampled species represent a very recent Pleistocene di-vergence from at most a Pliocene dispersal event from mainland Africa. The origin of the other two southern African clades involve Pliocene jump dispersals from Southwest Asia (subgen. Salvia) and from Mediterranean (subgen. Sclarea).
Radiation of the second clade, in East Asia (subgen. Glutinaria), involved a dispersal event from Southwest Asia between the late Oligocene and mid- Miocene. The crown radiation of the East Asian clade occurred at 18 Ma in the mid- Miocene, with much of the spe-cies diversification during the Pliocene (Fig. 6). Barriers to subse-quent dispersals between Southwest Asia and East Asia are implied by the fact that only four (of ca. 90) species (S. glutinosa, S. hians,
S. nubicola, S. plebeia) potentially overcame this geographic
bar-rier. Multiple dispersals from mainland East Asia to Japan occurred in the Pliocene (including but not limited to S. nipponica + S.
gla-brescens, S. lutescens + S. ranzaniana, and S. japonica).
The third large Salvia clade, including the Old World subgen.
Zhumeria, Dorystaechas, and Meriandra and the New World
sub-gen. Audibertia and Calosphace, diversified first in Southwest Asia in the late Oligocene (27 Ma) (Fig. 6). Subgenus Zhumeria, sister to the remainder, exhibited a subsequent Miocene (18 Ma) crown radiation in Southwest Asia and later Miocene shifts into Northeast Africa, southern Arabia, and more recently into the Mediterranean region (Fig. 6). The exclusively New World subclade, comprising sub-gen. Audibertia (western North America) and subsub-gen. Calosphace (largely Mexico to South America), is sister to a species- poor sub-clade comprising subgen. Dorystaechas and Meriandra that are sporadically distributed in Southwest Asia (Dorystaechas; Antalya region of Turkey) to India and Northeast Africa. Our ARE places the jump dispersal from the Old World to the New World in a rel-atively narrow time interval in the late Oligocene (24–22 Ma), thus anywhere from 8 to 10 Myr earlier than the movement to eastern North America in the first Salvia clade (subgen. “Heterosphace”). At the end of this time interval, Salvia had already diversified into stem lineages of the western North American subgen. Audibertia and the Mexican to South American subgen. Calosphace. Although both species sampling and resolution within subgen. Calosphace are presently limited with this data, ARE strongly indicates a Mexican (southern North America) origin for the subclade. Many indepen-dent jump dispersal (and some back dispersal) events to Central America and into South America are inferred (Fig. 6). These dis-persal events started no earlier than 12 Ma in the mid- Miocene but continued throughout the late Miocene and into the Pliocene. Biome diversification within Salvia: convergent shifts evident in different clades
Extracting biome type for each species by using georeferenced accessions in the framework of five combined biome types (arid/
desert, Mediterranean, grassland, broadleaf forest, coniferous for-est) was a conservative approach; i.e., scoring erred on the side of polymorphism. Species coded as polymorphic were often in the mainly European and Southwest Asian clades (e.g., subgen. Salvia,
Sclarea, “Heterosphace” in part). Species in the New World subgen. Audibertia and Calosphace and especially in the East Asian
sub-gen. Glutinaria were less polymorphic. Biome shifts across Salvia modeled using BAYAREALIKE (with a+, d=e=0) and summarized across the MCC and 10 grove trees are depicted on the MCC tree in Fig. 8A. Many of the earliest nodes (20–33 Ma) are polymorphic for broadleaf forest + coniferous forest + desert/xeric shrubland bi-omes, although broadleaf forest was the dominant biome in these early nodes across all 11 trees. The diversification of most subgen-era, however, exhibits a focusing of biome specializations, but these often in a convergent fashion. Specialization to desert and xeric shrublands in the New World is pronounced in subgen. Audibertia in western North America during the late Miocene, less so in its sister clade Calosphace, and common in the unrelated subgen. “Heterosphace” in eastern to southwestern North America. Shifts predominantly to these xeric biomes in the Old World are seen in subgen. Zhumeria (especially in the Arabian/northeast African region), Sclarea (Southwest Asia), and less so in “Heterosphace” (southern Africa). Shifts to Mediterranean biome occur inde-pendently, all within the last 4 Myr, in subgen. Audibertia (western North America), Sclarea and Salvia (Mediterranean, Middle East, especially Turkey), and “Heterosphace” (southern Africa). Shifts to grasslands are seen in many subgenera during the Miocene, but are most dominant in Calosphace (mostly South America), Sclarea and
Salvia (Southwest Asia), and “Heterosphace” (southern Africa).
Broadleaf and coniferous forests largely dominate the East Asian subgen. Glutinaria, and each of these biomes are restricted to specific subclades (Fig. 8A). The two forest biomes dominate the diversification of both Mexican and South American species of
Calosphace (with more recent shifts to arid and grassland biomes as
noted above), but there is no specialization of the two biomes within
Calosphace lineages as seen in East Asian Glutinaria. Broadleaf and
coniferous forest biomes are minor in the other clades of Salvia, although most clades exhibit some signal of forest biomes earlier in their diversifications (e.g., mid- Miocene). Transitions between broadleaf and coniferous forest biomes, as averaged over the MCC and 10 grove trees, account for the majority of biome shifts in Salvia (Fig. 8A, inset). Given the nearly equal representation (1/3 each) of these two forest biomes and the desert/arid shrubland biome in the early biome diversification of Salvia, the asymmetry in shifts giving rise to grassland and Mediterranean biomes is striking (Fig. 8A, in-set). Grassland biome lineages arose from broadleaf forest biome lineages >4× more often than from either coniferous forest or des-ert/arid biome lineages, and of all biomes, the broadleaf forest is the only one that shows a transition back from the grassland biome. The Mediterranean (and the most recent) biome only shows transitions from the grassland and desert/arid shrubland biomes, never directly from either broadleaf or coniferous forest biomes. In addition, the Mediterranean biome only exhibits a few back transitions to grass-lands, indicating that radiation into the more recent Mediterranean biome has so far been mostly unidirectional in Salvia.
Relative to the four inferred BAMM diversification shifts (see Figs. 3 and 4), biome shifts do not appear to be directly related to increased speciation in Salvia. Two diversification shifts (Shift 4 in subgen. Calosphace, Shift 3 in subgen. Glutinaria) occur in mixed broadleaf and coniferous forest biomes, but these nodes
are imbedded in clades largely scored for these forest biomes with no biome shifts nearby. Likewise, Shift 2 in subgen. Sclarea occurs within a larger clade scored for desert/arid shrubland, although a later (~5 Myr) shift to the grassland biome did occur. Shift 1 in sub-gen. Salvia is placed on a branch polymorphic for forests, desert, and grassland biomes, but with subsequent narrowing to grassland or Mediterranean biomes.
Pollinator shifts within Salvia
The preferred model of discrete character evolution chosen across trees using AIC was the all rates different model (ARD). Using this model, the root state was consistently estimated as being bee
pollinated (Fig. 8B). Across the 11 trees (grove trees and MCC tree), there was an average of 10 subsequent changes (range 9–11) from bee to bird pollination, and an average of 56 changes (range 53–58) from bird back to bee pollination (Fig. 8B, inset). Across trees, there were consistent changes in the New World from bee to bird polli-nation (hummingbirds) in subgen. Calosphace and “Heterosphace” (and to a lesser extent in Audibertia with several species polymor-phic for pollination), and multiple independent shifts (all southern African) to bird pollination (hummingbirds and passerines) in subgen. “Heterosphace”. All shifts back to bee pollination occurred in New World subgen. Calosphace with a few species in these bee- pollinated clades re- evolving hummingbird pollination. Shifts to bird pollination are not linked to shifts in biomes. Hummingbird
FIGURE 8. Reconstruction of (A) biome and (B) pollinator shifts in Salvia using mirror BEAST MCC trees (see Fig. 4). Terminals are color coded by
subgenus in the center column. (The informal “Heterosphace” is used here and includes New World “Salviastrum” and Old World “Verticillata” and their relatives; the “Salvia aegyptiaca clade” is informally placed here with previously recognized subgen. Zhumeria). Species names for each terminal are provided in Appendix S8. (A) Biome shifts were obtained with a modified BAYAREALIKE model in BioGeoBEARS. Frequency of biomes reconstructed at each node are summarized across the MCC and 10 grove trees. Terminals are scored for each of the five biomes by color coding in the five columns to their right. Dashed lines represent the time constraints placed on the origin of grassland (14 Ma) and Mediterranean (4 Ma) biomes. Inset A depicts the number of transitions between biomes. (B) Pollinator shifts were obtained using the function rayDISC of the R package corHMM, estimated transition rates were used to set the weights at the root, and the MCC and grove trees were sampled. Terminals are scored for bee, bird, or polymorphic by color coding in the column to their left. Dashed lines indicate the 95% confidence interval of the crown radiation of hummingbirds (McGuire et al., 2014). Inset B depicts the number of pollinator transitions between bird and bee pollination systems.