Disability Benefits, Consumption
Insurance, and Household Labor Supply
The MIT Faculty has made this article openly available.
Please share
how this access benefits you. Your story matters.
Citation
Autor, David et al. "Disability Benefits, Consumption Insurance, and
Household Labor Supply." American Economic Review 109, 7 (July
2019): 2613-54 © 2019 American Economic Association
As Published
http://dx.doi.org/10.1257/AER.20151231
Publisher
American Economic Association
Version
Final published version
Citable link
https://hdl.handle.net/1721.1/128851
Terms of Use
Article is made available in accordance with the publisher's
policy and may be subject to US copyright law. Please refer to the
publisher's site for terms of use.
2613
Disability Benefits, Consumption Insurance,
and Household Labor Supply
†By David Autor, Andreas Kostøl, Magne Mogstad, and Bradley Setzler* There is no evaluation of the consequences of Disability Insurance (DI) receipt that captures the effects on households’ net income and
consumption expenditure, family labor supply, or benefits from other
programs. Combining detailed register data from Norway with an instrumental variables approach based on random assignment to
appellant judges, we comprehensively assess how DI receipt affects
these understudied outcomes. To consider the welfare implications of
the findings from this instrumental variables approach, we estimate
a dynamic model of household behavior that translates employment,
reapplication, and savings decisions into revealed preferences for
leisure and consumption. The model-based results suggest that on
average, the willingness to pay for DI receipt is positive and sizable.
Because spousal labor supply strongly buffers the household income
and consumption effects of DI allowances, the estimated willingness
to pay for DI receipt is smaller for married than single applicants. (JEL D12, D14, H55, I38, J14, J22)
Over the past 50 years, disability insurance (DI) rolls have risen dramatically in many OECD countries. In the United States, Social Security Disability Insurance (SSDI) benefits receipt has risen from less than 1 percent to 4.7 percent of the non-elderly adult population between the program’s inception in 1956 and the pres-ent (US Social Security Administration 2017c). In many European countries, the increases are even more striking, from 1 percent to 7 percent in the United Kingdom
* Autor: Department of Economics, Massachusetts Institute of Technology, 50 Memorial Drive, E52-371, Cambridge, MA 02142, and National Bureau of Economic Research (email: dautor@mit.edu); Kostøl: Research Department, Norges Bank, Postboks 1179 Sentrum, 0107 Oslo, Norway, and Statistics Norway (email: andreas.r.kostol@gmail.com); Mogstad: Department of Economics, University of Chicago, 1126 E. 59th Street, Chicago, IL 60637, Statistics Norway, and NBER (email: magne.mogstad@gmail.com); Setzler: Department of Economics, University of Chicago, 1126 E. 59th Street, Chicago, IL 60637 (email: bradley.setzler@gmail. com). Hilary Hoynes was the coeditor for this article. This research was supported by the US Social Security Administration through grant 1 DRC12000002-03 to the NBER as part of the SSA Disability Research Consortium. The findings and conclusions expressed are solely those of the authors and do not represent the views of SSA, any agency of the Federal Government, or the NBER. This paper should not be reported as representing the views of Norges Bank. The views expressed are those of the authors and do not necessarily reflect those of Norges Bank. The project also received financial support from the Norwegian Research Council. The authors declare that they have no relevant or material financial interests that relate to the research described in this paper. We are grateful to Richard Blundell, Raj Chetty, Amy Finkelstein, Kai Liu, Nathan Hendren, Hamish Low, Luigi Pistaferri, Alessandra Voena, three anonymous referees, and the editor of this journal for valuable input and guidance, and to Knut Brofoss, Espen Vihle, and Runar Narvland for their help in accessing the data and in understanding the institutional details.
† Go to https://doi.org/10.1257/aer.20151231 to visit the article page for additional materials and author
and from 2 percent to almost 10 percent in Norway. These increases have made DI one of the largest transfer programs in most OECD countries. In the United States, for example, outlays for DI exceed those for food stamps, traditional cash welfare, or the Earned Income Tax Credit.1 For families without small children, DI is often the primary cash benefit available after unemployment benefits expire, and it has become an increasingly important component of the social safety net in numerous industrial-ized countries (OECD 2010).
To potentially curtail DI program growth, several countries have significantly tightened disability screening criteria, and many others are considering similar pol-icies.2 These enhanced gate-keeping policies can reduce the fiscal burden of dis-ability insurance, both by lowering the DI caseload and by increasing tax revenue if rejected applicants return to work. At the same time, stricter screening may result in net welfare losses if individuals and families value public disability insurance at more than its fiscal cost.3 Assessing this trade-off requires a comparison of the pub-lic costs and private benefits of DI awards for apppub-licants at the margin of allowance versus denial, since it is their outcomes that would be changed by shifts in screening stringency. To implement this comparison, we need data on two economic quantities that are rarely measured: the economic value that individuals and families place on disability insurance; and the full cost of DI allowances to taxpayers, summing over DI transfer payments, benefit substitution to or from other transfer programs, and induced changes in tax receipts. Credibly estimating these quantities is typically hindered both by a lack of comprehensive linked data measuring these many out-comes, and by the difficulty of distinguishing the causal effects of DI receipts from the many unobserved factors that simultaneously determine disability status, earn-ings, tax payments and transfer receipts, and consumption.
This paper addresses both the measurement and the identification challenge in the context of Norway’s DI system, enabling us to offer empirical evidence on the fiscal costs, income and consumption gains, and welfare consequences of DI receipt. Our work draws on two strengths of the Norwegian environment. First, Norwegian register data allow us to characterize the household impacts and fiscal costs of dis-ability receipt by linking employment, taxation, benefits receipt, and assets at the person and household level. Our measure of fiscal costs includes virtually all forms of government cash transfers and revenues from (direct) taxes, and accounts for changes in labor supply and substitution to other transfer programs. Our measures of household impacts of DI receipt include net government transfer payments from all 1 In 2016 the United States paid out $143 billion to 10.6 million disabled workers and their families, with an
additional $49 billion in federal Supplemental Security Income (SSI) payments to blind and disabled workers, and approximately $107 billion on Medicare expenditures for disabled workers (SSA (2017a) OASDI Trustees Report, Table III.A.5; SSA (2017b) SSI Annual Report, Table IV.C1, and Table II.B1). In 2013, DI cash payments constituted 1.4 percent of GDP in the United States and 1.7 percent of GDP across the European OECD countries (OECD 2015).
2 For example, the United States tightened the criteria for new disability awards in the late 1970s and
intro-duced an aggressive program of continuing disability reviews in 1980; however, Congress responded by halting the reviews and, in 1984, liberalizing the program’s screening criteria along several dimensions. Another example is the Netherlands: in 1994, the eligibility criteria were tightened and the growth in DI rolls reversed.
3 In the United States, all private disability insurance is provided through employer-based group policies. These
policies “wrap-around” the public SSDI system, so that most of the wage insurance risk and all of the medical cost risk is ultimately borne by the public program (Autor, Duggan, and Gruber 2014). There is not a strong standalone private market in disability insurance, likely because of adverse selection. In the Norwegian setting that we study, private disability insurance is rare.
sources, employment and earnings of DI applicants (both allowed and denied) and their spouses, as well as households’ total income and measures of their consump-tion expenditure. Second, we obtain plausibly exogenous variaconsump-tion in DI allowances by exploiting the random assignment of DI applicants to Norwegian judges who differ systematically in their leniency. As a measure of judge leniency, we use the average allowance rate in all other cases a judge has handled. This leniency measure is used as an instrumental variable for DI receipt, as it is highly predictive of judicial rulings in incumbent cases but uncorrelated with case characteristics. This instru-mental variables approach recovers the causal effects of DI allowance on individuals at the margin of program entry.
Our first set of analyses, which estimate the causal effects of DI receipt on earnings, total income, consumption expenditure, and fiscal costs, yields four main findings. First, granting DI benefits to applicants on the margin of program entry induces a fall in annual earnings of approximately $5,200, which is about 45 percent of the annual DI transfer benefit awarded. Second, DI allowances raise average household income and consumption expenditure by 16 and 18 percent, implying that DI receipt provides partial consumption smoothing across states of nature for a given individual. Third, the external costs to taxpayers from providing DI benefits, stemming from transfer payments and reduced payroll tax revenues, substantially exceed the net increases in household incomes accruing to DI bene-ficiaries. Fourth, the consequences of DI allowances differ substantially by mar-ital status. Among single and unmarried applicants, DI awards have large direct impacts on household income and consumption expenditure, incrementing each by about 40 percent relative to baseline. Conversely, DI allowances do not signifi-cantly increase the household incomes or the consumption of married applicants on average; indeed, we can reject positive impacts of more than 9 percent of base-line income. The reason is that spousal labor supply adjustments and benefit sub-stitution are estimated to offset the effect of DI transfers on household incomes, though we stress that this does not imply that household welfare is unaffected by these transfers.
These causal effects estimates provide key data points for a welfare analysis, but they do not by themselves tell us how much DI allowances affect household welfare, since this also depends on the preferences for leisure and consumption. To explore these welfare implications, we estimate a dynamic model of household behavior with heterogeneous, forward-looking individuals. The model translates employ-ment, savings, and reapplication decisions of applicants and their spouses into revealed preferences for leisure and consumption. Brought to the data, the model matches well the instrumental variables estimates of the impact of DI allowances, and moreover, provides plausible parameter estimates for labor supply elasticities. We use the estimated model to compute the welfare benefits of DI receipt, by which we mean the cash equivalent value of receiving a DI allowance, and to perform counterfactual analyses that allows us to infer the extent to which the welfare value of receiving a DI allowance is influenced by household labor supply responses, sav-ings, and the possibility of reapplying for DI. The model-based results suggest that on average the welfare effect of DI benefits is positive and sizable, and particularly so for single individuals. Notably, because spousal labor supply responses provide partial insurance against the impact of DI denials on income and consumption of
married households, the welfare value of DI benefits for married households is con-siderably smaller than for single individuals.
Our paper contributes to an active literature analyzing the economic consequences of public disability insurance systems (for a review, see Autor and Duggan 2006, Autor 2011, Liebman 2015). While the core of this literature focuses on the impacts of disability benefits on the employment and earnings effects of DI allowance, little is known about either the fiscal costs or the household level effects on labor supply and consumption.4 Meyer and Mok (2019) and Kostøl and Mogstad (2015) offer to our knowledge the only prior study that documents changes in income and con-sumption that follow changes in health and disability. Our identification strategy, which uses judge assignments to isolate quasi-experimental variation in disability allowances, builds on three recent studies using US data to estimate labor supply impacts of DI receipt.5 Exploiting variation in DI allowances stemming from differ-ences in disability examiner leniency, Maestas, Mullen, and Strand (2013) and Autor et al. (2017) find that DI receipt substantially reduces earnings and employment of applicants. French and Song (2014) pursue a similar strategy, using variation in the leniency of appeal judges rather than initial examiners, and find comparable labor supply effects of DI receipt among appellants.
Our study makes two contributions to this active literature. It combines quasi-ex-perimental variation in judicial disability determinations with extensive register data on disability applicants and household members to provide novel evidence on the income gains, consumption benefits, and fiscal costs of DI receipt. Second, the sub-sequent structural model estimation offers a welfare assessment of these findings. Our structural model mirrors the life-cycle model used by Low and Pistaferri (2015) to analyze the insurance value and incentive costs of DI benefits. We deviate from Low and Pistaferri in two important ways. While Low and Pistaferri model individ-ual behavior, and hence do not consider insurance from spousal labor supply, we model household behavior, which is important given our finding of a strong spousal labor supply response. Specifically, we estimate a life-cycle model with two earners making consumption and labor supply decisions. Distinct from Low and Pistaferri, we do not model the pre-application behavior of households, largely because we do not have health information for people who do not apply for DI. Our goal is there-fore limited to understanding the post-application labor supply, savings, and reappli-cation decisions of applicants and their spouses, taking as given their characteristics and economic circumstances at the time of application. Our counterfactual estimates do not therefore take into account potential changes in the number and composition of applicants.
Our paper also advances understanding of how households respond to shocks to income.6 Most work in this literature assumes exogenous labor supply, focuses on a single earner, or imposes restrictions on the nature and type of insurance available 4 This literature includes Parsons (1980), Bound (1989), Gruber (2000), Chen and van der Klaauw (2008), and
Kostøl and Mogstad (2014) as well as the methodologically related papers on DI discussed immediately below. See also Autor and Duggan (2003) and Borghans, Gielen, and Luttmer (2014) for empirical evidence on the interaction between disability insurance and other transfer programs in the United States and Netherlands.
5 See also Dahl, Kostøl, and Mogstad (2014) who use judge assignment to show that the receipt of a DI in one
generation causes increased DI participation in the next generation.
6 This literature is reviewed by Blundell, Pistaferri, and Preston (2008); Meghir and Pistaferri (2011); and
to families. A notable exception is Blundell, Pistaferri, and Saporta-Eksten (2016), who estimate a life-cycle model with two earners jointly making consumption and labor supply decisions.7 Consistent with our findings, Blundell et al. find an import-ant role for consumption insurance through household labor supply, while self-insur-ance through savings and borrowing matters less. In line with these results, Persson (forthcoming) finds that husbands increase their labor supply to offset household income losses following the elimination of survivors insurance for their wives, and Fadlon and Nielsen (2019) find that wives offset income losses following the death of a spouse through increased labor supply.
A related literature tests for the added worker effect, that is, an increase in spou-sal labor supply induced by negative income shocks to the other spouse (Lundberg 1985). Cullen and Gruber (2000) review this literature and highlight the difficulty in drawing credible inferences from observational data. The key challenge is to locate a plausibly exogenous shock to the income of one spouse exclusively that does not directly affect the labor supply of the other spouse, thus overcoming the problem of simultaneity and correlated unobservables among spouses. Our research design resolves these challenges by identifying a plausibly exogenous income shock (DI allowance) that directly affects only one member of the household (the DI appli-cant), thereby providing a strong test of the added-worker effect.
The remainder of the paper proceeds as follows. Section I reviews the key features regarding the DI program in Norway, compares the system with the US system, and describes the research design. Section II describes the data and sample restrictions. Section III assesses the relevance and validity of our instrument. Section IV esti-mates the causal effect of DI allowance versus denial on applicant labor earnings and receipt of transfer income. Section V analyzes the household impact and fiscal costs of DI allowances. Section VI documents that DI allowances affect household income and consumption differentially according to marital status, and explores how spousal responses to the allowance decision may help explain this heteroge-neity. Section VII develops and estimates a structural model of household labor supply and uses these estimates to explore the welfare value of disability receipt for marginal applicants. The final section concludes.
I. Background
We first provide an institutional and statistical description of the Norwegian DI program. We next document how the DI system generates quasi-random disability allowances for a subset of DI appellants (i.e., applicants who appeal their initial denial) and explain how our research design uses this variation to estimate the eco-nomic consequences of DI allowances.
The Norwegian DI Program.—We summarize the Norwegian DI program here
and refer the reader to Section IIB of Dahl, Kostøl, and Mogstad (2014) for further 7 A complementary exception is Finkelstein, Hendren, and Luttmer (2019), who directly estimate the insurance
value of Medicaid in-kind public health plan benefits using variation from a randomized controlled trial. Distinct from our focus, their work (i) abstracts from labor supply considerations since labor supply appears unaffected by Medicaid provision in their setting (Baicker et al. 2014); and (ii) estimates both the transfer and ex ante insurance values of public benefits provision, whereas we estimate only the first component.
details. The Norwegian DI program provides partial earnings replacement to work-ers under the full retirement age who are unable to engage in substantial gainful activity because of a medically determined physical or mental impairment that has lasted for at least a year.8 The DI program is part of the broader Social Security System and is financed through employer- and employee-paid taxes. The level of DI benefits depends upon a worker’s earnings history, and the schedule is progressive, so that the replacement rate is higher for low-wage workers. DI payments consist of two components: a basic benefit amount, independent of the applicant’s earnings history; and supplementary benefits that increase in pre-disability earnings levels. By law, singles have a higher basic benefit amount than married beneficiaries, and spousal income (if present) reduces the spousal benefit further.
Workers seeking DI benefits apply to the Norwegian Social Security Administration office. In the initial Disability Determination Stage (DDS) review, examiners check whether the applicant meets non-medical criteria, including age and prior employ-ment requireemploy-ments and, if so, use written medical evidence to evaluate the appli-cant’s ability to work, accounting for health, age, education, work experience, and the skill transferability. Benefits are awarded to applicants assessed as unable to engage in any substantial gainful activity. Approximately three-quarters of appli-cants are awarded benefits at this stage, with roughly one-third of those awarded receiving partial awards. Denied applicants are often those claiming difficult to ver-ify impairments, particularly back pain, as we discuss below.
Those denied at the DDS review may appeal within two months to the Court of Appeals, and about 25 percent of denied applicants do so. Appellants are assigned to Administrative Law Judges (ALJs), who either allow, deny, or remand (i.e., return to the DDS for reevaluation) their cases.9 In the case of appeal, ALJs are required to apply the same criteria used in the initial determination process, although applicants may present new supporting information in writing. Approximately 15 percent of all appealed claims are allowed at the ALJ level. If the appeal is denied, the applicant can subsequently choose to file a new DI application. Seventy-five percent of denied appellants eventually reapply, with 65 percent of those ultimately allowed DI.10
Assignment of DI Cases to Judges.—All Norwegian disability appeals are heard
in Oslo. Prior to 1997, there was only one hearing department; subsequently, there were four equally sized departments, all housed in the same building, and with no specialization across the four departments. Within each department, the assignment of cases to Administrative Law Judge is performed by a department head who does not have knowledge of the content of cases. As stipulated in the rules set forth for the Administrative Law Court, case assignment should be done “by the drawing
8 This definition is almost identical to the one used by the US SSDI program (see Social Security Act 1614). 9 Average processing time at the DDS stage is six months, and average processing time at the appeal stage is
four months. In our main analysis, we count remands, which account for only 5 percent of appeal outcomes, as rejections. Our results are unaffected if we instead code remands according to their ultimate disposition following reconsideration.
10 If a case is denied at the ALJ level, it can also be appealed to the higher courts, but few applicants exercise
of lots.” In practice, cases are assigned on a rotating basis depending on the date they are received and the alphabetical ordering of a judge’s last name.11
Unusual among national disability systems, Norwegian judges are not specialized according to cases characteristic (medical condition, geographic region, or other attributes), and there is never any personal contact between judges and appellants (all evidence is presented in writing). Appellants have no option to seek a different judge from the one to whom they are assigned.
Verifying Random Assignment.—Table 1 verifies that the hearing office
assign-ment mechanism generates a distribution of cases across judges that is consistent with random assignment. There are 75 judges in our sample who have handled on average 375 cases each. We measure judge leniency as the average allowance rate in all other cases a judge has handled (including the judge’s past and future cases that may fall entirely outside of our estimation sample). To purge any differences over time or across departments in the characteristics of appellants or the overall leniency rate of the DI system, we always control for fully interacted year by department dummies (the level at which randomization occurs.)
The first column of Table 1 tests whether appellants’ (predetermined) character-istics and economic conditions are predictive of case outcomes using a linear proba-bility model. Demographic, economic, and health variables are highly predictive of whether an appealed case is allowed, as expected. Column 3 assesses whether these same case characteristics are predictive of the leniency of the judges to which cases are assigned and finds no such relationship. Jointly, these 21 variables explain about 0.1 percent of the variation in the judge leniency measure ( joint p-value of 0.72), and none is statistically significant at the 10 percent level.
Our data do not offer insight into why some judges are more lenient than others.12 What is critical for our analysis, however, is that appellants are randomly assigned to judges (as our data confirm), that some judges are systematically more lenient than others (as documented in Section IIIA), and that cases allowed by a strict judge would also be allowed by a lenient one (consistent with the tests in Section IIIB).
Instrumental Variables Strategy.—We use variation in DI allowances induced by
the random assignment of appellants to judges who differ in their leniency as an instrumental variable to estimate the economic consequences of disability receipt. Our baseline instrumental variables (IV) model is described by the following two-equation system:
(1) A i = γ Z j(i) + X i′ δ + ε i ,
(2) Y it = β t A i + X i′ θ t + η it .
11 We verified these rules with the Head of the Administrative Law Court, Knut Brofoss. We have also verified
our understanding with current judges and department heads.
12 We find that experienced judges appear to be slightly less lenient, but experience accounts for only a small
Here, A i is an indicator variable equal to 1 if appellant i is allowed DI at the appeal, and Z j(i) is the leniency measure for judge j to which appellant i is assigned. The vector X i contains relevant control variables, including a full set of year-of-appeal by department dummies. In the second-stage equation, Y it is a dependent variable of interest that is measured for appellant i at some point t after the allowance decision (e.g., earnings three years after the decision).
The target of our estimation is the average of β t among individuals who are allowed DI at the appeal because they were assigned to a lenient judge. To estimate this local average treatment effect (LATE), our baseline specification uses two-stage least squares (2SLS) with first- and second-stage equations given by (1) and (2). The endogenous variable in our estimation is an indicator for whether an appellant
Table 1—Testing for Random Assignment of Cases to Judges
Case allowed Judge leniency Coefficient SE Coefficient SE
Dependent variable: (1) (2) (3) (4)
Panel A. Predetermined characteristics
Age 0.0044 (0.0003) 0.0001 (0.0001)
Number of persons in household −0.0143 (0.0021) −0.0003 (0.0003)
Female 0.0193 (0.0056) 0.0008 (0.0012)
Married 0.0146 (0.0066) 0.0005 (0.0012)
Foreign born −0.0446 (0.0086) −0.0003 (0.0015)
Less than high school degree −0.0231 (0.0061) −0.0005 (0.0008)
High school degree 0.0195 (0.0061) 0.0001 (0.0007)
Any college 0.0119 (0.0116) 0.0010 (0.0014)
Children below age 18 −0.0601 (0.0058) −0.0009 (0.0010)
Musculoskeletal disorders −0.0171 (0.0059) 0.0005 (0.0017) Mental disorders 0.0088 (0.0075) −0.0003 (0.0024) Circulatory system 0.0235 (0.0158) 0.0000 (0.0023) Respiratory system −0.0196 (0.0151) −0.0021 (0.0021) Neurological system 0.0459 (0.0206) 0.0011 (0.0021) Endocrine diseases 0.0418 (0.0174) −0.0029 (0.0031)
Panel B. Predetermined economic variables
Average indexed earnings ($1,000) 0.0009 (0.0002) 0.0000 (0.0000) Total transfers ($1,000) −0.0004 (0.0003) 0.0001 (0.0001) Liquid assets ($1,000, per capita) 0.0004 (0.0002) 0.0000 (0.0001) Total gross wealth ($1,000, per capita) 0.0001 (0.0000) 0.0000 (0.0000) Total liabilities ($1,000, per capita) 0.0001 (0.0001) 0.0000 (0.0000) Disposable income ($1,000, per capita) 0.0006 (0.0004) 0.0000 (0.0002)
F-statistic for joint significance 24.36 0.78
[ p-value] [0.001] [0.72]
Observations 14,092 14,092
Notes: Standard errors (in parentheses) are clustered at the judge level. This table reports an F-test of whether the hearing office complied with the random allocation procedure described in Section I. The baseline estimation sam-ple consists of individuals who appeal an initially denied DI claim during the period 1994–2005 (see Section II for further details). There are 75 unique judges. Columns report OLS regressions of appellant characteristics on (column 1) a dummy variable for whether the case was allowed; and (column 3) our measure of judge leniency. F-statistics are obtained from OLS estimation on the combined set of appellant characteristics. Each regression con-trols for fully interacted year of appeal and department dummies. Characteristics of appellants are measured prior to appeal. Variable definitions are as follows: children is equal to 1 if appellant has children under age 18 and 0 oth-erwise; any college is equal to 1 if a person has some college or has a college degree; body system codes are based on ICD-10 diagnostic codes. Predetermined economic variables are measured one year before appeal, and average indexed earnings is mean earnings for the ten years prior to appeal. Assets, wealth, liability, and disposable income are measured at the household level and normalized by the number of household members. Nominal values are deflated to 2005 and represented in US dollars using the average exchange rate NOK/$ = 6.
was allowed DI at appeal, rather than whether the appellant is currently receiving DI when outcome Y it is observed. This specification alleviates concerns about the exclusion restriction: 2SLS estimates of β t capture the causal effects of the initial judicial disability determination, which may operate through a number of channels, including participation in DI, subsequent reapplications to the DI program follow-ing denial, or other behavioral changes resultfollow-ing from the initial outcome at appeal. We can also estimate the reduced form effect of judge leniency on appellant out-comes by directly regressing Y on Z and X .
II. Data and Background
A. Data and Sample Restrictions
Our analysis integrates data across multiple administrative registers to assess the impact of DI allowances on DI and other transfer benefits, labor income, tax pay-ments, and consumption. Information on DI benefits is drawn from social secu-rity registers that contain complete records for all individuals who entered the DI program during 1967–2010. These data record each individual’s work history and medical diagnosis, the month when DI was awarded or denied, and the level of DI benefits received. We link these data to hearing office records for all DI appeals during 1989 through 2011, including dates of appeal and decision, outcomes for each appeal, and unique identifiers for both judges and appellants.
To capture complete information on DI applicants’ earnings, income, and assets, we merge the social security data with longitudinal administrative registers provided by Statistics Norway covering every Norwegian resident from 1967 to 2010. These register data enumerate individual demographic information (including sex, age, and education) and, since 1993, all sources of annual income, including earnings, self-employment income, capital income, and cash transfers, as well as most types of assets holdings and liabilities, such as real estate, financial portfolio, and debt. Income data are reported in annual amounts, while the values of assets holdings and liabilities are measured as of the last day of each year.
The Norwegian data have several advantages over register data collected by many other countries. Because most components of income and wealth are third-party reported (e.g., by employers, banks, and financial intermediaries), the coverage and reliability are rated as exceptional by international quality assessments (see, e.g., Atkinson, Rainwater, and Smeeding 1995). Because in Norway most register data are a matter of public record, there is no attrition from the original sample due to non-response or non-consent. The income and wealth data pertain to all Norwegian residents, and are therefore not limited to those employed in jobs covered by social security, individuals who respond to wealth surveys, or households that file estate tax returns. Measures of income and wealth are recorded without any top or bottom coding.13 Finally, unique identifiers allow us to match spouses to one another and
13 Some individuals are reported with negative income components (e.g., negative cash transfers). In these
cases, we truncate the income components at zero. We also top-code a handful of observations with extremely large income components. The results do not change appreciably if we retain these outliers.
parents to children, thereby constructing measures of per capita household income and consumption.
A key challenge in estimating the consumption effects of DI receipt is the lack of reliable longitudinal data on consumption expenditures. One approach to measuring expenditures is to use survey data, but expenditure surveys typical have small sample sizes and face significant measurement issues (see Pistaferri 2015 for a discussion). A second option is to create measures of consumption from the accounting identity that total consumption expenditure is equal to income plus capital gains minus the change in wealth over the period. Browning and Leth-Petersen (2003) show how one can construct such measures of consumption from longitudinal data on income and assets. Eika, Mogstad, and Vestad (2017) perform a similar exercise combining tax data on income and wealth with detailed information on households’ financial and real estate transactions. Their analysis shows that the measures of consumption derived from such datasets conform well to those reported in family expenditure surveys and to the aggregates from national accounts. We use their measures here, and refer the reader to Eika, Mogstad, and Vestad (2017) for more details.
Our empirical analysis studies DI applicants who appeal an initially denied DI claim.14 Our estimation sample consists of individuals whose appeal decision was made during the period 1994–2005, which allows us to observe individuals for at least four years after the appeal decision. To reduce sampling variation in the instru-mental variable, we follow Maestas, Mullen, and Strand (2013) and French and Song (2014) in excluding cases assigned to appeal judges who handled fewer than 10 cases during the 1989 through 2011 period.15 To circumvent the issue of older appellants substituting between DI and early retirement, we also exclude appellants who are above age 62 at the time of appeal.
In Table 2, we document characteristics of the sample of individuals who apply for DI and the subsample who appeal an initially denied DI claim (our baseline sample). Relative to the full sample of initial applicants, those who appeal are more likely to be female, are less educated, are more likely to be foreign born, and have lower prior earnings and assets. DI appellants are 20 percent more likely than the full set of DI applicants to claim musculoskeletal disorders (44 versus 37 percent), and only one-half as likely to claim circulatory system disorders (4 versus 8 percent).
B. Institutional Background
There are a number of similarities and some key differences between the DI sys-tems in the United States and in Norway (see Autor and Duggan 2006, Kostøl and Mogstad 2014). DI is one of the largest transfer programs in both countries. The prevalence of DI receipt is considerably lower in the United States than in Norway, as shown in Figure 1, though both have grown five to ten times as the adult popu-lation has over the last five decades. From 1961 to 2012, DI prevalence increased
14 Some individuals have several denied DI claims over the period we consider. We restrict our sample to each
individual’s first denied DI claim.
15 Including these cases does not appreciably change the estimates, nor does excluding cases assigned to judges
from 2.2 to 9.7 percent in Norway and from 0.8 to 5.0 percent in the United States.16 In recent years, Norway’s DI prevalence has leveled off at about 10 percent, while in the United States, SSDI prevalence rose steeply through 2013, after which time it peaked and reversed (Social Security Advisory Board 2015).17
In both countries, the expansion of the DI rolls appears to be driven in signifi-cant part by changes in disability screening criteria, which led to a steep rise in the share of DI recipients suffering from difficult-to-verify disorders such as mental illness and musculoskeletal disease.18 Because these disorders have low associated
16 Milligan and Wise (2011) discuss sources of differences in DI rates across countries, arguing that differences
in underlying population health explain little of this variation.
17 The US Supplemental Security Income program (SSI) also provides disability benefits to adults and children
with work-limiting disabilities. DI and SSI therefore jointly provide disability benefits to a larger share of US adults than does DI alone. However, the US DI program is more comparable to the Norwegian DI program than is the United States SSI program since SSI primarily provides benefits to adults with little work history. In this sense, SSI is more akin to the social assistance program in Norway, which is a need-based and means-tested program, with the difference that SSI applies only to individuals with disabilities.
18 See Autor and Duggan (2006) and Liebman (2015) for discussions of this phenomenon. In the United States,
the 1984 congressional reforms shifted the focus of screening from medical to functional criteria. In Norway, the medical eligibility criteria were relaxed earlier and more gradually.
Table 2—Descriptive Statistics of Applicants and Appellants DI applicants DI appellants
Test of equal means
Mean SD Mean SD t-statistic
Panel A. Predetermined characteristics
Age (at the time of decision) 48.55 [9.98] 46.61 [9.30] −25.17 Number of persons in household 2.37 [1.17] 2.79 [1.30] 39.28
Female 0.56 [0.50] 0.63 [0.48] 17.5
Married 0.57 [0.50] 0.57 [0.49] 0.73
Foreign born 0.08 [0.27] 0.18 [0.38] 32.81
Less than high school degree 0.43 [0.50] 0.50 [0.50] 16.97
High school degree 0.42 [0.49] 0.39 [0.49] −8.17
Any college 0.13 [0.34] 0.11 [0.31] −7.64
Children below age 18 0.3 [0.46] 0.58 [0.49] 66.48
Musculoskeletal disorders 0.37 [0.48] 0.44 [0.50] 17.67 Mental disorders 0.26 [0.44] 0.26 [0.44] 1.42 Circulatory system 0.08 [0.27] 0.04 [0.19] −27.59 Respiratory system 0.03 [0.17] 0.03 [0.16] −4.12 Neurological system 0.06 [0.23] 0.04 [0.19] −12.3 Endocrine diseases 0.02 [0.14] 0.04 [0.20] 14.05
Panel B. Predetermined economic variables
Average indexed earnings ($1,000) 32.76 [23.66] 25.81 [21.25] −39.3 Total transfers ($1,000) 14.81 [14.90] 15.78 [14.06] 8.21 Liquid assets ($1,000, per capita) 23.85 [43.85] 9.63 [21.29] −72.06 Total gross wealth ($1,000, per capita) 173.13 [212.10] 91.81 [105.93] −83.76 Total liabilities ($1,000, per capita) 54.72 [67.25] 38.43 [49.21] −37.97 Disposable income ($1,000, per capita) 26.54 [14.88] 24.08 [13.11] −22.14
DI allowed 0.79 [0.41] 0.13 [0.33]
Observations 240,900 14,092
Notes: Standard deviations [in square brackets]. This table reports descriptive statistics for applicants and appel-lants. The applicant sample consists of all claims made during the period 1992–2003 by individuals who are at most 61 years of age. The appellant sample consists of the subset of applicants who filed an appeal during the period 1994–2005 (see Section II for further details). All characteristics are measured the year before application/appeal unless otherwise stated. The final column reports t-statistics of the test of equality between characteristics of appli-cants and appellants. Variable definitions are as in Table 1.
mortality rates, and moreover, because mental illness typically has an early onset, DI recipients with such diagnoses tend to participate in the program for relatively long periods. With a progressively smaller share of DI recipients either passing away or reaching retirement age in a given year, the DI exit rate has fallen sec-ularly in both countries (see online Appendix Figures A2 and A3). The aging of the Baby Boom cohorts into their peak (near-elderly) disability age brackets has contributed substantially to the expansion of the US DI rolls since the mid-1990s (Liebman 2015).
There are noteworthy differences between the US and Norwegian DI programs. One difference is their income replacement rates. Kostøl and Mogstad (2014) com-pute the replacement rate for a typical Norwegian applicant according to the SSDI rules and the Norwegian program. For the worker they consider, the pre-tax income replacement rate would be 31 percent in the US program and 58 percent in the Norwegian program. These calculations disregard income taxation, dependent bene-fits, and health insurance, however. Both countries’ DI programs provide dependent benefits. In addition, DI recipients in the United States receive health insurance coverage through the federal Medicare program, which is a substantial in-kind bene-fit.19 In Norway, by contrast, all citizens are eligible for health insurance through the Social Insurance System. Another difference concerns the appeals process. Appeals among initially rejected applicants are far more prevalent in the United States than in 19 Autor and Duggan (2006) estimate that Medicare benefits account for approximately 40 percent of the
pres-ent value of an SSDI award.
Figure 1. Trends in DI Receipt in Norway and the United States
Notes: This figure displays trends in DI receipt in Norway and the United States (see Section I). United States trends are based on Autor and Duggan (2006) for 1957–2005 and SSA Office of the Chief Actuary for 2006–2012. Norwegian trends are based on SSA Statistical Supplements. Incidence of DI receipt is defined as the percent of 18 to 67 year-old adults receiving DI benefits in Norway and the percent of 25 to 64 year-old adults receiving DI benefits in the United States.
0 2 4 6 8 10 Incidence of DI receipt (percent ) 1961 1966 1971 1976 1981 1986 1991 1996 2001 2006 2011 Norway US SSDI
Norway, 48 percent in the United States (French and Song 2014) versus 25 percent in Norway, and success rates at appeal are also considerably higher in the United States than in Norway.
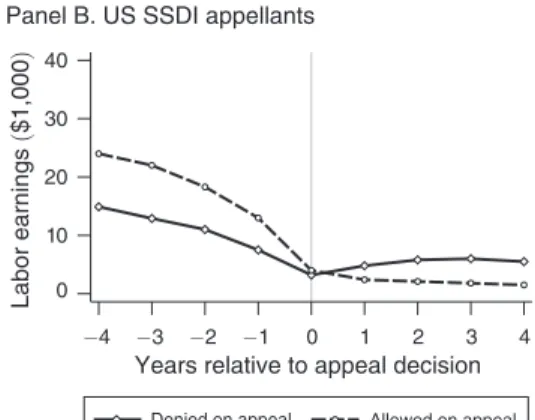
Despite these differences in prevalence, benefits structure, and appeals behaviors, there are important similarities between the applicant, appellant, and participant populations across the two countries. Almost 60 percent of DI recipients in both countries suffer from mental and musculoskeletal disorders (see online Appendix Table A1). And in both countries, appellants are more likely than average applicants to be relatively young, have lower prior earnings, and claim mental and musculo-skeletal disorders (see online Appendix Table A2). As a further comparison among the two programs, Figure 2 uses Norwegian and US data (the latter from Maestas, Mullen, and Strand 2013) to plot earnings trajectories of DI applicants and appel-lants in Norway and the United States, before and after their DI determinations. We focus on years t − 4 through years t + 4 surrounding the initial DI determination (left-hand panels) and the year of the initial appeal decision (right-hand panels).
The patterns are quite similar across the two countries. DI applicants who are allowed at the initial determination have on average substantially higher prior earn-ings than those who are denied. This likely reflects the fact that workers with high prior earnings who seek DI benefits often face severe impairments that necessitate a sudden cessation of employment; conversely, applicants with low prior earnings may in part be compelled to seek DI due to a lack of employment opportunities rather than by severe health shocks per se. Similarly, earnings diverge immediately between allowed and denied appellants following the appeal decision in both coun-tries, and this gap is not closed over the subsequent four post-decision years. The figures in the bottom row plot the difference between denied and allowed applicants (panel E) and appellant labor earnings (panel F) over time, controlling flexibly for observable characteristics and lagged dependent variables (up to the year of the ini-tial decision, after which they are fixed as the mean over the years prior to decision).
III. Assessing the Instrument
We begin our presentation of results by providing evidence on the relevance and validity of the instrument.
A. Instrument Relevance
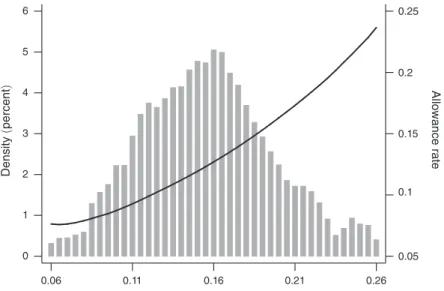
Figure 3 provides a graphical representation of the first stage of our IV model. In the background of this figure is a histogram for the density of judge leniency (con-trolling for fully interacted year and department dummies). The measure of judge leniency is the average judge allowance rate in all other cases a judge has handled, including the judge’s past and future cases that may fall outside of our estimation sample. The mean of the leniency variable is 0.15 with a standard deviation of 0.05. The histogram reveals a wide spread in judge leniency, with a judge at the nineti-eth percentile allowing approximately 18 percent of cases as compared to approxi-mately 8 percent for a judge at the tenth percentile.
The solid line plotted in the figure’s foreground depicts the relationship between judge leniency and the appellant’s allowance rate (controlling for fully interacted
0 10 20 30 40 0 10 20 30 40 Labor earnings ($1,000 ) Labor earnings ($1,000 ) −4 −3 −2 −1 0 1 2 3 4
Years relative to initial decision Initially denied, no appeal
Panel A. US SSDI applicants
−4 −3 −2 −1 0 1 2 3 4
Years relative to appeal decision Panel B. US SSDI appellants
0 10 20 30 40 Labor earnings ($1,000 ) 0 10 20 30 40 Labor earnings ($1,000 ) Labor earnings ($1,000 )
Panel C. Norwegian applicants Panel D. Norwegian appellants
−10 −8 −6 −4 −2 0 −10 −8 −6 −4 −2 0 Labor earnings ($1,000 ) −4 −3 −2 −1 0 1 2 3 4
Years relative to initial decision
Difference, allowed − denied
Panel E. Norwegian applicants
−4 −3 −2 −1 0 1 2 3 4
Years relative to appeal decision
Difference, allowed − denied
Panel F. Norwegian appellants
Initially allowed Denied on appeal Allowed on appeal
−4 −3 −2 −1 0 1 2 3 4
Years relative to initial decision Initially denied, no appeal
−4 −3 −2 −1 0 1 2 3 4
Years relative to appeal decision
Initially allowed Denied on appeal Allowed on appeal
Figure 2. Earnings Trajectories of Allowed and Denied DI Applicants and Appellants
Notes: Panels A through D display changes in the levels of earnings for allowed (dashed line) and denied (solid line) DI applicants (left) and for DI appellants (right) in the nine years surrounding the initial DI determination and the initial outcome at appeal in the United States (top row, sourced from Maestas, Mullen, and Strand 2013), and for Norway (middle row). For the Norwegian data, the applicant sample consists of all claims made during the period 1998–2003 by individuals who are at most 61 years of age. The appellant sample filed an appeal during the period 1998–2005 (see Section II for further details). Panels E and F plot the difference between denied and allowed appli-cants (E) and appellant labor earnings (F) over the same period, controlling flexibly for observable characteristics and lagged dependent variables (up to the year of the initial decision, after which they are fixed as the mean over the years prior to decision). The dashed lines in the bottom row represent 90 percent confidence intervals, where each yearly difference is estimated separately with flexible controls for individual characteristics comprising application year dummies, dummy variables for county of residence, age at appeal, household size, gender, foreign born, mari-tal status, children below age 18, educational attainment, and number of medical diagnoses, as well as polynomials of lagged averages of earnings and disposable income (not including observations after the decision). Nominal val-ues are deflated to 2005 and represented in US dollars using the average exchange rate NOK/$ = 6.
year and department dummies). The graph is a flexible analog to the first-stage equa-tion (1), where we plot a local linear regression of individual allowance outcomes against judge leniency. The individual allowance rate is monotonically increas-ing in our leniency measure, and is close to linear. A 10 percentage point increase in the judge’s allowance rate in other cases is associated with an approximately 8 percentage point increase in the probability that an individual appellant’s case is allowed.
Table 3 presents estimates of our first equation for the relationship between judge leniency and DI allowance rates at appeal (1). In each column, we regress a dummy variable for whether an individual is allowed DI at appeal on the judge leniency measure. We include fully interacted year and department dummies in panel A but otherwise include no other controls. The four columns of the table correspond to years 1 through 4 following appeal. These columns are identical except for the very modest impact of sample attrition (less than 3 percent over four years) stemming from death or emigration of appellants.20 The point estimate of approximately 0.82 is essentially identical across columns, indicating that attrition exerts a negligible impact on the first-stage relationship. All else equal, assignment to a judge with a 10 percentage point higher overall allowance rate increases the probability of receiving an allowance by 8.2 percentage points.
20 Column 1 of Appendix Table A5 documents that the assignment variable (judge leniency) does not affect the
probability that an appellant either dies or emigrates during the outcome period.
0.05 0.1 0.15 0.2 0.25 Allowance rate 0 1 2 3 4 5 6 Density (percent ) 0.06 0.11 0.16 0.21 0.26
Judge leniency (leave-out mean judge allowance rate) Figure 3. Effect of Judge Leniency on DI Allowance
Notes: This figure displays the estimated effect of judge leniency on DI allowance among appellants. Baseline esti-mation sample consists of individuals who appeal an initially denied DI claim during the period 1994–2005 (see Section II for further details). There are 75 unique judges. The solid line plots a local linear regression of allowances on judge leniency while including fully interacted year and department dummies. A histogram of judge leniency is plotted in the background.
B. Instrument Validity
Table 1 provides strong empirical support for the claim that the DI system in Norway randomly assigns appeal judges within each department and year. Panel B of Table 3 provides a second confirmation of this fact: adding controls for appellant characteristics to the regression model has almost no effect on the point estimates, consistent with random assignment of appellants to judges.
This random assignment mechanism is sufficient for consistent estimation of the reduced-form effect of judge leniency on appellant outcomes. However, to interpret the IV estimates of equations (1) and (2) as the causal effects of DI allowances on appellant outcomes requires two further assumptions. The first is that judge leniency affects appellant outcomes of interest only through its impact on the appellant’s allowance decision. This exclusion restriction appears particularly likely to hold in Norway, where all appeals are presented in writing, individuals (and their families) observe only judges’ allowance or denial decisions, and there is no personal contact between judges and appellants. One potential violation of the exclusion restriction could occur if appeals processing times differed systematically with judge leniency and, moreover, exerted an independent effect on appellant outcomes (as explored in Autor et al. 2017). To test this possibility, we calculated each judge’s average pro-cessing time based on the residual average propro-cessing time in his or her other cases. Panel C of Table 3 shows that the first-stage estimates do not change appreciably when controlling for judge processing time.
Table 3—First Stage: Judge Leniency and DI Allowance Years after decision
1 2 3 4
Panel A. No covariates
Judge leniency 0.818 0.819 0.821 0.828
(0.082) (0.084) (0.083) (0.083) Panel B. With individual covariates
Judge leniency 0.793 0.792 0.794 0.800
(0.078) (0.081) (0.080) (0.080) Panel C. With judge characteristics
Judge leniency 0.808 0.811 0.815 0.822
(0.074) (0.075) (0.074) (0.075)
Dependent mean 0.13 0.13 0.13 0.13
Observations 13,972 13,842 13,709 13,607
Note: Standard errors (in parentheses) are clustered at the judge level. This table reports the first-stage coefficients of equation (1). The baseline estimation sample consists of individuals who appeal an initially denied DI claim during the period 1994–2005 (see Section II for further details). There are 75 unique judges. In panel A, DI allowance is regressed on judge leniency and fully interacted year of appeal and department dummies. Panel B includes flexible con-trols for individual characteristics: fully interacted year and department dummies, and dummy variables for month of appeal, county of residence, age at appeal, household size, gender, for-eign born, marital status, children below age 18, education, and number of medical diagnoses. Panel C also controls for judge leave-out-mean processing time.
The second condition needed for a causal interpretation of the IV estimates is that the judge leniency instrument has a monotonic effect on DI allowances.21 Monotonicity requires that, for each appellant, the probability of being allowed at appeal would be at least as high if assigned to a strict judge (low value of Z ) as if assigned to a lenient judge (high value of Z ). Since no individual can be assigned to two different judges at the same point in time, it is impossible to verify this assump-tion. There are, however, some testable implications which would allow us to reject the assumptions. The first testable implication we consider is that the first stage estimate should be non-negative for any subpopulation. If this were not the case, we would infer that the judges whom we estimate to be more lenient on average are stricter toward a subset of cases. Reassuringly, when separately estimating the first stages based on the (predetermined) observable characteristics of the individual, we find that the estimates are consistently positive and sizable, consistent with the monotonicity assumption (see online Appendix Table A3).
As a second check on this threat to validity, we directly examine whether judges who are stricter toward one subset of appellants (e.g., young appellants, those with mental disorders) are also relatively strict toward the complementary group of appellants (e.g., older appellants, those without mental disorders). We perform this test by again partitioning the data into the subpopulations that were used in the prior test, but in this case, we recalculate the leniency instrument for each subpopulation to be the judge’s leniency for cases outside of the subpopulation. For example, when assessing the effect of judge leniency on allowances for male appellants, we calcu-late judge leniency using only decisions in cases with female appellants. Column (2) of online Appendix Table A3 reports these results. All estimates using this redefined instrument are positive and statistically significant, consistent with the maintained assumption that leniency is a judge-specific attribute that characterizes judges’ deci-sion-making across the panoply of cases that they are assigned.
IV. Impacts of DI allowances on the Appellants
This section investigates the impacts of DI allowances on the labor earnings, DI benefits, and total transfers received of the appellants. These results lay the ground-work for the analysis in the next section of the household impacts and fiscal costs of DI allowances.
A. Effects on Labor Earnings and DI Benefits
In panels A through C of Table 4, we report 2SLS estimates of equations (1) and (2) with DI participation, DI benefits payments, and labor earnings as dependent variables in the second stage. As in Table 3, we separately estimate the effects of the initial appeal decision on outcomes for each of the four subsequent years. All speci-fications control for observable case characteristics and include a full set of year by department dummies.
21 If the treatment effect of the disability determination were constant among appellants, the monotonicity
assumption would be unnecessary. But we do not find the constant treatment effect assumption plausible in this setting.
The first two panels consider the impact of being allowed at the appeal on DI par-ticipation and benefits payments. Column 1 of panel A reports a 2SLS point estimate of 0.989 , indicating that allowances induced by judge leniency increase DI receipt almost one-for-one in the first year following appeal.22 Over the first four years following appeal, the causal effect of being allowed at the appeal on subsequent DI receipt falls by approximately one-half, from 0.99 to 0.47, reflecting the fact that a substantial fraction of appellants who are initially denied DI benefits reapply and are ultimately allowed.23 Panel B displays analogous estimates for DI benefit
22 Note that 0.989 = 0.784/0.793 , where 0.793 is the corresponding first-stage coefficient from Table 3, panel
B, column 1.
23 Although this pattern could also be consistent with successful appellants exiting the DI program in years 2
through 4, such exits rarely occur.
Table 4—Effect of DI Allowance on Labor Earnings, DI Benefits, and Transfer Payments of the Appellant
Years after decision
1 2 3 4 Average Panel A. DI participation Allowed DI 0.989 0.727 0.646 0.470 0.707 (0.071) (0.102) (0.098) (0.084) (0.078) Dependent mean 0.305 0.432 0.519 0.577 0.456 Panel B. DI benefits($1,000) Allowed DI 16.240 12.596 10.203 8.167 11.883 (1.539) (1.696) (1.660) (1.567) (1.316) Dependent mean 5.708 8.377 10.277 11.502 8.921 Panel C. Earnings($1,000) Allowed DI −6.791 −5.946 −5.577 −5.660 −5.178 (2.765) (2.877) (2.952) (2.706) (2.275) Dependent mean 14.240 14.282 13.802 13.245 13.813 Panel D. Total transfers($1,000)
Allowed DI 10.188 8.807 8.148 6.429 8.072
(2.736) (2.749) (2.433) (2.683) (2.499) Dependent mean 19.567 20.072 20.54 21.053 20.305 Panel E. Non-DI transfers($1,000)
Allowed DI −6.308 −3.744 −1.884 −1.611 −3.823
(3.273) (2.656) (2.062) (2.525) (2.298) Dependent mean 14.009 11.839 10.398 9.666 11.521 Observations 13,972 13,842 13,709 13,607 13,972 Notes: Standard errors (in parentheses) are clustered at the judge level. This table reports instru-mental variables estimates of the causal effect of receiving a DI allowance at the appeal stage on DI participation (panel A), annual DI benefits (panel B), and annual labor earnings (panel C), annual total transfers inclusive of DI benefits (panel D), and annual transfers excluding DI ben-efits (panel E). Columns 1–4 report separate estimates for each year, whereas column 5 reports estimates for the average outcome over the four year period. The baseline sample consists of individuals who appeal an initially denied DI claim during the period 1994–2005 (see Section II for further details). There are 75 unique judges. All regressions include fully interacted year and department dummies, dummy variables for month of appeal, county of residence, age at appeal, household size, gender, foreign born, marital status, children below age 18, education, and a number of medical diagnoses. All control variables are measured prior to appeal.
payments. Receiving a DI allowance at appeal leads to a large increase in benefit payments relative to the alternative outcome, with this increment equal to $16,240 in the first year. This contrast declines over time due to successful DI reapplications, reaching $8,167 in year 4. Over the initial four years following appeal, receiving a DI allowance increases DI benefit payments by approximately $11,900 per annum.
Panel C of Table 4 displays analogous estimates for annual labor earnings of DI appellants. DI allowances have sizable negative causal effects on labor earn-ings. Receiving a DI allowance on appeal reduces annual earnings by approximately $6,800 in the first year after appeal, equal to approximately 40 percent of the annual DI transfer benefit received. Distinct from the steeply declining causal effect of an initial allowance on DI participation and DI transfers, the causal effect of an initial DI allowance on appellant earnings declines only modestly over the four years fol-lowing the initial appeal outcome. Thus, over the first four years folfol-lowing appeal, receiving a DI allowance reduces labor earnings by around $5,200 per annum.
The estimates in Table 4 can be interpreted as local average treatment effects (LATE) for appellants whose DI decisions are affected by the instrument (i.e., the compliers), meaning they could have received a different allowance decision had their case been assigned to a different judge. As shown in Imbens and Rubin (1997), we can decompose these LATEs to draw inference about what compliers would have received in DI benefits and earned in labor income if denied or, alternatively, if allowed at appeal. These potential outcomes for compliers may be recovered by combining (i) the shares of never-takers and compliers to the instrument with (ii) the average observed outcomes of individuals who were not allowed with the most lenient or strictest judges (that is, those facing the highest and lowest values of the instrument).24
In online Appendix Figure A4, we implement these calculations to decompose the LATE into the potential outcome of appellant compliers if denied or, alterna-tively, if allowed. Relative to the regression estimates in Table 4, the figure plots lev-els of potential outcomes rather than simply depicting the LATE contrast between potential outcomes in the two states. Although many denied appellants reapply for, and eventually receive, DI benefits (Table 4), we find that labor earnings of com-pliers who are denied at appeal change little following denial. In contrast, labor earnings of compliers allowed at initial appeal fall steeply, particularly in the year of allowance and the year immediately thereafter. This pattern suggests that among the population of denied compliers, a small but non-negligible subset persists in employment following denial, while a larger group works minimally and pursues further appeals.
B. Benefit Substitution in Response to DI Denial
As in many European countries, DI is one of several transfer programs avail-able to Norwegians, and those whose DI claims are denied may potentially substi-tute toward these other programs. Conversely, DI beneficiaries may also seek other
24 Imbens and Rubin (1997) show how to derive the potential outcomes of compliers with and without treatment
in settings with a binary instrument. Dahl, Kostøl, and Mogstad (2014) extend this to settings with multi-valued or continuous instruments. We follow the procedure of Dahl, Kostøl, and Mogstad (2014).
transfer benefits following the award of DI benefits. Key transfers programs other than DI benefits are social assistance (i.e., traditional welfare benefits), housing ben-efits, and vocational rehabilitation benefits.
Panels D and E of Table 4 report 2SLS estimates of the impact of an initial DI allowance on total transfers (DI benefits plus all other cash transfers) and cash transfers excluding DI benefits. These estimates point to the importance of accounting for benefit substitution when considering the impacts of disability allowances on household incomes and public expenditure: the net impact of a DI allowance on total transfers received is about 20 to 40 percent smaller than its gross impact, with the largest discrepancies in the first two years following the initial appeal decision. On average, the net impact of a DI allowance on total transfers is about $8,100 per annum, approximately $3,800 less than the estimated gross impact on DI benefits. Both of the average increase in total transfers and the average decline in non-DI transfers are significantly different from zero at the 10 percent significance level.
In online Appendix Figure A5, we decompose the LATE estimates for benefit receipt into potential outcomes for compliers when allowed and when denied. When compliers are awarded DI benefits, we see a sizable fall in their payments from non-DI transfer programs, indicating benefit substitution. Non-DI transfer payments change little in the year following appeal when compliers are denied DI, however. As many compliers who were denied at initial appeal successfully reapply for DI, their DI payments rise and non-DI transfers fall in the years after the initial denial. The fact that the net impact of a DI allowance on appellant transfer payments is smaller than its gross impact indicates that DI and non-DI transfer programs serve as substitutes. In Section VI, we explore whether spousal labor supply provides an additional margin through which married appellants may buffer household income in the event of DI denial.
V. Household Impacts and Fiscal Costs of DI Allowances
In Table 5, we present estimates of the income and consumption gains that house-holds obtain from DI allowances, and compare these gains with the fiscal costs that other taxpayers bear. This table reports 2SLS estimates of the impact of allowances versus denials at appeal on disposable income and consumption as well as fiscal costs inclusive of DI transfer payments, benefit substitution to or from other trans-fer programs, and induced changes in tax receipts. Panel A uses the full sample of appellants, while panel B restricts the sample for whom we have detailed measures of household consumption expenditure.25 To facilitate comparison across holds of difference size, we divide the outcomes by the size of the appellant’s house-hold (so that both income gains and fiscal costs are per capita).
Despite both countervailing behavioral responses and countervailing transfer program interactions documented above, DI allowances nevertheless yield
25 There is no evidence of a significant effect of judge leniency on the likelihood of being excluded from the
full sample, as shown in the fourth column of online Appendix Table A5 , indicating that our estimates based on the restricted sample are unlikely to be biased by endogenous compositional changes. For details on the measurement of consumption expenditure, see Eika, Mogstad, and Vestad (2017).