HAL Id: hal-02733034
https://hal.inrae.fr/hal-02733034
Submitted on 2 Jun 2020HAL is a multi-disciplinary open access archive for the deposit and dissemination of sci-entific research documents, whether they are pub-lished or not. The documents may come from teaching and research institutions in France or abroad, or from public or private research centers.
L’archive ouverte pluridisciplinaire HAL, est destinée au dépôt et à la diffusion de documents scientifiques de niveau recherche, publiés ou non, émanant des établissements d’enseignement et de recherche français ou étrangers, des laboratoires publics ou privés.
Industrially-processed versus home-prepared dishes:
what economic benefit for the consumer?
Marion Tharrey, Sophie Drogue, Lisa Privet, Marlène Perignon, Christophe
Dubois, Nicole Darmon
To cite this version:
Marion Tharrey, Sophie Drogue, Lisa Privet, Marlène Perignon, Christophe Dubois, et al.. Industrially-processed versus home-prepared dishes: what economic benefit for the consumer?. Public Health Nutrition, Cambridge University Press (CUP), 2020, 23 (11), pp.1982-1990. �10.1017/S1368980019005081�. �hal-02733034�
Industrially-processed versus home-prepared dishes: What economic benefit for
the consumer?
Marion Tharrey1,*, Sophie Drogué1, Lisa Privet2, Marlène Perignon1, Christophe Dubois3 and Nicole Darmon1
1MOISA, Univ Montpellier, CIRAD, CIHEAM-IAMM, INRAE, Institut Agro, Montpellier,
France
2MS-Nutrition, Marseille, France
3Trophis, Marseille, France
Corresponding author: Email mariontharrey@hotmail.fr
ABSTRACT
Objective: To cope with pressure of modern life, consumer demand for convenience foods has increased in the last decades. This study set out to compare the costs of buying industrially-processed dishes and of preparing them at home.
Design: Direct purchase costs of industrially-processed dishes frequently consumed in France (n=19) and of the ingredients needed for their home-prepared counterparts (n=86) were collected on four major food retailers websites in Montpellier, France. Mean prices and energy density were calculated for 4 portions. Costs related to energy used by cooking appliances and time spent preparing were further estimated.
Setting: Montpellier, France. Participants: Not applicable.
Results: Based on the costs of ingredients and energy used for cooking, dishes prepared at home cost less (-0.60 €/4 portions, P < .001) than industrially-processed dishes, but when the cost of the time spent was taken into account, the industrially-processed dishes were much cheaper
(−5.34 €/4 portions, P < .001) than their home-prepared counterparts. There was no difference in energy density between industrially-processed and home-prepared dishes.
Conclusions: Our findings suggest that industrially-processed dishes are economically more
profitable to consumer when the cost of time for preparing dishes at home is valued. Given the ever-greater demands of everyday life, more account should be taken of the additional cost to consumers of the time they spend preparing meals at home.
Keywords: food, diet, cost, nutrition, cooking, home, supermarket.
Version post-print. Published in Public Health Nutrition, 2020 DOI: https://doi.org/10.1017/S1368980019005081
INTRODUCTION
Economic and social changes in recent years have strongly oriented food consumption habits and patterns toward convenience (1,2). These changes have resulted in an increased consumption of processed foods (canned vegetables, ready-to-eat foods, etc.) at the expense of fresh products prepared at home (fresh fruits and vegetables, potatoes, meat, fish, eggs, etc.) (3). In particular, home-prepared dishes are increasingly replaced by industrially-processed dishes needing only minimal preparation before consumption. In France, such industrial dishes have increased significantly in food-at-home purchases over the last 40 years (from 0.6 g to 56.6 g/10 MJ of purchase between 1973 and 2010) (3), while time spent cooking at home has decreased since 1985 with a large increase of days where households do not cook at all (4). However, cooking remains strongly gendered, with women being much more likely than men to be engaged in everyday home food preparation. According to Etilé and Plessz, French women living in couple in 2010 were spending on average 56 minutes per day preparing meals, i.e. 77% of the time spent cooking by French couples (4). Meanwhile, home meal preparation is increasingly advocated by nutritionists and public health professionals as a way to improve health (5). Poorer cooking skills have been
associated with more ready meal consumption, poorer dietary quality and overweight (6–10).
Programs designed to improve cooking skills have long targeted low-income groups (11), since diet quality declines with socioeconomic status (12). However, contrary to popular belief, disadvantaged households mostly prepare their food at home, though may lack motivation and time for cooking from scratch(9,13,14). They face economic, time and practical constraints (transportation, food storage and food preparation) that may increase reliance on cheap convenience food products(15,16). In the French population, food-insecure individuals were found to have not only an inadequate intake of fruits, vegetables and fish, but also a high intake of refined grains and sweet foods(17). The latter are
cheaper source of calories, require less food preparation, and are less perishable than fresh foods, and so less likely to be wasted (18). However, little is known about consumption of industrially-processed dishes since national dietary surveys do not differentiate between industrially-industrially-processed and home-prepared dishes. It is acknowledged that convenience and time saving are the key motivations behind industrial ready meal consumption, but conclusions on cost saving motivation are conflicting (19–22). In France, the idea that cooking at home is a way of saving money is spread by several stakeholders such as dieticians, social workers or others. For instance, a marketing campaign is currently promoting the home-preparation of fresh fruit and vegetables for budgetary reasons (23). This study set out to assess whether buying industrially-processed dishes rather than preparing similar dishes at home is cost-effective for consumers considering purchase cost and additional costs of meal preparation, namely energy used by cooking appliances and time spent.
METHODS
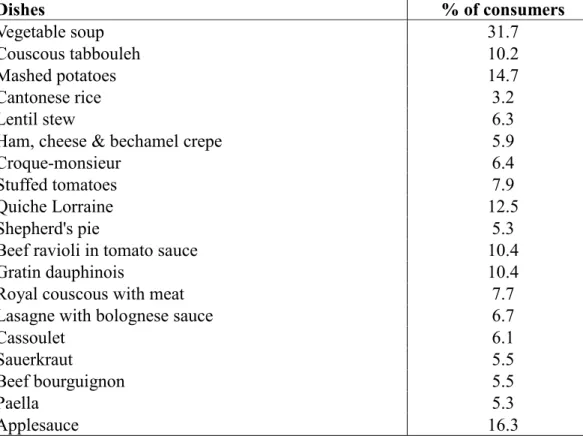
Selection of dishesDishes the most commonly consumed by the French population were identified based on data from the French Individual and National Dietary Survey 2006-2007 (INCA2), in which a nationally representative sample of the French population reported all foods consumed over a one-week period (24). Nineteen dishes easily available from food retailers in industrially-processed format were
selected for the present study. Table 1 lists the 19 selected dishes with the corresponding percentage of reported consumption from INCA2.
A flow diagram of the methodology used in the study is presented in Figure 1.
The cost of the industrially-processed dishes and the cost of ingredients used to prepare similar dishes at home were obtained from prices listed on the websites of major food retailers located near the city of Montpellier (only one location to limit geographical price variations), during December 2016 (only one period to limit food price changes over time). Of the seven food retailers identified (Carrefour, Auchan, Leclerc, Leader Price, Dia, Super U and Lidl), three did not provide the required information on their websites, limiting the study to Carrefour, Auchan, Leader Price and Super U. Given the wide range of prices between low-cost foods and their brand-name equivalents (25,26), only retailers’ own-brand foods were selected when available; otherwise the cheapest
alternative was chosen. Screenshots of retailers’ websites were taken to keep records of food product information (packaging, description, nutritional values, price displayed). All values were expressed for 4 portions (4p).
Industrially-processed dishes.
Prices of processed dishes were collected in €/unit sold and €/100 g. When industrially-processed dishes were not available in packages of 4 portions, it was considered that consumers would buy several smaller packages to make 4 portions. Information on portion size was obtained from package labels. When an industrially-processed dish was not sold by a food retailer, a price was imputed corresponding to the mean price of the same product offered by the other food retailers.
Home-prepared dishes
The INCA2 recipe table, providing the ingredient contents for 100 g of food as consumed (e.g. already peeled or cooked), was used to estimate the ingredient content of the 19 dishes. Ingredients present in proportions below 0.1% were ignored. For each item, the cost was first calculated for
100 g as consumed by multiplying the cost of each ingredient recorded on the food retailers’ website (in €/100 g as purchased) with its proportion in the recipe. When several package sizes were
available for the same ingredient, the cost of the smallest one sufficient for the recipe was selected, assuming that leftover ingredients were not wasted but kept for subsequent use. Since the
ingredients content listed in the INCA2 recipe table are provided ‘as consumed’ (e.g. already peeled or cooked), while food retailers’ websites display the price of foods as purchased, a correction coefficient was used to convert from quantity of ingredient as purchased to quantity of ingredient as consumed (e.g., the quantity of cooked pasta is equivalent to 3 times the corresponding quantity of raw pasta). The cost of the dish was then calculated, as follows:
Cost of ℎ𝑜𝑚𝑒_𝑝𝑟𝑒𝑝𝑎𝑟𝑒𝑑_𝑑𝑖𝑠ℎ (in €/100 g as consumed) = ∑𝐶𝑜𝑠𝑡𝑖 × 𝑄𝑖 𝑐𝑜𝑒𝑓𝑖 𝑛
𝑖=1
where Costi is the cost of each ingredient used in the recipe (in €/100 g as purchased), 𝑄𝑖 is proportion of that ingredient used in 100g of recipe, and coefi is the correction coefficient used to
convert the quantity of that ingredient as purchased to the quantity as consumed.
The dish cost was then converted into €/4p, one portion being estimated by the average portion size of the corresponding industrially-processed dish from the four retailers.
Energy cost
Cooking instructions (cooking methods and time) were used to compute the energy used in preparing the dish. For the industrially-processed dishes, cooking instructions were taken directly from the package. For the home-prepared dishes, cooking instructions were taken from the most active French online food community (marmiton.org), considering the recipe closest to that of INCA2. When several cooking methods were suggested (e.g., oven, microwave, hotplate), they
were all considered in the calculation and a mean energy value was used. For the hotplate, three types were considered (induction, ceramic, gas) and again, a mean value was used. The power consumption (kWh) of each cooking appliance was inferred from the most efficient power appliance available from a French retail company specialized in home appliances and consumer electronics. The cost of energy used to prepare the dish at home was finally computed by multiplying the power consumption of each cooking appliance used in the recipe by the corresponding cooking time and energy cost in France in 2017 (27).
Time cost
In economic approaches, two methods are often used to assign a value to time spent on household production: the market cost estimate and the opportunity cost estimate. The opportunity cost estimate is generally valued as the wage rate (28). The market cost estimate consists in assigning a monetary value to labor inputs directly (29). We chose the latter method to value the cost of time. This market value of time was computed based on the time needed to prepare the dish hands-on (i.e., cooking time excluded) recorded on the French online food community marmiton.org. We assessed the market cost of the time spent in the home productive activity as equal to the guaranteed minimum wage in France (SMIC), that is to say the salary paid to an unskilled cook. The gross rather than net SMIC was chosen, because we wanted to assign a value to the dish produced, and so the cost of time could not be considered net of taxes (29). Time spent doing grocery shopping, unpacking and storing food products was not taken into account because these activities concern both industrially-processed and home-prepared meals.
Energy-dense foods (30,31) and energy-dense diets (32,33) tend to be nutrient-poor. In addition, energy-dense diets induce overeating and weight gain (34). We, therefore, used energy density (kcal/100 g) as an indicator of poor nutritional quality. The energy density of industrially processed dishes was obtained from package labels, and the energy density of home-prepared counterparts was estimated based on the recipes.
Statistical analyses
Differences in cost and energy density were assessed according to “preparation type” (i.e., industrially-processed or home-prepared) using two-way analysis of variance. “Dish type” (i.e., vegetable soup, couscous tabbouleh, etc.) and food retailer were used as a first set of adjustment variables. Regarding the cost of dishes, a first analysis tested difference in purchase costs. Additional costs of energy used and cost of time spent for preparing dish at home were then successively included to test differences in overall cost. All dependent variables were
logarithmically transformed to improve normality. In case of a significant interaction between “dish type” and “preparation type” for the overall sample, simple effects tests were conducted to examine the effect of “preparation type” for each dish, separately(35).
All analyses were performed with the SAS statistical software package Ver. 9.4 for Windows (SAS Institute, Cary, NC, USA); P < 0.05 was considered statistically significant. The research did not involve humans therefore no institutional review board (IRB) approval was necessary.
RESULTS
A total of 76 prices were obtained for industrially-processed dishes (i.e., 19 different dishes
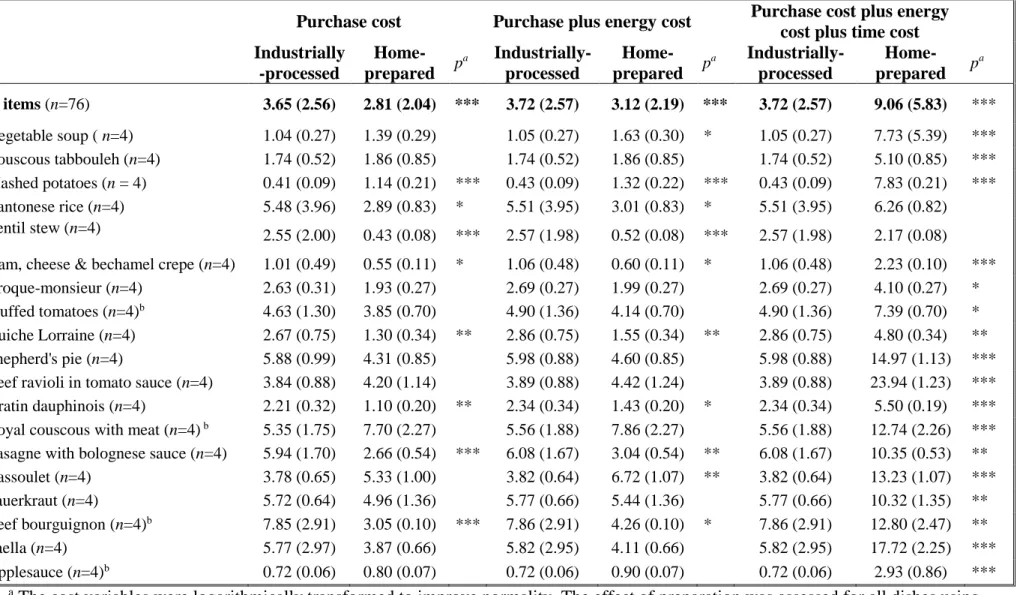
distributed by 4 retailers). In most cases (i.e., 86%) the price collected was that of the retailer’s own-brand product. However, when a retailer’s own-own-brand was not available for a given dish, we used either the price of the in-store cheapest alternative (8% of cases) or (when the dish was not available at all on the retailer’s website) the mean price of the same dish from the other food retailers (6% of cases). For the ingredients, 344 prices were collected. All the ingredients needed to prepare the dishes at home were available on each food retailer’s website, despite the retailer's brand was not available for 12% of them. Means and standard deviations of costs of the 19 dishes according to “preparation type” (industrially-processed or home-prepared) are given in Table 2.
Considering only the purchase cost, industrially-processed dishes were on average 0.84 €/4p more expensive than their home-prepared counterparts [3.65 (SD 2.56) vs. 2.81 (SD 2.04) €/4p,
respectively; P < .001]. A significant interaction was found between “dish type” and “preparation type” (p < 0.001). Simple effects analyses showed that only 8 of the 19 dishes were significantly cheaper when prepared at home.
Warming up industrially-processed dishes incurred a lower energy cost than cooking home-prepared dishes [mean additional cost of 0.07 € (SD 0.08) vs. 0.32 € (SD 0.36) respectively]. When adding the energy cost to the purchase cost, industrially-processed dishes still cost on average 0.60 €/4p more than their home-prepared counterparts [3.72 (SD 2.57) vs. 3.12 (SD 2.19) €/4p, respectively; P < .001].
When the value of the time spent preparing the dish at home was further added to the other costs, industrially-processed dishes were on average 5.34 €/4p cheaper than their home-prepared
counterparts [3.72 (SD 2.57) vs. 9.06 (SD 5.83) €/4p, respectively; P < .001]. Compared to the other costs, the cost of time was high and highly variable [mean: 5.93 €, range: 1.63 € (for lentil stew) – 19.5 € (for beef ravioli) (data not shown). Simple effects analyses revealed that dishes had a
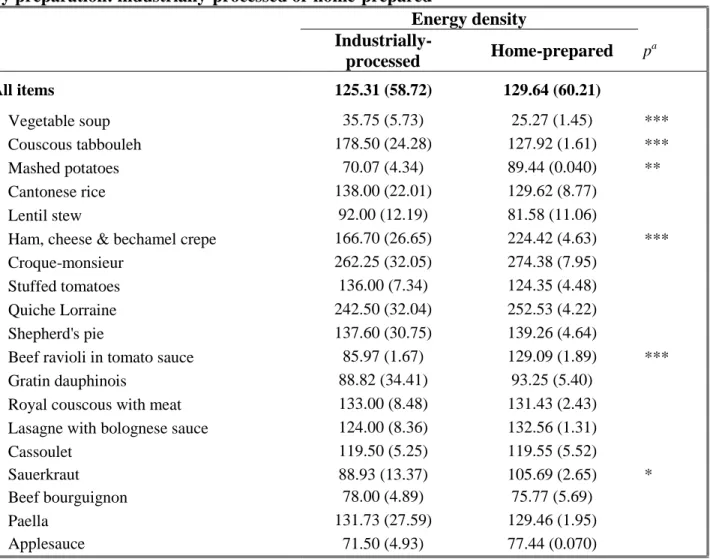
significantly higher time-included cost when they were prepared at home, except for Cantonese rice and lentil stew. These last two are relatively fast and easy to prepare at home and the associated time cost was too low to offset the relatively high purchase cost of the industrial format. Energy density of the 19 dishes according to “preparation type” is given in Table 3. Energy density was similar between industrially-processed and home-prepared dishes (p = 0.103). However, a
significant interaction between “dish type” and “preparation type” (p < 0.001) was found, meaning that the energy density differential varied widely depending on the type of dish. Simple effects analyses showed that 4 of the 19 dishes had a lower energy density in their industrially-processed format, while 2 had a lower energy density in their home-prepared format.
DISCUSSION
To our knowledge, the current study is the first to compare the cost to consumers of buying
industrially processed dishes v. preparing similar dishes at home in a European setting. Based on the data for nineteen dishes commonly consumed in France, results showed that, on average, buying ingredients to prepare these dishes at home costs less than buying industrially processed alternatives in supermarkets (Δ = –0.84 €/4p). When the cost of energy needed to warm up industrially
processed dishes or to prepare and cook the dishes at home was included, home-prepared dishes remained slightly cheaper (Δ = –0.60 €/4p). However, inclusion of the value of time spent in the computation reversed this trend, making home-prepared dishes substantially more expensive than industrially processed ones (Δ = +5.34 €/4p).
Eating at home rather than out of home (especially in fast food restaurants) can help comply with dietary guidelines at no additional cost (36). But, when eating at home, little is known about the cost of consuming industrially processed dishes compared with homemade dishes. Only two studies, in New Zealand and the USA, have analysed cost differences across meals or dishes of varying convenience (37,38). The study in New Zealand found that it is less expensive to cook from scratch than buying takeaways, due to the inclusion of the cost of time spent waiting in fast-food outlets in the cost of takeaways (37). However, in our study, industrially processed dishes and basic ingredients both came from supermarkets, and therefore the waiting time was considered equal and not included in the calculation. In the US study, the total cost of meals (i.e. including the cost of time) was
always higher when cooking from scratch than when using more processed ingredients, even if the processed foods cost more than the basic ingredients (38), which is fully in line with our results. The industrially processed dishes included in the current study are widely sold on the French market. Since food retailers can offer low selling prices through economies of scale (bulk purchase of raw materials, optimisation of processing, etc.), industrially processed dishes might have been expected to cost less than their home-prepared counterparts. However, the price of industrially processed dishes integrates many costs, including processing and retailing costs, possibly explaining that the time-exclusive cost of industrially processed dishes was slightly higher than that of home-prepared dishes. When the time cost was included, industrially processed dishes were much less costly than the counterpart, home-prepared ones. Even though we estimated the value of time based on a minimum wage, the time cost was still substantial compared with other costs, showing the importance of the time component when assessing overall costs. In the current study, the value of time was calculated based on hands-on preparation time rather than the full preparation time (hands-on + cooking time), because it was assumed that the meal preparer could engage in other activities
during cooking time (37,38). Since cooking time was not included for home-prepared dishes, time cost was not retained either for industrially processed dishes as they needed only warming up.
Literature reviews conclude that the impact on long-term dietary behaviour or health outcomes of cooking at home is not clear, although most cross-sectional studies have found a positive
relationship between cooking and dietary quality (11,39). Indeed, the positive association between the consumption of food prepared at home and dietary quality is generally weak (40), and a healthy diet can be achieved with low amounts of food prepared at home (41). In France, Méjean et al. found that a score for preparation from scratch was prospectively associated with a decreased risk of obesity over 5-year follow-up (in women only), but this relation was entirely explained by confounding factors, especially a higher intake of fruit and vegetables in women with a high score for preparation from scratch (42). In prospective cohort studies of health professionals in the USA, a lower risk of developing diabetes was found for individuals who eat meals prepared at home more frequently than those with frequent consumption of meals prepared out of home, especially fast-foods (43). In
contrast, in another US cohort of multi-ethnic/racial, middle-aged women across 14 years of follow-up, women who spent more time preparing and cleaning up meals had a greater likelihood over time of developing a metabolic syndrome (44). It is noticeable that this last study cannot be generalised due to the specificity of the studied population. However, the authors hypothesised that, in this population, home preparation methods could lead to unhealthy meals consumed in high portions while relatively healthy, convenient products in standard portions are increasingly available, and they concluded that ‘public health interventions should place greater emphasis on cooking healthfully, not just cooking frequently’.
It is true that when preparing food at home, individuals have the possibility to control the quality and quantity of ingredients used in the recipe and, therefore, the nutritional quality of the meal(45).
However, home cooking is no guarantee of good nutritional quality and healthiness (46). Howard et al. found that meals proposed by TV chefs were less healthy than ready meals sold by supermarkets, and contained significantly more energy, protein, fat and saturated fat, and less fibre per portion than the ready meals, while no difference was found for sugar and salt (47). Similarly, we found no difference in energy density between industrially processed dishes and their home-prepared counterparts.
Many factors influence the decision of cooking at home and the way it is done (48). Cooking can be perceived as a chore more than a valued occupation, but the use of ready meals can also generate negative feelings such as guilt and regret for not making a ‘proper meal’ for oneself or one’s family, especially among women who remain central figures in meal preparation (4,49,50). In the current study, the time spent for home preparation of a four-portion dish was 36·5 min on average (data not shown), which corresponds approximately to half the time spent cooking per day and per couple in France in 2010 (4). Some people cannot afford spending that time, especially single women with children and people with staggered schedules or with long commuting times (39). The preparation of meals at home has evolved considerably in recent years from cooking from scratch to more practical cooking using processed ingredients (51). Hence, pre-assembled meals may offer an interesting alternative to cooking from scratch, combining the advantage of controlling the proportions of industrial ingredients (as it allows including fresh products in meal preparation) and of spending less time in the kitchen (51).
The current study has limitations. Firstly, dishes included in the analysis were selected as
representative of dishes commonly consumed by the French population, and so do not necessarily reflect those commonly prepared at home (e.g. beef ravioli are widely consumed in France in their industrial format, but are rarely prepared at home).
Secondly, the prices of products (industrially processed dishes and ingredients) are influenced by several variables, such as location and number of portions purchased. The choice of another location would have only slightly changed the purchase costs, because the main difference in consumption prices in France is primarily driven by the prices of rents and services, not goods, and is between Paris and the rest of the country (52). Regarding the number of portions, redoing the calculations, for example, two persons instead of four, would have increased the price per kilogram of both
industrially processed dishes and of the ingredients to prepare them at home, but would not have changed energy cost and time cost, and thus, the general conclusion that industrially processed dishes present economic advantage when the cost of time is included would not have been affected. Thirdly, it was considered that home-prepared dishes are made from scratch (e.g. the quiche
Lorraine dough was made instead of being purchased at a store). Using pre-prepared items (e.g. industrial dough) might have yielded different results for the cost difference between industrially processed dishes and their home-prepared counterparts. Fourthly, some food items were not available on the retailers’ websites, although only food retailers providing a wide range of own-brand products were selected, resulting in some missing data. Fifthly, methodological choices made when estimating the different costs may have led to some approximation. Regarding the energy cost, the most efficient appliances available on the French market were used as the reference of power consumption. This choice might have underestimated the cost of energy consumption for preparing meals, but did not affect the findings, namely that warming up industrially processed dishes requires less energy than cooking their home-prepared counterparts. Regarding the time cost, the preparation time given on marmiton.org may not be an accurate indication for all individuals depending on their culinary skills. Also, by using the minimum wage (SMIC), the current study might have
but there is no consensus on the most appropriate wage to use (53). These methodological choices can only provide lower-bound estimates of the true costs. In addition, estimating the cost of time at market cost and not at the opportunity cost would impose the assumption of the same time cost for all. The opportunity cost would be higher for an executive and lower for an unemployed person or a person with a part-time job.
Lastly, the nutritional value of dishes was assessed using only the energy density owing to an uncertainty regarding the nutritional content of each dish. In particular, information on the content of added sugars of industrially processed dishes is not available on the nutrition label. Regarding salt, the information exists for industrially processed dishes, but it is not reliable for home-prepared dishes. In addition, we did not take into account one important difference between home-prepared meals and industrially processed dishes, which is the presence of additives, preservatives and other substances (e.g. hydrogenated oils) suspected of harming health when consumed in excess in industrially processed products (54,55). The presence of substances not commonly used in homemade preparations is one important characteristic of the definition of ‘ultra-processed’ foods (56). Another characteristic of ‘ultra-processed’ products is their high energy density, recognised as the main factor explaining how the overconsumption of ‘ultra-processed’ diets actually promotes weight gain (57). Nevertheless, the presently studied industrially processed dishes did not share this second
characteristic of ‘ultra-processed’ foods, since they had similar energy density than their homemade counterparts. When consumed appropriately, processed foods, especially when nutrient-dense, have been found to contribute to both food and nutrition security (58).
CONCLUSION
The current study shows that dishes commonly consumed in France are significantly but slightly cheaper when prepared at home than when purchased ready-prepared, considering the direct in-store
price of the dish with or without adding the cost of the energy used to prepare it at home. Adding the time cost in home cooking implies that industrially processed dishes are of better value to the consumer. Considering the benefits of convenience foods against the high demands of everyday life, the indirect cost of food such as the value of time spent must not be ignored, especially for low-income families whose constraints of time, resources and equipment may dissuade them from buying and preparing fresh and perishable foods.
Cooking at home could have positive effects on health, for example, by encouraging the use of fresh vegetables and by facilitating better control over the use of salt and added fats. However, time and cost constraints may prevent people from preparing their own meals. Thus, ensuring the availability of convenient, affordable and nutritious industrially processed dishes could help promote healthy eating while tackling gender and social inequalities.
REFERENCES
1.Buckley M, Cowan C & McCarthy M (2007) The convenience food market in Great Britain: convenience food lifestyle (CFL) segments. Appetite 49, 600–617.
2.Stafford TH & Wills JH (1979) Consumer demand increasing for convenience in food products. National Food Reviews (USA).
3.Caillavet F, Darmon N, Létoile F et al. (2018) Is nutritional quality of food-at-home purchases improving? 1969–2010: 40 years of household consumption surveys in France. Eur J Clin Nutr 72, 220.
4.Etilé F & Plessz M (2018) Women’s employment and the decline of home cooking: evidence from France, 1985–2010. Rev Econ Household 16, 939–970.
5.Flego A, Herbert J, Waters E et al. (2014) Jamie’s Ministry of Food: quasi-experimental
evaluation of immediate and sustained impacts of a cooking skills program in Australia. PloS One 9, e114673.
6.Hartmann C, Dohle S & Siegrist M (2013) Importance of cooking skills for balanced food choices. Appetite 65, 125–131.
7.Van der Horst K, Brunner TA & Siegrist M (2011) Ready-meal consumption: associations with weight status and cooking skills. Public Health Nutr 14, 239–245.
8.Larson NI, Perry CL, Story M et al. (2006) Food preparation by young adults is associated with better diet quality. J Am Diet Assoc 106, 2001–2007.
9.Mclaughlin C, Tarasuk V & Kreiger N (2003) An examination of at-home food preparation activity among low-income, food-insecure women. J Am Diet Assoc 103, 1506–1512.
10.Wolfson JA & Bleich SN (2015) Is cooking at home associated with better diet quality or weight-loss intention? Public Health Nutr 18, 1397–1406.
11.Reicks M, Trofholz AC, Stang JS et al. (2014) Impact of cooking and home food preparation interventions among adults: outcomes and implications for future programs. J Nutr Educ Behav 46, 259–276.
12.Darmon N & Drewnowski A (2008) Does social class predict diet quality? Am J Clin Nutr 87, 1107–1117.
13.Adams J, Goffe L, Adamson AJ et al. (2015) Prevalence and socio-demographic correlates of cooking skills in UK adults: cross-sectional analysis of data from the UK National Diet and Nutrition Survey. Int J Behav Nutr Phys Act 12:99.
14.Méjean C, Hassen WS, Gojard S et al. (2017) Social disparities in food preparation behaviours: a DEDIPAC study. Nutr J 16, 62.
15.Davis GC & You W (2011) Not enough money or not enough time to satisfy the Thrifty Food Plan? A cost difference approach for estimating a money–time threshold. Food Policy 36, 101–107. 16.Grant DK & Maxwell S (1999) Food coping strategies: a century on from Rowntree. Nutr Health 13, 45–60.
17.Bocquier A, Vieux F, Lioret S et al. (2015) Socio-economic characteristics, living conditions and diet quality are associated with food insecurity in France. Public Health Nutr 18, 2952–2961.
18.Darmon N & Drewnowski A (2015) Contribution of food prices and diet cost to socioeconomic disparities in diet quality and health: a systematic review and analysis. Nutr Rev 73, 643–660. 19.Ahlgren MK, Gustafsson I-B & Hall G (2005) The impact of the meal situation on the consumption of ready meals. Int J Consum Stud 29, 485–492.
20.Costa AIA, Schoolmeester D, Dekker M et al. (2007) To cook or not to cook: a means-end study of motives for choice of meal solutions. Food Qual Prefer 18, 77–88.
21.Geeroms N, Verbeke W & Van Kenhove P (2008) Consumers’ health-related motive orientations and ready meal consumption behaviour. Appetite 51, 704–712.
22.Reed Z, McIlveen-Farley H & Strugnell C (2003) Factors affecting consumer acceptance of chilled ready meals on the island of Ireland. Int J Consum Stud 27, 2–10.
23.Interfel. "Home Cooked" advertising campaign, Winter. https://www.interfel.com/campagne-cuisines-maison-hiver/ (accessed June 2019)
24.Lafay L (2009) Report of the National Individual Food Consumption Study 2 (Inca 2) 2006/2007. Maisons-Alfort: French Food Safety Agency.
25.Cooper S & Nelson M (2003) ‘Economy’ line foods from four supermarkets and brand name equivalents: a comparison of their nutrient contents and costs. J Hum Nutr Diet 16, 339–347. 26.Darmon N, Caillavet F, Joly C et al. (2009) Low-cost foods: how do they compare with their brand name equivalents? A French study. Public Health Nutr 12, 808–815.
27.Ministry of Ecological and Solidarity Transition Pegasus [Online Data, Energy and Climate]: Observation and statistics. http://www.statistiques.developpement-durable.gouv.fr/donnees-ligne/telechargement/pegase.html (accessed September 2018).
28.Palmer S & Raftery J (1999) Opportunity cost. BMJ 318, 1551–1552.
29.Chadeau A (1992) What Is a Households’ Non-market Production Worth, Vol. 18. Organisation for Economic Co-operation and Development, Paris.
30.Drewnowski A, Maillot M & Darmon N (2009) Testing nutrient profile models in relation to energy density and energy cost. Eur. J. Clin. Nutr. 63, 674–683.
31.Darmon N, Darmon M, Maillot M et al. (2005) A nutrient density standard for vegetables and fruits: nutrients per calorie and nutrients per unit cost. J Am Diet Assoc 105, 1881–1887.
32.Ledikwe JH, Blanck HM, Khan LK et al. (2006) Low-energy-density diets are associated with high diet quality in adults in the United States. J Am Diet Assoc 106, 1172–1180.
33.Drewnowski A, Monsivais P, Maillot M et al. (2007) Low-energy-density diets are associated with higher diet quality and higher diet costs in French adults. J Am Diet Assoc 107, 1028–1032. 34.Rolls BJ (2009) The relationship between dietary energy density and energy intake. Physiol Behav 97, 609–615.
35.Winer B (1971) Statistical Principles in Experimental Design, 2nd ed. McGraw-Hill, New-York. 36.Tiwari A, Aggarwal A, Tang W et al. (2017) Cooking at home: a strategy to comply with U.S. dietary guidelines at no extra cost. Am J Prev Med 52, 616–624.
37.Mackay S, Vandevijvere S, Xie P et al. (2017) Paying for convenience: comparing the cost of takeaway meals with their healthier home-cooked counterparts in New Zealand. Public Health Nutr 20, 2269–2276.
38.Yang Y, Davis GC & Muth MK (2015) Beyond the sticker price: including and excluding time in comparing food prices. Am J Clin Nutr 102, 165–171.
39.Mills S, White M, Brown H et al. (2017) Health and social determinants and outcomes of home cooking: a systematic review of observational studies. Appetite 111, 116–134.
40.Clifford Astbury C, Penney TL & Adams J (2019) Home-prepared food, dietary quality and socio-demographic factors: a cross-sectional analysis of the UK National Diet and nutrition survey 2008–16. Int J Behav Nutr Phys Act 16, 82.
41.Clifford Astbury C, Penney TL & Adams J (2019) Comparison of individuals with low versus high consumption of home-prepared food in a group with universally high dietary quality: a cross-sectional analysis of the UK National Diet & Nutrition Survey (2008–2016). Int J Behav Nutr Phys Act 16, 9.
42.Méjean C, Lampuré A, Si Hassen W et al. (2018) Influence of food preparation behaviors on 5-year weight change and obesity risk in a French prospective cohort. Int J Behav Nutr Phys Act 15, 120.
43.Zong G, Eisenberg DM, Hu FB et al. (2016) Consumption of meals prepared at home and risk of type 2 diabetes: an analysis of two prospective cohort studies. PLOS Med 13, e1002052.
44.Appelhans BM, Segawa E, Janssen I et al. (2015) Meal preparation and cleanup time and cardiometabolic risk over 14years in the Study of Women’s Health Across the Nation (SWAN). Prev Med 71, 1–6.
45.Lofthouse C, Te Morenga L & McLean R (2016) Sodium reduction in New Zealand requires major behaviour change. Appetite 105, 721–730.
46.Chu YL, Addo OY, Perry CD et al. (2012) Time spent in home meal preparation affects energy and food group intakes among midlife women. Appetite 58, 438–443.
47.Howard S, Adams J & White M (2012) Nutritional content of supermarket ready meals and recipes by television chefs in the United Kingdom: cross sectional study. BMJ 345, e7607. 48.Short F (2006) Kitchen Secrets: The Meaning of Cooking in Everyday Life. Berg, Oxford. 49.Carrigan M, Szmigin I & Leek S (2006) Managing routine food choices in UK families: the role of convenience consumption. Appetite 47, 372–383.
50.Olsen NV, Sijtsema SJ & Hall G (2010) Predicting consumers’ intention to consume ready-to-eat meals. The role of moral attitude. Appetite 55, 534–539.
51.Lang T & Caraher M (2001) Is there a culinary skills transition? Data and debate from the UK about changes in cooking culture. J HEIA 8, 2–14.
52.Fesseau M, Passeron V & Vérone M (2008) Prices are higher in the ile-de-France region than in the provinces – Insee Première – 1210. https://www.insee.fr/fr/statistiques/1281287 (accessed July 2019).
53.Goldschmidt-Clermont L (1993) Monetary valuation of non-market productive time methodological considerations. Rev Income Wealth 39, 419–433.
54.Fiolet T, Srour B, Sellem L et al. (2018) Consumption of ultra-processed foods and cancer risk: results from NutriNet-Santé prospective cohort. BMJ 360, k322.
55.Srour B, Fezeu LK, Kesse-Guyot E et al. (2019) Ultra-processed food intake and risk of cardiovascular disease: prospective cohort study (NutriNet-Santé). BMJ 365, l1451.
56.Monteiro CA, Cannon G, Lawrence M et al. (2019) Ultra-Processed Foods, Diet Quality, and Health Using the NOVA Classification System. Rome: FAO.
57.Hall KD, Ayuketah A, Brychta R et al. (2019) Ultra-processed diets cause excess calorie intake and weight gain: an inpatient randomized controlled trial of adlibitum food intake. Cell Metab 30, 67–77.e3.
58.Weaver CM, Dwyer J, Fulgoni VL et al. (2014) Processed foods: contributions to nutrition. Am J Clin Nutr 99, 1525–1542.
FIGURES
TABLES
Table 1. Nineteen selected dishes commonly consumed by the French population and percentages of adults consuming them based on the French INCA2 survey Dishes % of consumers Vegetable soup 31.7 Couscous tabbouleh 10.2 Mashed potatoes 14.7 Cantonese rice 3.2 Lentil stew 6.3
Ham, cheese & bechamel crepe 5.9
Croque-monsieur 6.4
Stuffed tomatoes 7.9
Quiche Lorraine 12.5
Shepherd's pie 5.3
Beef ravioli in tomato sauce 10.4
Gratin dauphinois 10.4
Royal couscous with meat 7.7
Lasagne with bolognese sauce 6.7
Cassoulet 6.1
Sauerkraut 5.5
Beef bourguignon 5.5
Paella 5.3
a The cost variables were logarithmically transformed to improve normality. The effect of preparation was assessed for all dishes using two-way ANOVA; and for each dish using Simple Effects Test.
b The dish was not available on one retailer’s website and the corresponding price was imputed as the mean price of the same dish from the other food retailers.
*p < 0.05; **p < 0.01; ***p < 0 .001.
Table 2. Mean and SD costs (in €/4 portions) of 19 prepared dishes commonly consumed in France, by “preparation type” (industrially-processed or home-prepared) and successive inclusion of purchase cost, energy cost and time cost.
Purchase cost Purchase plus energy cost Purchase cost plus energy
cost plus time cost
Industrially -processed Home-prepared p a Industrially-processed Home-prepared p a Industrially-processed Home-prepared p a All items (n=76) 3.65 (2.56) 2.81 (2.04) *** 3.72 (2.57) 3.12 (2.19) *** 3.72 (2.57) 9.06 (5.83) *** Vegetable soup ( n=4) 1.04 (0.27) 1.39 (0.29) 1.05 (0.27) 1.63 (0.30) * 1.05 (0.27) 7.73 (5.39) *** Couscous tabbouleh (n=4) 1.74 (0.52) 1.86 (0.85) 1.74 (0.52) 1.86 (0.85) 1.74 (0.52) 5.10 (0.85) *** Mashed potatoes (n = 4) 0.41 (0.09) 1.14 (0.21) *** 0.43 (0.09) 1.32 (0.22) *** 0.43 (0.09) 7.83 (0.21) *** Cantonese rice (n=4) 5.48 (3.96) 2.89 (0.83) * 5.51 (3.95) 3.01 (0.83) * 5.51 (3.95) 6.26 (0.82) Lentil stew (n=4) 2.55 (2.00) 0.43 (0.08) *** 2.57 (1.98) 0.52 (0.08) *** 2.57 (1.98) 2.17 (0.08) Ham, cheese & bechamel crepe (n=4) 1.01 (0.49) 0.55 (0.11) * 1.06 (0.48) 0.60 (0.11) * 1.06 (0.48) 2.23 (0.10) ***
Croque-monsieur (n=4) 2.63 (0.31) 1.93 (0.27) 2.69 (0.27) 1.99 (0.27) 2.69 (0.27) 4.10 (0.27) *
Stuffed tomatoes (n=4)b 4.63 (1.30) 3.85 (0.70) 4.90 (1.36) 4.14 (0.70) 4.90 (1.36) 7.39 (0.70) * Quiche Lorraine (n=4) 2.67 (0.75) 1.30 (0.34) ** 2.86 (0.75) 1.55 (0.34) ** 2.86 (0.75) 4.80 (0.34) **
Shepherd's pie (n=4) 5.88 (0.99) 4.31 (0.85) 5.98 (0.88) 4.60 (0.85) 5.98 (0.88) 14.97 (1.13) ***
Beef ravioli in tomato sauce (n=4) 3.84 (0.88) 4.20 (1.14) 3.89 (0.88) 4.42 (1.24) 3.89 (0.88) 23.94 (1.23) ***
Gratin dauphinois (n=4) 2.21 (0.32) 1.10 (0.20) ** 2.34 (0.34) 1.43 (0.20) * 2.34 (0.34) 5.50 (0.19) ***
Royal couscous with meat (n=4) b 5.35 (1.75) 7.70 (2.27) 5.56 (1.88) 7.86 (2.27) 5.56 (1.88) 12.74 (2.26) *** Lasagne with bolognese sauce (n=4) 5.94 (1.70) 2.66 (0.54) *** 6.08 (1.67) 3.04 (0.54) ** 6.08 (1.67) 10.35 (0.53) **
Cassoulet (n=4) 3.78 (0.65) 5.33 (1.00) 3.82 (0.64) 6.72 (1.07) ** 3.82 (0.64) 13.23 (1.07) ***
Sauerkraut (n=4) 5.72 (0.64) 4.96 (1.36) 5.77 (0.66) 5.44 (1.36) 5.77 (0.66) 10.32 (1.35) **
Beef bourguignon (n=4)b 7.85 (2.91) 3.05 (0.10) *** 7.86 (2.91) 4.26 (0.10) * 7.86 (2.91) 12.80 (2.47) ** Paella (n=4) 5.77 (2.97) 3.87 (0.66) 5.82 (2.95) 4.11 (0.66) 5.82 (2.95) 17.72 (2.25) ***
Table 3. Mean (SD) energy density (kcal/100 g) of 19 dishes commonly consumed in France, by preparation: industrially-processed or home-prepared
Energy density Industrially-processed Home-prepared p a All items 125.31 (58.72) 129.64 (60.21) Vegetable soup 35.75 (5.73) 25.27 (1.45) *** Couscous tabbouleh 178.50 (24.28) 127.92 (1.61) *** Mashed potatoes 70.07 (4.34) 89.44 (0.040) ** Cantonese rice 138.00 (22.01) 129.62 (8.77) Lentil stew 92.00 (12.19) 81.58 (11.06)
Ham, cheese & bechamel crepe 166.70 (26.65) 224.42 (4.63) ***
Croque-monsieur 262.25 (32.05) 274.38 (7.95)
Stuffed tomatoes 136.00 (7.34) 124.35 (4.48)
Quiche Lorraine 242.50 (32.04) 252.53 (4.22)
Shepherd's pie 137.60 (30.75) 139.26 (4.64)
Beef ravioli in tomato sauce 85.97 (1.67) 129.09 (1.89) ***
Gratin dauphinois 88.82 (34.41) 93.25 (5.40)
Royal couscous with meat 133.00 (8.48) 131.43 (2.43) Lasagne with bolognese sauce 124.00 (8.36) 132.56 (1.31)
Cassoulet 119.50 (5.25) 119.55 (5.52)
Sauerkraut 88.93 (13.37) 105.69 (2.65) *
Beef bourguignon 78.00 (4.89) 75.77 (5.69)
Paella 131.73 (27.59) 129.46 (1.95)
Applesauce 71.50 (4.93) 77.44 (0.070)
a The energy density variable was logarithmically transformed to improve normality. The effect of preparation was assessed for all dishes using two-way ANOVA; and for each dish using Simple Effects Test.