HAL Id: hal-02658325
https://hal.inrae.fr/hal-02658325
Submitted on 30 May 2020
HAL is a multi-disciplinary open access
archive for the deposit and dissemination of
sci-entific research documents, whether they are
pub-lished or not. The documents may come from
teaching and research institutions in France or
abroad, or from public or private research centers.
L’archive ouverte pluridisciplinaire HAL, est
destinée au dépôt et à la diffusion de documents
scientifiques de niveau recherche, publiés ou non,
émanant des établissements d’enseignement et de
recherche français ou étrangers, des laboratoires
publics ou privés.
Cross-species amplification of 41 microsatellites in
European cyprinids: a tool for evolutionary,population
genetics and hybridization studies
Vincent Dubut, Melthide Sinama, Jean-Francois Martin, Emese Meglécz,
Juliette Fernandez, Rémi Chappaz, André Gilles, Caroline Costedoat
To cite this version:
Vincent Dubut, Melthide Sinama, Jean-Francois Martin, Emese Meglécz, Juliette Fernandez, et
al.. Cross-species amplification of 41 microsatellites in European cyprinids: a tool for
evolution-ary,population genetics and hybridization studies. BMC Research Notes, BioMed Central, 2010, 3,
pp.135. �10.1186/1756-0500-3-135�. �hal-02658325�
Dubut et al. BMC Research Notes 2010, 3:135 http://www.biomedcentral.com/1756-0500/3/135
Open Access
S H O R T R E P O R T
Bio
Med
Central
© 2010 Dubut et al; licensee BioMed Central Ltd. This is an open access article distributed under the terms of the Creative CommonsAttribution License (http://creativecommons.org/licenses/by/2.0), which permits unrestricted use, distribution, and reproduction in any medium, provided the original work is properly cited.Short Report
Cross-species amplification of 41 microsatellites in
European cyprinids: A tool for evolutionary,
population genetics and hybridization studies
Vincent Dubut*
†1, Melthide Sinama
†1, Jean-François Martin
2, Emese Meglécz
1, Juliette Fernandez
1, Rémi Chappaz
1,
André Gilles
1and Caroline Costedoat*
1Abstract
Background: Cyprinids display the most abundant and widespread species among the European freshwater Teleostei
and are known to hybridize quite commonly. Nevertheless, a limited number of markers for conducting comparative differentiation, evolutionary and hybridization dynamics studies are available to date.
Findings: Five multiplex PCR sets were optimized in order to assay 41 cyprinid-specific polymorphic microsatellite loci
(including 10 novel loci isolated from Chondrostoma nasus nasus, Chondrostoma toxostoma toxostoma and Leuciscus leuciscus) for 503 individuals (440 purebred specimens and 63 hybrids) from 15 European cyprinid species. The level of genetic diversity was assessed in Alburnus alburnus, Alburnoides bipunctatus, C. genei, C. n. nasus, C. soetta, C. t. toxostoma, L. idus, L. leuciscus, Pachychilon pictum, Rutilus rutilus, Squalius cephalus and Telestes souffia. The applicability of the markers was also tested on Abramis brama, Blicca bjoerkna and Scardinius erythrophtalmus specimens. Overall, between 24 and 37 of these markers revealed polymorphic for the investigated species and 23 markers amplified for all the 15 European cyprinid species.
Conclusions: The developed set of markers demonstrated its performance in discriminating European cyprinid
species. Furthermore, it allowed detecting and characterizing hybrid individuals. These microsatellites will therefore be useful to perform comparative evolutionary and population genetics studies dealing with European cyprinids, what is of particular interest in conservation issues and constitutes a tool of choice to conduct hybridization studies.
Findings
The Cyprinidae family is of special interest for conduct-ing comparative differentiation, evolutionary and hybrid-ization dynamics studies: (i) Cyprinidae is the most abundant and widespread freshwater fish family across the world [1]; and (ii) the Cyprinidae family is character-ized by high level of inter-species hybridization (reviewed in [2]). An indirect way to develop microsatellite markers in species with non-sequenced genomes holds in the cross-species amplification of loci previously developed in related species (e.g. [3]). Here, we examined
cross-spe-cies amplification success of 41 cyprinid-specific poly-morphic microsatellite markers, including 10 novel loci.
This was done for 15 European cyprinid species and hybrids (Table 1). They represent 11 geographically wide-spread European cyprinid species (Alburnus alburnus, Alburnoides bipunctatus, C. n. nasus, L. idus, L. leuciscus, Rutilus rutilus, Squalius cephalus, Telestes souffia, Abra-mis brama, Blicca bjoerkna and Scardinius erythrophtal-mus) and four endemic species (C. genei, C. soetta, C. t. toxostoma and Pachychilon pictum). The species sam-pling represents 12 of the 24 European Cyprinidae gen-era. We also studied two sets of hybrid specimens. The first one (Table 1; Additional file 1) consists in 48 Chon-drostoma hybrids specimens (i.e. hybrids between C. t. toxostoma and C. n. nasus) from the Durance River previ-ously characterized using the mitochondrial cytochrome b gene and four nuclear intron sequences [2]. These * Correspondence: vincent.dubut@univ-provence.fr,
caroline.costedoat@univ-provence.fr
Aix-Marseille Université, CNRS, IRD, UMR 6116 - IMEP, Equipe Evolution Génome Environnement, Centre Saint-Charles, Case 36, 3 Place Victor Hugo, 13331 Marseille Cedex 3, France
† Contributed equally
Dubut et al. BMC Research Notes 2010, 3:135 http://www.biomedcentral.com/1756-0500/3/135
Page 2 of 9
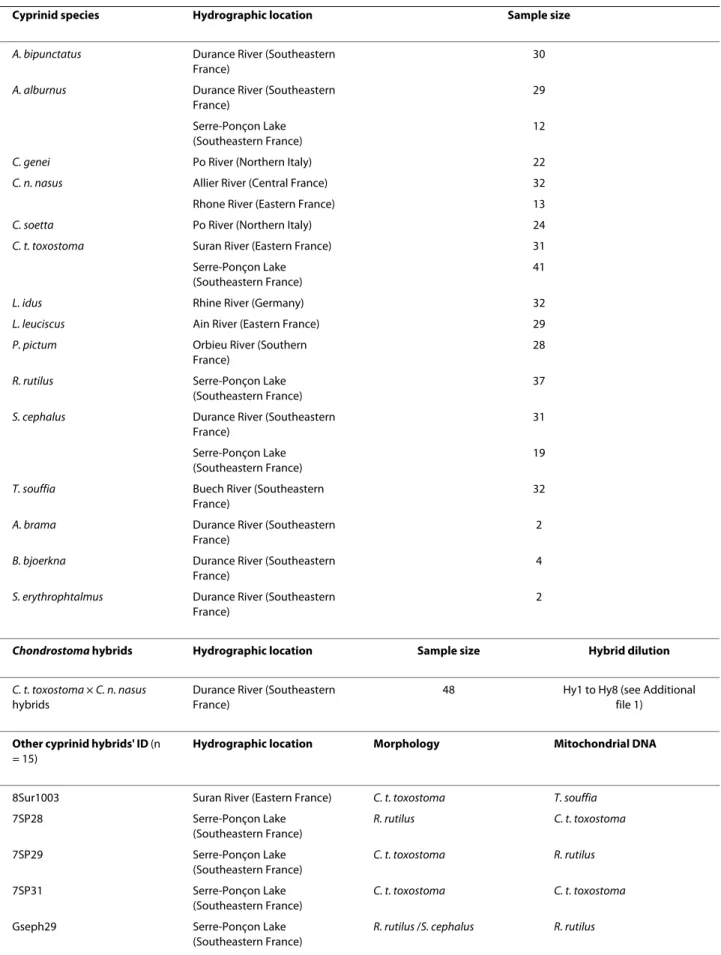
Table 1: European cyprinid species and hybrids: Location and sample size.
Cyprinid species Hydrographic location Sample size
A. bipunctatus Durance River (Southeastern
France)
30
A. alburnus Durance River (Southeastern
France)
29 Serre-Ponçon Lake
(Southeastern France)
12
C. genei Po River (Northern Italy) 22
C. n. nasus Allier River (Central France) 32
Rhone River (Eastern France) 13
C. soetta Po River (Northern Italy) 24
C. t. toxostoma Suran River (Eastern France) 31
Serre-Ponçon Lake (Southeastern France)
41
L. idus Rhine River (Germany) 32
L. leuciscus Ain River (Eastern France) 29
P. pictum Orbieu River (Southern
France)
28
R. rutilus Serre-Ponçon Lake
(Southeastern France)
37
S. cephalus Durance River (Southeastern
France)
31 Serre-Ponçon Lake
(Southeastern France)
19
T. souffia Buech River (Southeastern
France)
32
A. brama Durance River (Southeastern
France)
2
B. bjoerkna Durance River (Southeastern
France)
4
S. erythrophtalmus Durance River (Southeastern
France)
2
Chondrostoma hybrids Hydrographic location Sample size Hybrid dilution
C. t. toxostoma × C. n. nasus hybrids
Durance River (Southeastern France)
48 Hy1 to Hy8 (see Additional file 1)
Other cyprinid hybrids' ID (n
= 15)
Hydrographic location Morphology Mitochondrial DNA
8Sur1003 Suran River (Eastern France) C. t. toxostoma T. souffia
7SP28 Serre-Ponçon Lake (Southeastern France) R. rutilus C. t. toxostoma 7SP29 Serre-Ponçon Lake (Southeastern France) C. t. toxostoma R. rutilus 7SP31 Serre-Ponçon Lake (Southeastern France) C. t. toxostoma C. t. toxostoma
Gseph29 Serre-Ponçon Lake
(Southeastern France)
Dubut et al. BMC Research Notes 2010, 3:135 http://www.biomedcentral.com/1756-0500/3/135
Page 3 of 9
hybrids (Hy) range from 10% of C. n. nasus alleles in their genome (Hy1) to 80% of C. n. nasus alleles in their genome (Hy8) (sensu [2]). The second set of hybrids con-sists of 15 individuals (Table 1; Additional file 2) which exhibited an intermediate morphology between two cyprinid species or for which the species identification was not coherent among the different markers (meristic, mitochondrial or microsatellites). All specimens were beforehand identified at the species level using a morpho-logical analysis (we used identification key based on mer-istic characters [4]) and by sequencing the 5' part of the cytochrome b gene (as described in [5]). The results from mitochondrial sequences of all the 440 purebred speci-mens were congruent with their morphological identifi-cation and species assignation could be done without any ambiguity (data not shown).
Ten novel loci were isolated from Chondrostoma toxos-toma toxostoxos-toma, Chondrostoxos-toma nasus nasus and Leucis-cus leucisLeucis-cus following a protocol detailed elsewhere [6,7]. The program MICROFAMILY[8] was used to dis-card redundancies by detecting flanking region similari-ties among different loci. Sixty-nine primers pairs were designed and a total of 10 novel primer pairs were retained (Additional file 3). They were associated with clear amplification pattern, with unambiguous genotype profiles, and were polymorphic for at least one of the 15 cyprinid species. Thirty-one primers pairs from previ-ously described microsatellite loci [6,7,9-19] were then integrated into the protocol. These loci were combined into multiplex PCR kits, along with the 10 novel loci. Overall, a total of 41 loci were combined into five multi-plex PCR kits (Additional file 3). Amplifications and
genotyping were conducted using reagents and protocols described previously [6].
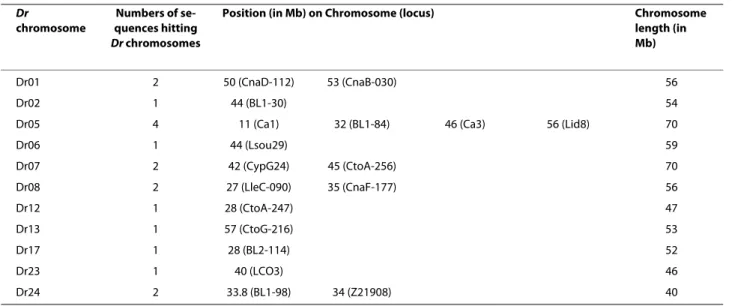
The size range of the applicable markers with a com-mon fluorescent dye did not overlap (Additional file 3), except for CtoG-075 and Lid8 in A. alburnus and BL1-T2 and CypG24 in L. idus. Nevertheless, the differences in genotype profiles allowed to unambiguously discriminat-ing alleles among loci. The mean rate of amplification success per species is 95.1% (i.e. 39/41 loci) and the mean rate of polymorphic loci per species (excluding A. brama, B bjoerkna and S. erythrophtalmus because of too small sample size) is 76.6% (i.e. about 31/41 loci) (Table 2). Moreover, 23 loci (namely 2b, 30, 84, BL1-98, BL1-153, Ca1, CtoA-247, CtoF-172, CtoG-216, CypG24, IV04, LceC1, LleA-071, LleC-090, Lsou05, Lsou08, Lsou19, Lsou34, N7K4, Ppro132, Rru4, Rser10 and Z21908) displayed amplification success in all the species tested here. The vast majority of cross-species amplifications from the European cyprinid species resulted in PCR fragments with proper microsatellite chromatograms and expected allele sizes, indicating homologous loci. The 41 retained sequences containing microsatellites were BLASTed against the complete genome of Danio rerio (e-value = 1E-20) as a proxy for testing loci homology. This procedure makes the assump-tion that chromosome topology is well conserved across cyprinid species (e.g. [20]). Eighteen of the 41 sequences produced a significant hit and were mapped onto the D. rerio genome without ambiguity (Table 3).
For populations with more than 20 samples, GENEPOP 4.0 [21] was used to: (i) test for the Hardy-Weinberg (HW) equilibrium, (ii) estimate the heterozygosity for all
Hsepha Serre-Ponçon Lake
(Southeastern France)
R. rutilus /S. cephalus R. rutilus
Hsephe Serre-Ponçon Lake
(Southeastern France)
A. alburnus /R. rutilus A. alburnus
9AVIBrem1 Durance River (Southeastern
France)
B. bjoerkna R. rutilus
9AVIBrem2 Durance River (Southeastern
France)
B. bjoerkna R. rutilus
9AVICheH1 Durance River (Southeastern
France)
A. alburnus /S. cephalus S. cephalus
9AVIHyb01 Durance River (Southeastern
France)
R. rutilus /S. erythrophtalmus S. erythrophtalmus
9AVIHyb02 Durance River (Southeastern
France)
A. alburnus /S. cephalus A. alburnus
9AVIHyb03 Durance River (Southeastern
France)
A. alburnus /S. cephalus S. cephalus
Scar26 Po River (Northern Italy) C. soetta T. muticellus
Scar32 Po River (Northern Italy) C. soetta T. muticellus
Dub u t et a l. BMC Researc h Notes 20 10, 3 :1 35 htt p :/ /ww w .biom e dcentr al. com/175 6-05 00/3 /1 3 5 Page 4 o f 9
Table 2: Matrix of the number of polymorphic and amplified loci shared between species.
Ab Aa Cg Cn Ct Cs Li Ll Pp Rr Sc Ts Abr* Bb** Se* A. bipunctatus 31/35 28 26 29 23 26 25 23 19 24 24 26 12 22 9 A. alburnus 34 34/37 31 32 26 26 28 27 21 27 28 30 14 24 10 C. genei 33 36 35/40 34 28 26 31 26 22 27 29 31 15 24 11 C. n. nasus 34 37 40 37/41 29 27 31 27 22 28 29 33 15 26 12 C. t. toxostoma 34 37 40 41 31/41 24 29 25 18 26 25 30 14 22 10 C. soetta 34 37 39 40 40 28/40 25 24 16 25 25 26 13 20 8 L. idus 32 35 39 39 39 38 32/39 26 19 28 25 29 13 23 10 L. leuciscus 34 36 38 39 39 38 37 29/39 18 26 24 26 14 22 9 P. pictum 31 34 37 38 38 37 36 36 24/38 19 22 20 11 19 8 R. rutilus 34 37 39 40 40 39 38 39 37 30/40 25 27 14 23 10 S. cephalus 32 36 37 38 38 37 36 37 35 38 32/38 27 15 22 10 T. souffia 33 36 39 40 40 39 38 38 37 39 37 33/40 15 23 11 A. brama* 34 37 39 40 40 39 38 39 37 40 38 39 16/40 13 6 B. bjoerkna** 32 35 37 38 38 37 36 37 37 39 36 37 38 27/38 10 S. erythrophtalmus* 33 35 37 38 38 37 36 37 36 38 36 37 38 36 12/38
In upper diagonal, shared polymorphic loci; in lower diagonal, shared amplified loci between species; in diagonal, polymorphic loci/amplified loci for each species. Loci for which homozygotes with null alleles were detected and those exhibiting potential paralogous (see Additional file 3) were discarded. Only two (*) and four (**) individuals genotyped: number of polymorphic loci most likely underestimated.
Dubut et al. BMC Research Notes 2010, 3:135 http://www.biomedcentral.com/1756-0500/3/135
Page 5 of 9
loci and populations, and (iii) test linkage disequilibrium (LD) among loci within populations. MICRO-CHECKER ver. 2.2.3 [22] was used to analyze the causes of departures from HW equilibrium: real HW disequilibrium, null alleles or scoring errors (often resulting from stuttering). Among the 41 loci, we noticed five cases where homozy-gotes with null alleles were detected (Additional file 1): Lsou29 in A. bipunctatus and A. alburnus; CtoE-249 in A. alburnus; BL1-T2 in L. leuciscus; and CnaD-112 and LCO5 in B. bjoerkna. These cases were discarded from the analyses dealing with HW and LD analyses. Most of the 41 loci were at HW equilibrium after False Discovery Rate (FDR) correction (modified [23] and applied within each species). Considering all loci and species together, we found 1218 cases of polymorphic pattern among which only sixteen cases (<1%) displaying HW disequilib-rium (see Additional file 4). Most loci with HW disequi-librium showed significant excess of homozygotes. It is noticeable that all A. bipunctatus individuals exhibited two alleles at locus LCO3. Regarding their size, these alleles are very close to the variation range observed in the other cyprinid species, suggesting that this locus has experimented duplication within the genome of A. bipunctatus. This locus was therefore discarded from the A. bipunctatus data for further statistical analyses. The MICRO-CHECKER analyses indicated that homozygote excess at loci with HW equilibrium departures was mainly caused by the presence of null alleles. A total of 6152 pairwise comparisons were submitted to LD analy-ses, and LD was tested with 515 pairwise comparisons per species in average. After FDR correction, only 36 pairs of loci exhibited LD (0.006% of the total pairwise comparisons). A noticeable higher number of pairs of loci at LD were found in L. idus (21/496 of pairwise
compari-sons) and C. n. nasus (Allier River) (7/666) (Additional file 4). Interestingly, LD was found between BL1-98 and Z21908 in two cases (in C. n. nasus and L. idus), in agree-ment with their relative vicinity (253 Kb) on the D. rerio's chromosome 24 (Table 3). Additionally, three other pairs of loci displayed LD in two or more species: LleA-150 and Lsou34 in A. bipunctatus and L. idus; BL1-T2 and Z21908 in C. n. nasus and L. idus; and BL1-2b and BL1-T2 in C. genei, C. n. nasus, C. t. toxostoma from Serre-Ponçon Lake and L. idus (Additional file 4).
A Bayesian-based approach was used to search for the occurrence of independent genetic groups (K) in the mic-rosatellites dataset (STRUCTURE 2.2 [24]; http:// pritch.bsd.uchicago.edu). The burn-in length was set to 100,000 followed by 1,000,000 iterations within a Markov Chain Monte Carlo (MCMC). The 'admixture model' and the 'I-model' (independent allele frequencies) were used, with no prior population information. Parameter K was chosen to vary from 1 to 20 and five repeats were run for each K. We selected the K value for which the posterior probability of the data, Ln P(D), was maximized. Each individual was assigned to the inferred clusters according to the results from the simulation procedures (parameter "Q" representing the estimated membership coefficients for each individual in each cluster). Because choosing K can be difficult a priori (although in our case the number of species is known), we combined two main approaches [25]: i) choosing K that maximizes the posterior probabil-ity of the data Ln P(D); ii) using the formula [Ln P(D)k -Ln P(D)k-1], where Ln P(D) is the estimated posterior probability of the data conditional to K. A. brama, B. bjo-erkna and S. erythrophtalmus individuals were discarded from these analyses due to their too limited sample size
Table 3: Position of the 18 microsatellite loci that match with Danio rerio (Dr) genome.
Dr
chromosome
Numbers of se-quences hitting
Dr chromosomes
Position (in Mb) on Chromosome (locus) Chromosome
length (in Mb)
Dr01 2 50 (CnaD-112) 53 (CnaB-030) 56
Dr02 1 44 (BL1-30) 54
Dr05 4 11 (Ca1) 32 (BL1-84) 46 (Ca3) 56 (Lid8) 70
Dr06 1 44 (Lsou29) 59 Dr07 2 42 (CypG24) 45 (CtoA-256) 70 Dr08 2 27 (LleC-090) 35 (CnaF-177) 56 Dr12 1 28 (CtoA-247) 47 Dr13 1 57 (CtoG-216) 53 Dr17 1 28 (BL2-114) 52 Dr23 1 40 (LCO3) 46 Dr24 2 33.8 (BL1-98) 34 (Z21908) 40
Dubut et al. BMC Research Notes 2010, 3:135 http://www.biomedcentral.com/1756-0500/3/135
Page 6 of 9
(see [26]). Moreover, the pattern of allelic frequency dif-ferentiation between species was explored through Facto-rial Correspondence Analyses (FCA) using GENETIX ver. 4.05.2 [27]. In addition, for the C. n. nasus and C. t. toxos-toma specimens and their hybrids, the Bayesian cluster-ing method implemented in the program NEWHYBRID[28] was used to assign individuals to different genotypic classes (parental, F1, F2 or backcrosses). The method computes, by MCMC method, the Bayesian posterior probability that an individual in a sample belongs to dif-ferent hybrid classes (F1, F2, and backcrosses) while simultaneously estimating allelic frequencies for parental species. The program was run five times with varying lengths of burn-in period and numbers of sweeps, as rec-ommended by the authors.
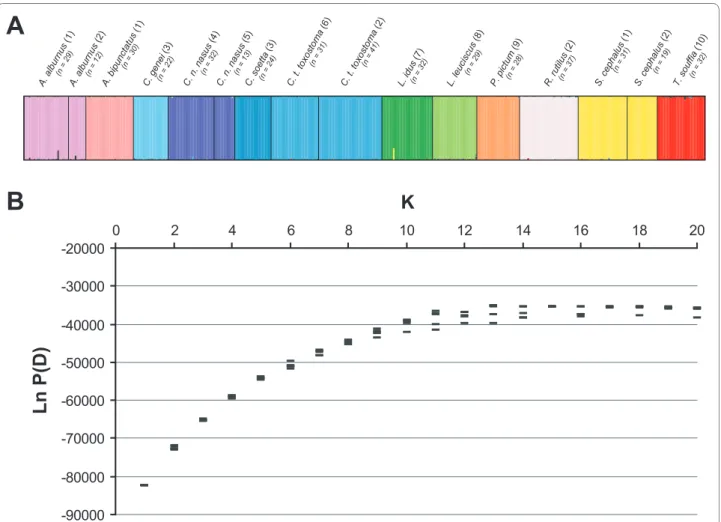
Based on either all the 41 or 23 microsatellites loci, K = 13 was obtained from the Ln P(D) analyses for K parame-ter deparame-termination (see Figure 1), which approximate well the number of analysed cyprinid species. Within species,
correct assignment score ranged from 97% to 99% both with 23 loci and 41 loci. Additionally, FCA could separate the 15 cyprinid analysed species (axes 1 and 2; Additional files 5 and 6). It is worth noting that the graphical dis-crimination was increased when the two outliers (A. bipunctatus and P. pictum) were discarded. Moreover, as highlighted by the results from the different populations of A. alburnus, C. n. nasus, C. t. toxosmtoma or S. cepha-lus, the quality of species identification, both in FCA or STRUCTURE analyses, did not depend on the population sampled (Figure 1; Additional files 5 and 6).
The genotypic distribution of the Chondrostoma hybrids specimens compared to their parental species (C. t. toxostoma and C. n. nasus) is summarized in Figure 2. The two purebred C. t. toxostoma populations can hardly be differentiated on axes 1 and 2 of the FCA, whereas a differentiation between the C. n. nasus sampled in Allier River and those sampled in Rhone River is displayed on axis 2. A strong coherence was found between the
Figure 1 Graph of the STRUCTURE run applied to 12 cyprinid species with K = 13 (A) and Ln P(D) values distribution for K = 2-20 (B) for 41 mi-crosatellites. Numbers between parentheses refer to the sample location: 1, Durance River (southeastern France); 2, Serre-Ponçon Lake (southeastern
France); 3, Po River (northern Italy); 4, Allier River (central France); 5, Rhone River (southeastern France); 6, Suran River (eastern France); 7, Rhine basin (Germany); 8, Ain River (eastern France); 9, Orbieu River (southern France); 10, Buech River (southeastern France).
A. alburnus (1) A. alburnus (2) A. bipunctatus (1) C. genei (3) C. n. nasus (4) C. n. nasus (5) C. soetta (3) C. t. toxostoma (6) C. t. toxostoma (2) L. idus (7) L. leuci scus (8) P. pict um (9) R. rutilus (2) S. cephalus (1) S. cephalus (2) T. souffia (10) (n = 29) (n = 12) (n = 30) (n = 22) (n = 32) (n = 13) (n = 24) (n = 31) (n = 41) (n = 32) (n = 29) (n = 28) (n = 37) (n = 32) (n = 31) (n = 19)
K
Ln P(D)
-90000 -80000 -70000 -60000 -50000 -40000 -30000 -20000 0 2 4 6 8 10 12 14 16 18 20A
B
Dubut et al. BMC Research Notes 2010, 3:135 http://www.biomedcentral.com/1756-0500/3/135
Page 7 of 9
genome dilution as defined by [2] and the distribution of the hybrids between the two parental species. Indeed, Hy1 genotypes were assigned toward the C. t. toxostoma species whereas Hy8 were assigned toward the C. n. nasus species. F1 hybrids, which correspond to Hy4 and Hy5 depending on their mitochondrial sequence, were mainly intermediate between the two parental species. However, these F1 hybrids are not strictly homogeneous and the assignment scores fluctuate (Additional file 1; see also Figure 2). Variations found at the level of assignment scores for Hy4 and Hy5 hybrids may be caused by the lim-ited number of markers (n = 5) used by [2], although they were discriminative markers. As for the second hybrid group, thirteen different hybrid combinations have been identified. Most of the hybrids revealed being intro-gressed individuals (i.e. individuals assigned to one spe-cies based on mitochondrial cytochrome b gene or morphology and to another species based on microsatel-lites), although most of them exhibited an intermediate morphology (Additional file 2).
To our knowledge, the development of large number (n > 20) of polymorphic microsatellite markers applicable to European cyprinid species has never been achieved to date (but see for instance [3]). Moreover, through the
spe-cies sampling designed in this study, we demonstrated their applicability within half of the European cyprinid genera, with 24 to 37 polymorphic loci per species. A common set of 23 markers enabled the comparison of 15 species and hence allows genetic variability and recombi-nation to be compared directly for these species. Further-more, normalization of the PCR conditions and multiplexing make faster and cost effective the genotyp-ing of the 41 loci. The high number of loci and wide applicability to the European cyprinid species make the developed set of markers a powerful tool for: (i) studies dealing with genetic diversity and structure of the Euro-pean cyprinid species (these markers will notably be use-ful to assess the impact of anthropogenic factors on the cyprinid genetic diversity, and will be useful for conserva-tion and environmental monitoring purposes); (ii) com-parative studies dealing with the evolutionary pattern and history of a large set of species; (iii) species identification; and (iv) developing knowledge in hybridization processes and dynamics in Cyprinids. More specifically, the analysis of a large number of genetic markers (see [29]) will signif-icantly improve the understanding of the relative impact of inter-species interactions, response to environmental
Figure 2 Biplot representation of the 41 microsatellites-based FCA conducted on Chondrostoma specimens. Were included in the analysis C.
n. nasus specimens from Allier (n = 32) and Rhone (n = 13) Rivers, C. t. toxostoma specimens from Suran River (n = 31) and Serre-Ponçon Lake (n = 41) and their hybrids (n = 48) from Durance River (France).
-1.5 -1.0 -0.5 0.0 0.5 1.0 1.5 -1.2 -0.7 -0.2 0.3 0.8
C. n. nasus (Allier River) C. n. nasus (Rhone River) C. t. toxostoma (Suran River) C. t. toxostoma (Serre-Ponçon Lake)
Hy1 Hy3 Hy5 Hy7
Purebred populations: Hybrids’ genome dilution:
Hy4 Hy6 Hy8
Axis 1
(11.30 %)Axis 2
(2.13 %)Dubut et al. BMC Research Notes 2010, 3:135 http://www.biomedcentral.com/1756-0500/3/135
Page 8 of 9
effects and ecological trade-offs in cyprinid hybrid zones (as initiated by [30]).
Additional material
Competing interests
The authors declare that they have no competing interests.
Authors' contributions
MS, VD, JFM and JF carried out the molecular genetics laboratory work. VD, MS, EM and CC performed the statistical analyses. VD, CC and MS drafted the man-uscript. AG, VD and CC conceived the study. RC participated to the financial support. All authors read, contributed to and approved the final manuscript.
Acknowledgements
Many thanks to Rémi Grenier, Chloé Bennati-Granier and Bastien Patin for their help with the laboratory work. We are grateful to Emmanuel Corse for some key samples from Serre-Ponçon Lake. Thanks to Tom Nielsen for his help with the English editing. Data used in this work were partly produced through molecular genetic analysis technical facilities of the IFR119 'Montpellier Envi-ronnement Biodiversité'.
Author Details
1Aix-Marseille Université, CNRS, IRD, UMR 6116 - IMEP, Equipe Evolution Génome Environnement, Centre Saint-Charles, Case 36, 3 Place Victor Hugo, 13331 Marseille Cedex 3, France and 2Montpellier SupAgro, INRA, CIRAD, IRD, Centre de Biologie pour la Gestion des Populations, Campus International de Baillarguet, CS30016, 34988 Montferrier-sur-Lez, France
References
1. Nelson J: Fishes of the World 3rd edition. New-York: John Wiley & Sons; 1994.
2. Costedoat C, Pech N, Chappaz R, Gilles A: Novelties in hybrid zones: Crossroads between population genomic and ecological approaches. PLoS ONE 2007, 2:e357.
3. Holmen J, Vøllestad LA, Jakobsen KS, Primmer CR: Cross-species amplification of 36 cyprinid microsatellite loci in Phoxinus phoxinus (L.) and Scardinius erythrophthalmus (L.). BMC Res Notes 2009, 2:248.
4. Keith P, Allardi J: Atlas des poissons d'eau douce de France Paris: Muséum National d'Histoire Naturelle; 2001.
5. Costedoat C, Pech N, Salducci MD, Chappaz R, Gilles A: Evolution of mosaic hybrid zone between invasive and endemic species of Cyprinidae through space and time. Biol J Linn Soc 2005, 85:135-155. 6. Dubut V, Martin JF, Costedoat C, Chappaz R, Gilles A: Isolation and
characterization of polymorphic microsatellite loci in the freshwater fishes Telestes souffia and Telestes muticellus (Teleostei: Cyprinidae). Mol Ecol Resour 2009, 9:1001-1005.
7. Dubut V, Martin JF, Gilles A, Van Houdt J, Chappaz R, Costedoat C: Isolation and characterization of polymorphic microsatellite loci for the dace complex: Leuciscus leuciscus (Teleostei: Cyprinidae). Mol Ecol Resour 2009, 9:1179-1183.
8. Meglécz E: MICROFAMILY (version 1): A computer program for detecting
flanking region similarities among different microsatellite loci. Mol Ecol Notes 2007, 7:18-20.
9. Shimoda N, Knapik EW, Ziniti J, Sim C, Yamada E, Kaplan S, Jackson D, de Sauvage F, Jacob H, Fishman MC: Zebrafish genetic map with 2000 microsatellite markers. Genomics 1999, 58:219-232.
10. Dimsoski P, Toth GP, Bagley MJ: Microsatellite characterization in central stoneroller Campostoma anomalum (Pisces: Cyprinidae). Mol Ecol 2000, 9:2187-2189.
11. Bessert ML, Ortí G: Microsatellite loci for paternity analysis in the fathead minnow, Pimephales promelas (Teleostei: Cyprinidae). Mol Ecol Notes 2003, 3:532-534.
12. Dawson DA, Burland TM, Douglas A, Le Comber SC, Bradshaw M: Isolation of microsatellite loci in the freshwater fish, the bitterling Rhodeus sericeus (Teleostei: Cyprinidae). Mol Ecol Notes 2003, 3:199-202. 13. Mesquita N, Cunha C, Hänfling B, Carvalho GR, Zé-Zé L, Tenreiro R, Coelho
MM: Isolation and characterization of polymorphic microsatellite loci in the endangered Portuguese freshwater Squalius aradensis
(Cyprinidae). Mol Ecol Notes 2003, 3:572-574.
14. Salgueiro P, Carvalho G, Collares-Pereira MJ, Coelho MM: Microsatellite analysis of genetic population structure of the endangered cyprinid Anaecypris hispanica in Portugal: Implications for conservation. Biol Conserv 2003, 109:47-56.
15. Baerwald MR, May B: Characterization of microsatellite loci for five members of the minnow family Cyprinidae found in the Sacramento-San Joaquim Delta and its tributaries. Mol Ecol Notes 2004, 4:385-390. 16. Barinova A, Yadrenkina E, Nakajima M, Taniguchi N: Identification and
characterization of microsatellite DNA markers developed in ide Leuciscus idus and Siberian roach Rutilus rutilus. Mol Ecol Notes 2004, 4:86-88.
17. Turner TF, Dowling TE, Broughton RE, Gold JR: Variable microsatellite markers amplify across divergent lineages of cyprinid fishes (subfamily Leuciscinae). Conserv Genet 2004, 5:279-281.
18. Larno V, Launey S, Devaux A, Laroche J: Isolation and characterization of microsatellite loci from chub Leuciscus cephalus (Pisces: Cyprinidae). Mol Ecol Notes 2005, 5:752-754.
19. Muenzel FM, Sanetra M, Salzburger W, Meyer A: Microsatellites from the vairone Leuciscus souffia (Pisces: Cyprinidae) and their application to closely related species. Mol Ecol Notes 2007, 7:1048-1050.
20. Ráb P, Rábová M, Pereira CS, Collares-Pereira MJ, Pelikánová Š: Chromosome studies of European cyprinid fishes: Interspecific homology of leuciscine cytotaxonomic marker-the largest
subtelocentric chromosome pair as revealed by cross-species painting. Chromosome Res 2008, 16:863-873.
21. Rousset F: GENEPOP'007: A complete reimplementation of the Genepop
software for Windows and Linux. Mol Ecol Resour 2008, 8:103-106. 22. van Oosterhout C, Hutchinson WF, Wills DPM, Shipley P: MICRO-CHECKER:
Software for identifying and correcting genotyping errors in microsatellite data. Mol Ecol Notes 2004, 4:535-538.
23. Benjamini Y, Hochberg Y: Controlling the false discovery rate-a practical and powerful approach to multiple testing. J Roy Stat Soc B Met 1995, 57:289-300.
24. Pritchard JK, Stephens M, Donnelly P: Inference of population structure using multilocus genotype data. Genetics 2000, 155:945-959. 25. Garnier S, Alibert P, Audiot P, Prieur B, Rasplus JY: Isolation by distance
and sharp discontinuities in gene frequencies: Implications for the phylogeography of an alpine insect species, Carabus solieri. Mol Ecol 2004, 13:1883-1897.
Additional file 1 STRUCTURE (K = 2) and NEWHYBRID assignment scores for
the 48 Chondrostoma hybrids using 41 microsatellites. Excel Table
con-taining STRUCTURE (K = 2) and NEWHYBRID assignment scores for the 48
Chon-drostoma hybrids using 41 microsatellites.
Additional file 2 Characterization and STRUCTURE (K = 15) assignment scores for the 15 cyprinid hybrids using 41 microsatellites. Excel Table
containing the characterization and STRUCTURE (K = 15) assignment scores for the 15 cyprinid hybrids using 41 microsatellites.
Additional file 3 Microsatellite loci, multiplex PCR conditions, levels of variability and amplifiability of 41 microsatellite loci in 15 cyprinid species. Excel Table describing the microsatellite loci, multiplex PCR
condi-tions, levels of variability and amplifiability of 41 microsatellite loci in 15 cyprinid species.
Additional file 4 Pairs of loci found to be at Linkage Disequilibrium in 15 cyprinid species. PDF file reporting the pairs of loci found to be at
Link-age Disequilibrium in 15 cyprinid species
Additional file 5 Biplot representations of the FCA for 15 cyprinid species (A) or 13 cyprinid species (excluding A. bipunctatus and P.
pic-tum) (B) using 41 microsatellites. PDF file containing the biplot
represen-tations of the FCA for 15 cyprinid species (A) or 13 cyprinid species (excluding A. bipunctatus and P. pictum) (B) using 41 microsatellites.
Additional file 6 Biplot representations of the FCA for 15 cyprinid species (A) or 13 cyprinid species (excluding A. bipunctatus and P.
pic-tum) (B) using 23 microsatellites. PDF file containing the biplot
represen-tations of the FCA for 15 cyprinid species (A) or 13 cyprinid species (excluding A. bipunctatus and P. pictum) (B) using 23 microsatellites.
Received: 23 February 2010 Accepted: 17 May 2010 Published: 17 May 2010
This article is available from: http://www.biomedcentral.com/1756-0500/3/135 © 2010 Dubut et al; licensee BioMed Central Ltd.
This is an open access article distributed under the terms of the Creative Commons Attribution License (http://creativecommons.org/licenses/by/2.0), which permits unrestricted use, distribution, and reproduction in any medium, provided the original work is properly cited.
Dubut et al. BMC Research Notes 2010, 3:135 http://www.biomedcentral.com/1756-0500/3/135
Page 9 of 9
26. Fogelqvist J, Niittyvuopio A, Ågren J, Savolainen O, Lascoux M: Cryptic population genetic structure: The number of inferred clusters depends on sample size. Mol Ecol Resour 2010, 10:314-323.
27. Belkhir K, Borsa P, Chikhi L, Raufaste N, Bonhomme F: GENETIX 4.05, logiciel sous Windows TM pour la génétique des populations Montpellier: Laboratoire Génome Populations Interactions (UMR 5000, CNRS, Université de Montpellier II); 2004.
28. Anderson EC, Thompson EA: A model-based method for identifying species hybrids using multilocus genetic data. Genetics 2002, 160:1217-1229.
29. Vähä JP, Primmer CR: Efficiency of model-based Bayesian methods for detecting hybrid individuals under different hybridization scenarios and with different numbers of loci. Mol Ecol 2006, 15:63-72. 30. Corse E, Costedoat C, Pech N, Chappaz R, Grey J, Gilles A: Trade-off
between morphological convergence and opportunistic diet behavior in fish hybrid zone. Front Zool 2009, 6:26.
doi: 10.1186/1756-0500-3-135
Cite this article as: Dubut et al., Cross-species amplification of 41 microsatel-lites in European cyprinids: A tool for evolutionary, population genetics and hybridization studies BMC Research Notes 2010, 3:135