Exploring Listeria monocytogenes Transcriptomes in
Correlation with Divergence of Lineages and Virulence as
Measured in Galleria mellonella
Bo-Hyung Lee,a,f* Dominique Garmyn,bLaurent Gal,bCyprien Guérin,cLaurent Guillier,dAlain Rico,eBjörn Rotter,f Pierre Nicolas,cPascal Piveteaub
aÉcole Doctorale des Sciences de la Vie, Université Clermont Auvergne, Santé, Agronomie, Environnement, Clermont-Ferrand, France
bAgroécologie, AgroSup Dijon, Institut National de la Recherche Agronomique (INRA), Université Bourgogne Franche-Comté, Dijon, France
cMathématiques et Informatique Appliquées du Génome à l’Environnement, INRA, Université Paris-Saclay, Jouy-en-Josas, France
dFrench Agency for Food, Environmental and Occupational Health & Safety (Anses), Laboratory for Food Safety, Maisons-Alfort, France
eThermo Fisher Scientific, Villebon-sur-Yvette, France
fGenXPro GmbH, Frankfurt am Main, Germany
ABSTRACT As for many opportunistic pathogens, the virulence potential of Listeria monocytogenes is highly heterogeneous between isolates and correlated, to some extent, with phylogeny and gene repertoires. In sharp contrast with copious data on intraspecies genome diversity, little is known about transcriptome diversity despite the role of complex genetic regulation in pathogenicity. The current study imple-mented RNA sequencing to characterize the transcriptome profiles of 33 isolates un-der optimal in vitro growth conditions. Transcript levels of conserved single-copy genes were comprehensively explored from several perspectives, including phylog-eny, in silico-predicted virulence category based on epidemiological multilocus se-quence typing (MLST) data, and in vivo virulence phenotype assessed in Galleria mel-lonella. Comparing baseline transcriptomes between isolates was intrinsically more complex than standard genome comparison because of the inherent plasticity of gene expression in response to environmental conditions. We show that the rele-vance of correlation analyses and their statistical power can be enhanced by using principal-component analysis to remove the first level of irrelevant, highly coordi-nated changes linked to growth phase. Our results highlight the major contribution of transcription factors with key roles in virulence to the diversity of transcriptomes. Divergence in the basal transcript levels of a substantial fraction of the transcrip-tome was observed between lineages I and II, echoing previously reported epidemi-ological differences. Correlation analysis with in vivo virulence identified numerous sugar metabolism-related genes, suggesting that specific pathways might play roles in the onset of infection in G. mellonella.
IMPORTANCE Listeria monocytogenes is a multifaceted bacterium able to proliferate in a wide range of environments from soil to mammalian host cells. The accumu-lated genomic data underscore the contribution of intraspecies variations in gene repertoire to differential adaptation strategies between strains, including infection and stress resistance. It seems very likely that the fine-tuning of the transcriptional regulatory network is also a key component of the phenotypic diversity, albeit more difficult to investigate than genome content. Some studies reported incongruity in the basal transcriptome between isolates, suggesting a putative relationship with phenotypes, but small isolate numbers hampered proper correlation analyses with respect to their characteristics. The present study is the embodiment of the promis-ing approach that consists of analyzpromis-ing correlations between transcriptomes and various isolate characteristics. Statistically significant correlations were found with
Citation Lee B-H, Garmyn D, Gal L, Guérin C, Guillier L, Rico A, Rotter B, Nicolas P, Piveteau P. 2019. Exploring Listeria monocytogenes transcriptomes in correlation with divergence of lineages and virulence as measured in Galleria mellonella. Appl Environ Microbiol 85:e01370-19.https://doi.org/10.1128/AEM .01370-19.
Editor Edward G. Dudley, The Pennsylvania State University
Copyright © 2019 American Society for Microbiology.All Rights Reserved. Address correspondence to Pierre Nicolas, pierre.nicolas@inra.fr, or Pascal Piveteau, piveteau@u-bourgogne.fr.
* Present address: Bo-Hyung Lee, Virologie et Immunologie Moléculaires, INRA, Jouy-en-Josas, France.
P.N. and P.P. contributed equally to this work. Received 20 June 2019
Accepted 25 August 2019
Accepted manuscript posted online 30 August 2019
Published
crossm
phylogenetic groups, epidemiological evidence of virulence potential, and virulence in Galleria mellonella larvae used as an in vivo model.
KEYWORDS Galleria mellonella, Listeria monocytogenes, lineage, transcriptomics, virulence
T
he genus Listeria currently groups 20 species among which Listeria monocytogenes and Listeria ivanovii are considered pathogenic (1, 2). L. monocytogenes is found in a wide range of habitats, including soil, vegetation, water, and food processing envi-ronments, and as a facultative intracellular pathogen in mammal and nonmammal hosts (3, 4). This bacterium also stands as an important model to study host-pathogen interactions (5). In humans, L. monocytogenes is the causative agent of listeriosis, a foodborne disease resulting from ingestion of contaminated food products, especially ready-to-eat foods (6). Symptoms of listeriosis range from none to febrile gastroenteritis in healthy people to meningitis, meningoencephalitis, and septicemia with a high fatality rate in immunocompromised individuals. In pregnant women, perinatal infec-tions can lead to miscarriage, stillbirth, or premature birth (7).Isolates of L. monocytogenes are classified into four phylogenetic lineages. Most isolates belong to lineage I (serotypes 4b, 1/2b, 3b, 4d, 4e, and 7) and lineage II (serotypes 1/2a, 1/2c, 3a, and 3c), while lineages III and IV (serotypes 4a, 4c, and 4b) appear to be smaller groups. Overrepresentation of serotypes 1/2a, 1/2b, 1/2c, and 4b is observed in food and clinical isolates, and serotype 4b accounts for the majority of cases of listeriosis in humans (8, 9). Additionally, multilocus sequence typing (MLST) unravelled clonal structure (10) as well as the uneven distribution of clonal complexes (CCs) in clinical and food isolates in which hyper- and hypovirulent clones were further identified (11, 12).
To date, all L. monocytogenes isolates are considered to be equally virulent by governmental and international food safety authorities such as the European Food Safety Authority in the European Union and the Food and Drug Administration in the United States. However, it is contradicted by accumulating evidence (11, 13). The virulence of L. monocytogenes is determined by its capacity to circumvent innate host barriers such as microbiota (14, 15) and its ability to hijack host cell functions during its intracellular life cycle (5, 16). The onset of infection relies on expression of virulence factors (17), many of which are clustered in the Listeria pathogenicity islands (LIPIs), whose distribution is phylogenetically distinctive (11, 18, 19). The 9-kb chromosomal LIPI1 contains prfA, plcA, hly, mpl, actA, and plcB encoding the key virulence factors required for intracellular lifestyle (19). Additional pathogenicity islands (11, 20), antibi-otic resistance plasmids (21, 22), and a plasmid carrying an internalin gene (23) were reported as additional virulence determinants. Moreover, reports on the direct and indirect involvement of several small noncoding RNAs in pathogenesis have increased over the last decade (24–27).
A range of molecular markers were proposed to approximate the virulence potential of L. monocytogenes isolates (28–30) on the basis of genomic analysis. As an example, detection of point mutations in inlA was tested to predict noninvasive isolates (31). Similarly, multiplex PCR detecting inlA, inlC, and inlJ as biomarkers was proposed to assess virulence potential (32). However, because of the high degree of intraspecific genetic diversity and the complex mechanisms leading to infection in the host, estimating virulence by analyzing a discrete number of genes may yield unsatisfactory results (33, 34). Moreover, a recent study showing epistatic control of fosfomycin resistance by prfA and hpt during infection supports complex genotype-phenotype associations (35).
In parallel to genome diversity studies, transcriptome profiling evidenced global transcriptional reshaping during infection, and a large set of virulence-associated genes were identified (24, 36). A complex network of transcription factors tightly coordinates virulence-related gene expression. PrfA, the master activator of virulence factors, the alternative sigma factor B (B), the major regulator of stress responses, AgrA, the
response regulator of the Agr system, and several noncoding RNAs are part of this regulatory network (25, 37–39).
Importantly, several studies reported differential expression of conserved genes between pathogenic versus nonpathogenic isolates (40–43) which could reflect the contribution of the regulatory network to fine-tuning gene expression of virulent isolates immediately after ingestion and in the gastrointestinal tract, therefore maxi-mizing their fitness in the host system (44). However, as most studies were restricted to a limited number of strains, the weight of intraspecific diversity tended to be over-looked. To overcome this limitation, a collection of 91 phylogenetically divergent isolates from diverse origins were processed in the Galleria mellonella virulence assay in order to compare their virulence potential. A subset of 33 isolates was then analyzed by high-throughput RNA sequencing (RNA-seq) to explore transcriptome heterogeneity according to phylogenetic distance and virulence potential.
RESULTS
Intraspecific virulence phenotype monitored in the G. mellonella virulence assay. The virulence of a collection of 91 isolates was assessed using the G. mellonella virulence assay. Inoculums were prepared from early stationary-phase cultures in order to limit variability in cell numbers and overall growth stage between experiments, considering the large number of isolates under study. To verify the relevance of the protocol, the bacterial loads used for assays of the first 63 isolates were compared (see Table S1 in the supplemental material). CFU ranged from a minimum of 0.70⫻ 106to a maximum of 2.37⫻ 106with a mean value of 1.53⫻ 106and standard deviation of 0.35⫻ 106. Grubb’s test identified no outliers, and D’Agostino-Pearson omnibus nor-mality test did not reject nornor-mality (k2⫽ 0.711, P ⫽ 0.701) suggesting that the numbers of injected bacteria were comparable between isolates. Survival of larvae postinfection was monitored daily, and the time (in days) needed to kill more than 50% of the insects (LT50) was calculated. All isolates were capable of killing larvae, but their observed LT50s varied greatly (Fig. 1). While one isolate killed more than 50% of larvae within the first 24 h postinfection (LT50 of 1), eight isolates did not reach 50% death by 5 days postinfection (LT50 of⬎5, encoded as 6). A majority of isolates (72.4%) showed LT50s of 2 to 3 days (37 and 28 isolates, respectively). The rest showed LT50s of 4 and 5 days (8 and 9 isolates, respectively).
The 89 isolates with known lineage were grouped according to their LT50s (Table 1). No significance (Fisher’s exact test, P⫽ 0.93) was observed, implying no association between lineage and LT50 measured in G. mellonella. Similarly, no relation was found (P⫽ 0.83) between LT50 values and epidemiological backgrounds (i.e., epidemic, fecal, or food-related samples).
On the basis of LT50 grouping, a subcollection of 33 isolates was selected to explore the diversity of transcriptomes of L. monocytogenes. Three criteria were taken into consideration in selecting these isolates: even coverage of LT50 groups measured in G. mellonella, representation of lineage II versus lineage I, and CC-based virulence level. The latter, hereafter referred to as Maury’s classification, establishes three CC-based virulence groups (hypovirulent, intermediate or unknown, and hypervirulent) based on a comprehensive analysis of population clonal structure in relation to isolates’ origin and further in vivo assay confirmation (11). Figure 2 shows the three classifications superimposed onto a phylogenetic tree reconstructed after complete genome com-parison of the 33 isolates. This representation highlights the tight connection between Maury’s classification and lineage, since all genotypes of hypervirulence (CC1, CC2, CC4, and CC6) were closely distributed in lineage I, while those of hypovirulence (CC9 and CC121) were grouped in lineage II.
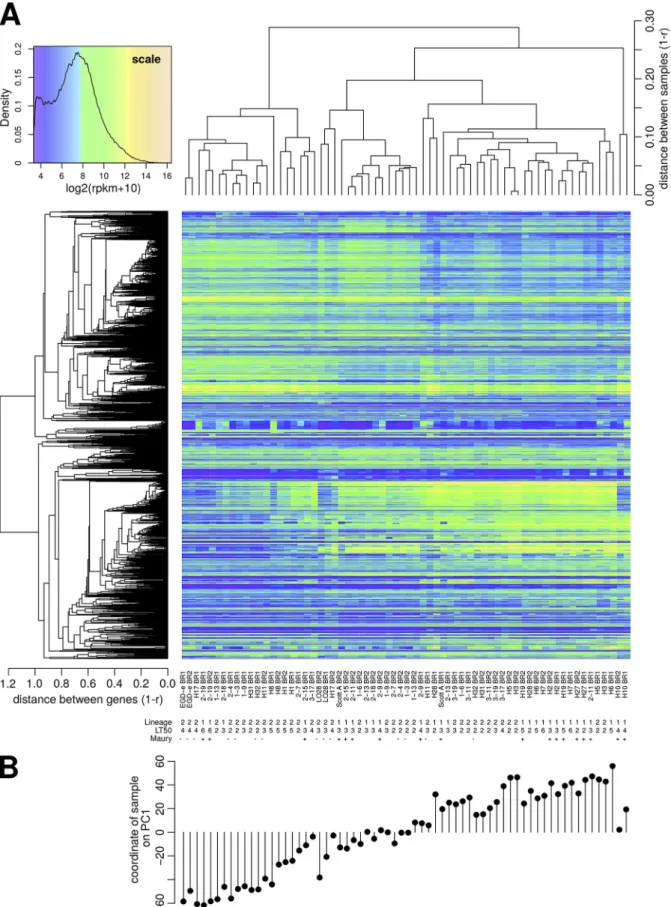
Exploratory analysis of transcriptomes. (i) Global variations in transcript ex-pression and PCA analysis. A total of 66 transcriptome profiles were obtained from duplicated exponential cultures of 33 isolates grown in brain heart infusion (BHI) broth at 37°C, as previously proposed to best mimic intracellular growth (36). Transcript levels of 2,456 conserved single-copy genes demonstrated large variations across samples
which delineated groups of genes with highly correlated expression profiles (left dendrogram in Fig. 3A). Intriguingly, transcriptome profiles were not always consistent between duplicates, suggesting sources of variability that may complicate comparisons between isolates. To further investigate the patterns of variations, principal-component analysis (PCA) was applied to project the 66 transcriptomes, each characterized by the levels of 2,456 transcripts, onto spaces of smaller dimensions. It revealed that coordi-nates of the samples on a single axis (the first of the PCA, hereafter referred to as principal-component axis 1 [PC1]) was able to explain 48.4% of the total variance. Figure 3B shows that PC1 identified the existence of a continuum of transcriptome profiles that was not directly connected to the isolates’ characteristics.
To understand the source of this heterogeneity, the genes that contributed the most to PC1 were checked for their functional category. Loading values for PC1 were calculated for each gene, and 100 genes positioned at both extreme positive and negative ends of PC1 were examined for the distribution of functional categories (Fig. 4). Functions involved in exponential growth (e.g., “Cell division,” “RNA synthesis,” and “Protein synthesis”) were negatively linked with position on PC1. On the other hand, functions related to the transition to stationary phase were positively linked with position on PC1 (e.g., “Intermediary metabolism,” “Adaptation to atypical conditions,”
FIG 1 Virulence levels of 91 L. monocytogenes isolates in G. mellonella. Isolates are grouped by postinfection incubation
time (in days) required to observe 50% or more death of larvae (LT50). Larvae injected with PBS served as negative controls. Panels A to E show isolates with LT50 of 1 to 5 days, respectively, and panel F shows isolates that did not reach 50% death
TABLE 1 Characteristics of L. monocytogenes strains used in this study Lineagea and MLST Maury’s classificationb LT50
(days) RNA-seqc Origind
Isolate (reference) Lineage I CC1 ⫹ 3 Sporadic H14 (29) CC1 ⫹ 2 Sporadic H21 (29) CC1 ⫹ 2 Sporadic H22 (29) CC1 ⫹ 2 Epidemic H36 (29) CC1 ⫹ 3 Yes Food 2-11 (75) CC1 ⫹ 2 Food 2-12 (75) CC2 ⫹ 3 Yes Fecal H2 (29) CC2 ⫹ 4 Yes Sporadic H10 (29) CC2 ⫹ 5 Yes Sporadic H19 (29) CC2 ⫹ 2 Yes Fecal H27 (29)
CC2 ⫹ 3 Yes Epidemic Scott A (29)
CC2 ⫹ 4 Yes Food 2-9 (75) CC2 ⫹ 5 Food 2-10 (75) CC3 5 Yes Fecal H6 (29) CC3 6 Yes Sporadic H7 (29) CC3 3 Sporadic H18 (29) CC3 2 Yes Fecal H28 (29) CC3 2 Fecal H35 (29) CC3 3 Yes Food 2-13 (75) CC3 3 Food 2-14 (75) CC4 ⫹ 3 Yes FPE 2-15 (75) CC4 ⫹ 3 Food 2-16 (75) CC5 2 Food 2-17 (75) CC5 3 Yes Food 2-18 (75) CC6 ⫹ 3 Sporadic H24 (29) CC6 ⫹ 6 Yes Food 2-19 (75) CC6 ⫹ 4 Food 2-20 (75) CC88 2 Sporadic H9 (29) CC220 2 Food 3-8 (75) CC315 3 Food 3-14 (75) Lineage II CC7 2 Yes Sporadic H3 (29) CC7 2 Yes Sporadic H5 (29) CC7 2 Sporadic H13 (29) CC7 2 Sporadic H16 (29) CC7 5 FPE 1-12 (75) CC7 2 Yes FPE 1-13 (75) CC7 4 FPE 1-14 (75) CC7 4 FPE 1-15 (75) CC7 5 FPE 1-16 (75) CC7 3 FPE 1-17 (75) CC7 2 FPE 1-18 (75) CC7 3 FPE 1-19 (75) CC8 5 Yes Fecal H1 (29) CC8 3 Sporadic H15 (29) CC8 2 Yes Food 2-7 (75) CC8 2 Food 2-8 (75)
CC9 ⫺ 3 Yes Fecal LO28 (29)
CC9 ⫺ 4 Yes Epidemic EGD-e (29)
CC9 ⫺ 2 Yes Food 2-4 (75) CC9 ⫺ 3 Food 2-5 (75) CC9 ⫺ 2 Food 2-6 (75) CC11 5 FPE 1-5 (75) CC11 2 Yes FPE 1-6 (75) CC11 6 FPE 1-7 (75) CC14 2 NA 3-2 (75) CC18 2 Sporadic H25 (29) CC18 2 Yes Fecal H31 (29) CC19 2 Food 3-4 (75) CC20 2 Food 3-6 (75) CC21 5 Yes Sporadic H8 (29) CC21 3 Food 3-7 (75) CC26 3 Food 3-9 (75)
and “Detoxification”). In sum, PC1 represented transcriptome differences caused by the transition from exponential to early stationary phase.
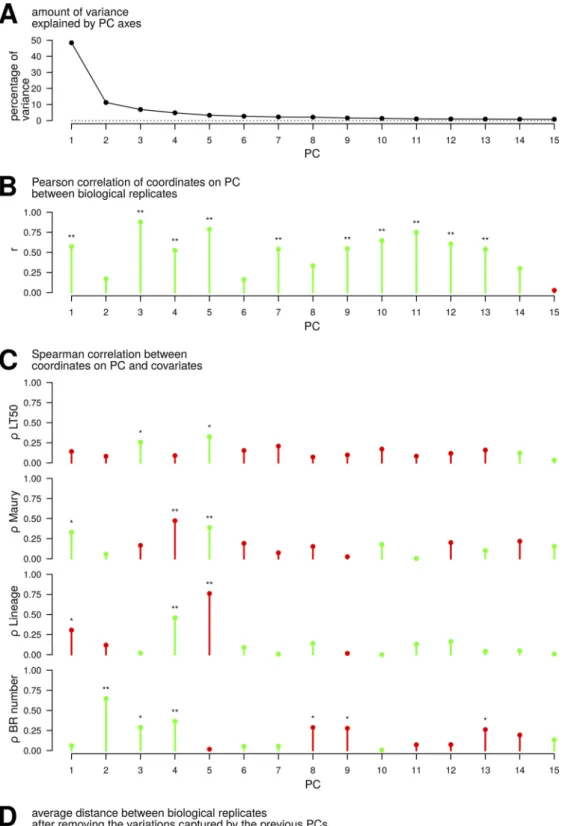
PC2 explained 11.2% of the total variance, and other axes explained less than 10% fraction of variance. In total, 89.2% of variance was explained by 15 axes (Fig. 5A). Correlation analyses were performed to identify the contextual variables captured by the different PCs underlying heterogeneity. The coordinates of the two biological replicates (biological replicate 1 [BR1] and BR2) were more consistent for some PCs than for others as reflected in the variation of the Pearson correlation coefficient (r) com-puted between the vectors of 33 coordinates available for each biological replicate (Fig. 5B). In particular, coordinates on PC2 exhibited little correlation between the two biological replicates (r⫽ 0.17), whereas the highest level of correlation was reached for PC3 (r⫽ 0.88). Computation of Spearman’s rank correlation coefficient () served as a generic approach to assess relationships between coordinates on each PC and ordinal (LT50 and Maury’s classification) or binary (lineage and BR) covariates (Fig. 5C). Among the PCs, coordinates on PC3 and PC5 revealed the highest correlations with in vivo virulence (LT50) ( ⫽ 0.26 and ⫽ 0.33, respectively). Concomitantly, Maury’s classifi-cation of the genotypes exhibited positive correlations with PC1 ( ⫽ 0.33) and PC5 ( ⫽ 0.39), reflecting a trend of higher coordinates on these axes for samples corre-sponding to hypervirulent genotypes, and negative correlation with PC4 ( ⫽ ⫺0.47). The exact opposite pattern was observed with respect to the division between lineages I and II: PC1 ( ⫽ ⫺0.31) and PC5 ( ⫽ ⫺0.76) exhibited negative correlations, reflecting
TABLE 1 (Continued) Lineagea and MLST Maury’s classificationb LT50
(days) RNA-seqc Origind
Isolate (reference) CC26 2 Food 3-10 (75) CC26 2 Yes Food 3-11 (75) CC31 2 Food 3-12 (75) CC31 3 FPE 3-13 (75) CC37 2 Fecal H38 (29) CC121 ⫺ 3 Yes Fecal H11 (29) CC121 ⫺ 4 Yes Fecal H17 (29) CC121 ⫺ 2 Yes Fecal H32 (29) CC121 ⫺ 2 Fecal H34 (29) CC121 ⫺ 3 Food 1-1 (75) CC121 ⫺ 6 Food 1-2 (75) CC121 ⫺ 2 Yes FPE 1-3 (75) CC121 ⫺ 5 FPE 1-4 (75) CC121 ⫺ 3 Food 2-1 (75) CC121 ⫺ 3 Food 2-2 (75) CC121 ⫺ 1 Food 2-3 (75) CC155 6 FPE 1-8 (75) CC155 3 Yes FPE 1-9 (75) CC155 6 FPE 1-10 (75) CC155 6 Food 1-11 (75) CC177 2 Food 3-3 (75) CC199 2 Food 3-5 (75) CC412 3 Food 3-15 (75) CC451 2 Food 3-1 (75) ST13 3 Yes Food 3-18 (75) ST13 6 Food 3-19 (75) ST200 4 Yes Food 3-16 (75) Lineage NAe ST517 3 Food 3-17 (75) NA 2 Sporadic H23 (29)
aLineage was determined based on the online MLST database for L. monocytogenes (http://bigsdb.pasteur.fr/
listeria/).
bMaury’s classification of genotypes (11) into hypervirulence (⫹) and hypovirulence (⫺). cIsolates included in RNA-seq are noted as “Yes.”
dFPE, food processing environment; NA, information not available. eNA, information not available.
a trend of lower coordinates for samples corresponding to lineage II, whereas PC4 exhibited positive correlation ( ⫽ 0.46). This result was expected because of the aforementioned exclusive distribution of hyper- and hypovirulence genotypes in lin-eages I and II, respectively. Furthermore, in conjunction with the lower correlation between the coordinates of two biological replicates on PC2, it showed that PC2 tended to separate the two replicates ( ⫽ 0.65), with a trend of higher coordinates for samples corresponding to the BR2.
Dissimilarity between BRs was further investigated by analyzing the new transcrip-tome data sets generated by removing the variations captured by preceding PCs (Fig. 5D). The result revealed that jointly filtering out the variations captured by PC1 (reflecting transition of growth phases) and PC2 (reflecting a difference between the two BRs) globally decreased the distance between the two transcriptome profiles (BRs) available for each isolate.
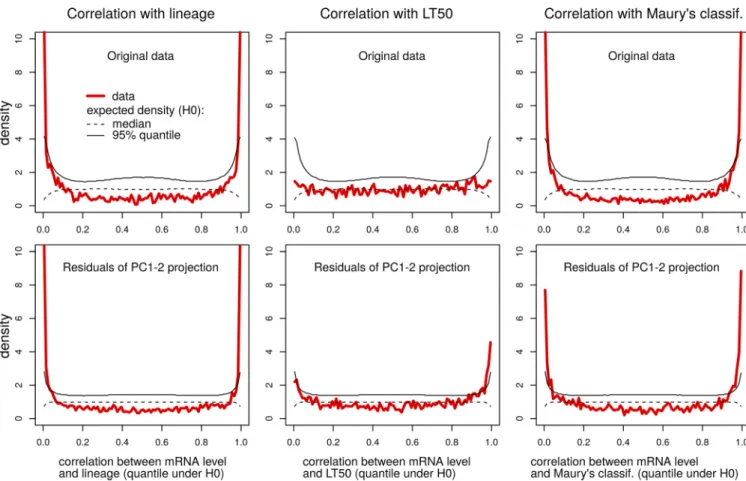
(ii) Construction of a new data set with improved statistical power. Because large variations in transcriptome profiles related to transition of growth phase and systematic differences between BRs can mask more subtle variations associated with the characteristics of the isolates, a refined transcriptome data set was generated by filtering out variations captured by PC1 and PC2 from the original data set. Technically, this data set consisted of the residuals of the PCA projection on the subspace formed by PC1 and PC2. This processing step increased reproducibility of the transcriptome profiles between biological replicates (Fig. 6A) as predicted by the Pearson correlation analysis (Fig. 5D). We also confirmed that it significantly increased the statistical power of some correlation analyses between the transcript levels of individual genes and phenotypic values such as LT50 (Fig. 7). Namely, we examined the distribution of Spearman’s rank correlation between each individual gene (i) and each of the three isolates characteristics (LT50, Maury’s classification, and lineage number), denoted by c. This was done in terms of quantiles corresponding to the values ofi,cunder the null
hypothesis of no statistical association between transcript levels and covariate values such that departure from the uniform distribution is the landmark of the presence of
FIG 2 Phylogenetic tree reconstructed on the basis of whole-genome sequences for the 33 L.
monocy-togenes isolates selected for transcriptome profiling. The columns to the right of the phylogenetic tree show lineage, MLST genotype (clonal complex [CC] or sequence type [ST]), origin (FPE, food processing environment), virulence level expressed as LT50 (in days) measured in G. mellonella, and Maury’s
classification (11). Maury’s classification (virulence-associated genotype) is shown as follows:⫹,
FIG 3 High variability in the original transcriptome data. (A) Heatmap representation of transcript levels (rpkm) expressed in log2scale for 2,456 genes (row) and 66 samples (column). (B) Coordinates of samples on principal-component axis 1 (PC1), which accounts for 48.4% of the total variance, reveal a continuum of transcriptome profiles. For the purpose of this representation, coordinates on PC1 served to reorder the samples to highlight the continuum of transcription profiles. This reordering was made possible by the fact that many different orderings were consistent with the structure imposed by the dendrogram shown in the top part of the heatmap.
statistically significant associations and can be directly used to estimate false-discovery rates as summarized in q values (45). While no statistical association between gene and LT50 was found with the original data (lowest q value, 0.18; Table S2), 25 genes were attributed q values below 0.10 based on the new data set. Not surprisingly given the correlation between PC1 (growth phase) and the two other characteristics (Maury’s classification of genotypes and lineage number), filtering out the variations captured by PC1 and PC2 slightly decreased the number of statistically significant associations. However, we reasoned that statistical association between growth phase and Maury’s classification (more advanced for hypervirulent genotypes) and lineage (less advanced for lineage II) could still be considered a confounding factor when pinpointing asso-ciations between these factors and individual genes, which also justifies working with the new data set. In sum, removing variations captured by PC1 and PC2 reduced protocol-driven noise and thereby increased statistical significance and biological relevance of correlations.
FIG 4 Principal-component axis 1 (PC1) distinguishes variations arising from changes in growth stage. Distribution of
functional categories among genes that contribute most to PC1 is displayed in the pie chart. Genes of the 100 most negative loading values (A) and the 100 most positive loading values (B) were selected, and the relative ratio (number in 100 genes/number in whole genome) of each functional category was calculated. Categories corresponding to unchar-acterized genes (i.e., “Similar to unknown proteins” and “No similarity”) were excluded from the analysis.
FIG 5 Principal-component axes (PCs) explain relationships between transcriptomes and variables. (A) Variance in
transcriptomes captured by each PC is expressed as a percentage. The first two axes, PC1 and PC2, express 59.6% of
(iii) Comparison to known regulons. Genes were clustered according to the similarity in expression patterns based on the refined data set (left dendrogram in Fig. 6A). Clusters of highly correlated genes (defined by average pairwise Pearson correla-tion greater than 0.6) were numbered according to their sizes. Summarizing for each gene the level of variability by the maximum log2 fold change between any pair of samples pinpointed 12 main clusters of genes with highly variable transcription levels (Fig. 6B and Table S3). Each of these clusters contained at least eight genes, half of which displayed a maximum log2fold change higher than four. Taken together, they encompassed 11.5% (283 genes) of the core genome: 101 genes in cluster 1, 48 genes in cluster 3, 26 genes in cluster 4, and from 8 to 17 genes in the remaining clusters. The gene content of these 12 clusters were investigated in detail, since they reflected the main components of transcriptome plasticity. Clustered genes were compared to previous knowledge of the regulons of 32 transcription factors in order to scrutinize the regulatory networks. Regulons of 8 transcription factors, including the 4 sigma factors (46, 47), CtsR (48), CodY (49), VirR (50), and PrfA (51) were collected from the literature, and regulons of the 24 phylogenetically conserved transcription factors were retrieved from the RegPrecise database (52) (http://regprecise.lbl.gov/RegPrecise/genome.jsp ?genome_id⫽210). PotentiallyB-regulated genes accounted for 86% of cluster 1 and 88% of cluster 4, which is consistent with the proximity of the two clusters in the hierarchical clustering tree (left dendrogram in Fig. 6A). At a distance in the tree, clusters 30 and 45 also included 67% and 50% of genes previously linked toB. In sum, eight clusters contained 41% (130 genes) of the core genome genes previously reported as probable members of the B regulon. Clusters 14, 45, 3, and 30 were dispersed throughout the tree and included 54%, 50%, 35%, and 22%, respectively, of genes previously reported as regulated by CodY. Altogether, they accounted for 42% (30 genes) of the genes previously associated with CodY regulon. In cluster 26, 70% of the genes were probable members of the ArgR regulon which accounted for the whole list of genes linked to this transcription factor. Concurrently, six core PrfA virulons (plcB, actA, mpl, hly, pclA, and inlC) accounted for 75% of the genes of cluster 41 (51). Log2 transcript levels of these core PrfA virulon genes are represented in Fig. S1 in the supplemental material. In total, taking into account other PrfA-regulated genes sparsely located in clusters 1, 4, and 7, 40% of the genes linked to PrfA were detected after clustering. Finally, 52 genes previously identified as virulence-related (40) were high-lighted in the heatmap (Fig. 6A). Their dispersed position implies heterogeneous expression patterns among samples.
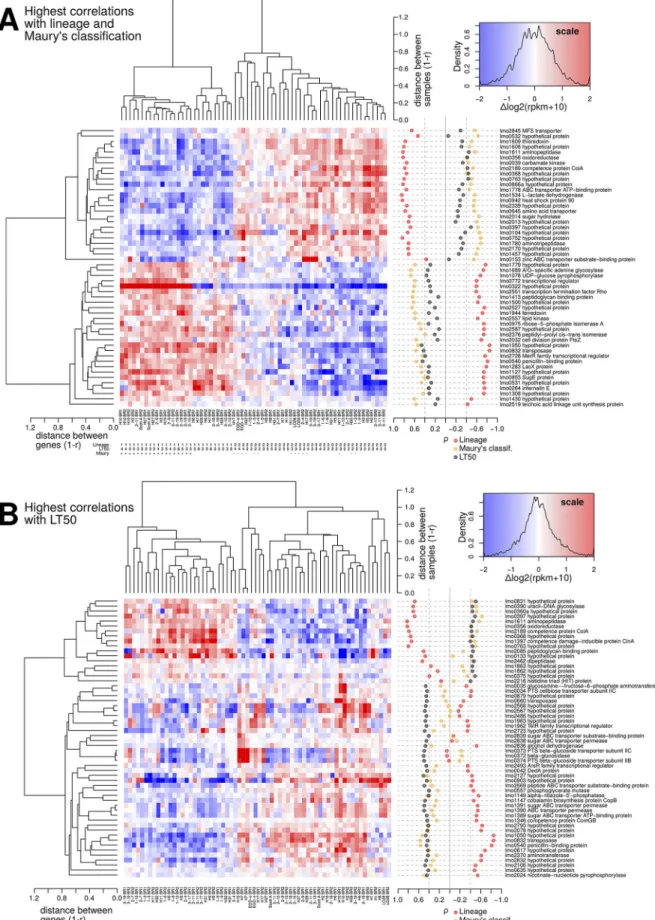
(iv) Correlation with phylogeny, CC-based virulence potential, and virulence phenotype. The refined data set was further exploited to delineate sets of genes whose transcript levels were correlated with lineage, Maury’s classification, and experimental virulence phenotype (LT50). The number of genes whose expression levels were highly correlated (|| ⱖ 0.4) with each of these characteristics was computed (Table 2).
A total of 473 and 222 genes correlated with lineage and Maury’s classification, respectively (Tables S4 and S5). Among the 111 genes positively correlated with Maury’s classification (higher transcript levels in more-virulent CCs), 77% overlapped in the set of 261 genes negatively correlated with lineages (higher transcript levels in lineage I). Similarly, 80% of the 111 genes negatively correlated with Maury’s classifi-cation were present in the set of 212 genes positively correlated with lineage. As mentioned earlier, this high congruency is ascribable to the exclusive distribution of the hyper- and hypovirulent genotypes in lineages I and II, respectively. Only seven and
FIG 5 Legend (Continued)
total data set inertia. (B) Pearson correlation coefficient (r) is measured between coordinates of biological replicates (BRs) on each PC. (C) Spearman correlation coefficient () is measured between coordinates on each PC and the original covariates as follows: virulence measured in G. mellonella (“LT50”), genotypes related to hyper- or hypovirulence (“Maury”), phylogenetic division (“lineage”), and sets of BR (“BR number”). Green and red colors indicate positive and negative correlations, respectively. (D) After eliminating the variations captured by the previous PCs, the average
distances between BR are calculated as “1⫺ r” (r is the Pearson correlation coefficient). For example, point PC3 on the
FIG 6 Analysis of the refined transcriptome data set created by filtering out the variations captured by PC1 and PC2. (A) Heatmap
representing transcript levels (rpkm) in log2scale expressed for 2,456 genes (rows) and 66 samples (columns). Cutoff at a Pearson correlation
three of the genes known to be linked with virulence in L. monocytogenes (40) were identified in the sets of lineage- and Maury’s classification-associated genes, respec-tively. Heatmap representation of the transcription levels of the genes that were the most correlated to lineage and Maury’s classification were able to discriminate the two lineages and to concurrently group together the isolates with similar virulence poten-tial according to Maury’s classification (Fig. 8A).
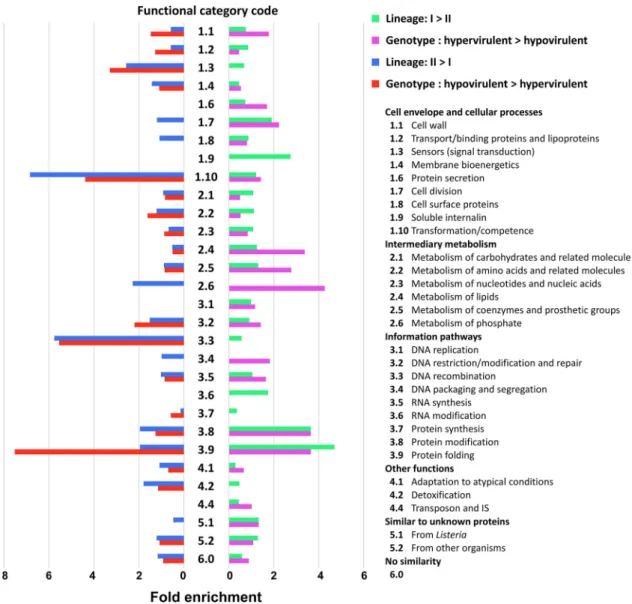
The sets of lineage- and Maury’s classification-correlated genes were further exam-ined in light of the functional categories (Fig. 9). Due to the overlap between lineage and Maury’s classification of genotypes, the two correlation analyses tended to reveal similar enrichment patterns with respect to functional categories. Transcripts showing increased expression in lineage II ( ⱖ 0.4) were enriched (more than onefold) in the functional categories “Transformation/competence” and “DNA recombination.” The categories “Sensors (signal transduction),” “Metabolism of phosphate,” and “Detoxifi-cation” exhibited the same trend, albeit to a lesser extent. In contrast, transcripts showing increased expression in lineage I ( ⱕ ⫺0.4) were enriched in the functional categories “Soluble internalin” and “RNA modification.” Of note, the functional
catego-FIG 6 Legend (Continued)
coefficient of 0.6 identifies 12 clusters with more than 8 genes and fold change ofⱖ4. The clusters are indicated by colored bars with cluster
identification numbers to the right of the dendrogram. Genes with known link to virulence (40) are shown by bars to the right of the heatmap, and core PrfA virulons (51) are indicated. (B) Relative abundance of regulons belonging to each cluster is expressed in the pie chart. The cluster number is marked above each circle, and the area of each circle is proportional to the number of genes composing the cluster. A complete list of the genes can be found in Table S3 in the supplemental material. NA, information not available.
FIG 7 Impact of removing PC1 and PC2 on the correlation analysis between transcriptome profiles and isolate characteristics. For each correlation analysis, a
plot shows the distribution of the Spearman correlation coefficients expressed in terms of quantile under the null hypothesis (H0) of no association (i.e., random permutations of the isolate labels) such that deviation from the uniform reflects statistical significance, values near 0 correspond to negative correlations, and values near 1 correspond to positive correlation. Distribution of the correlation coefficients for the actual data set (red line) is plotted along with the median (50% quantile, dashed black line) and the 95% quantile (black line). Distribution of quantiles for the adjusted data set (bottom row) reveals enhanced statistical power in Spearman correlation analysis compared to the original data set (top row).
ries “Protein modification” and “Protein folding” were more than onefold enriched in both analyses; however, they were more highly enriched in genes with increased expression in lineage I. Additionally, hypervirulence ( ⱖ 0.4) was correlated with “Protein secretion,” “Cell division,” “Metabolism of lipids,” “Metabolism of coenzymes and prosthetic groups,” “Metabolism of phosphate,” “DNA packaging and segregation,” and “Similar to unknown proteins from Listeria.” The categories “Metabolism of amino acids and related molecules” and “Protein folding” were associated with hypovirulence ( ⱕ ⫺0.4).
(v) Transcripts whose expression is correlated with virulence level measured in G. mellonella. Because higher LT50 means lower virulence, negative indicates positive correlation between in vivo virulence and transcript level. A total of 56 genes were identified (|| ⱖ 0.4) of which 39 had a of ⱖ0.4 and 17 had a of ⱕ⫺0.4 (Fig. 8B). None of these genes (Table 3) were previously reported as directly virulence associated (40). A total of 14 genes belonged to the category “Cell envelope and cellular processes,” 11 to “Intermediary metabolism,” 3 to “Information pathways,” and 2 to “Other functions.” For 26 genes of unknown function (“Similar to unknown proteins” and “No similarity or information not available”), the online HHpred suite was used to search for possibly remote homology to known protein structures (53). Diverse func-tions were predicted such as carbohydrate transport and metabolism (lmo0635, lmo0879, and lmo2832), defense mechanisms (lmo0375 and lmo1963), lipid metabolism (lmo1862 and lmo1863), histidine triad protein (lmo2216), energy production (lmo1050), translation and posttranslational modification (lmo2078 and lmo2127), and permease (lmo0831). In addition, the 56 genes were compared to the list of virulence genes from the PATRIC database (https://www.patricbrc.org/), and two potential virulence factor genes (i.e., lmo0763, encoding a serine/threonine phosphatase [54], and lmo0540, encoding a penicillin-binding protein [55]) were identified. The heatmap representation (Fig. 8B) roughly split the samples conforming to the PCA result which highlighted that lineages and LT50 were both correlated to PC5 (Fig. 5C).
TABLE 2 Comparison of the number of genes selected by Spearman correlation analysis with different variates (lineage, Maury’s classification of genotypes, and in vivo virulence)
Characteristic
Value by parameter and correlation
Lineagea Maury’s classificationb LT50c
Negative Positive Negative Positive Negative Positive
Designation Lineage_N Lineage_P Maury_N Maury_P LT50_N LT50_P
No. of genesd 261 212 111 111 17 39
Mean ⫺0.54 0.55 ⫺0.48 0.48 ⫺0.44 0.45
FDRe 0.01 0.01 0.04 0.03 0.18 0.15
No. of shared genes
Lineage_N 261 0 0 85 0 24 Lineage_P 0 212 89 0 13 0 Maury_N 0 89 111 0 11 0 Maury_P 85 0 0 111 0 9 LT50_N 0 13 11 0 17 0 LT50_P 24 0 0 9 0 39 Virulence genesf No. of genes 1 6 3 0 0 0 P value 0.04 0.45 0.50 0.17 1.00 1.00
Compared to Severino et al. (41)g
481 (Lineage II⬎ I) 33 71
462 (Lineage I⬎ II) 73 22
aLineage II versus lineage I in relation to transcript levels.
bHyper- versus hypovirulent genotypes (11) in relation to transcript levels. cHigher versus lower LT50 measured in G. mellonella in relation to transcript levels. dNumber of genes having a || of ⱖ0.4 ( is the Spearman correlation coefficient). eFalse-discovery rate (FDR) calculated by averaging the local FDRs.
fCompared to previously identified virulence-related genes (40).
FIG 8 Highest correlation between transcript levels and covariates. (A) Transcripts corresponding to the 15 most extreme negative or positive
values with lineages (30 genes) and with Maury’s classification of virulence genotypes (30 genes). Due to overlaps, the union between these
Among the 56 genes, three operon structures were identified based on the pub-lished operon map (17). Full operons 064 (lmo0372, lmo0373, and lmo0374) and 224 (lmo1389, lmo1390, and lmo1391) as well as two out of six genes in operon 330 (lmo1858 to lmo1863) were found in the list. Moreover, among genes previously not identified in operon structure, four sets of genes at close loci displayed similar expres-sion patterns across samples: lmo0034 and lmo0035; lmo1147 and lmo1149; lmo2567 and lmo2568; lmo2836, lmo2838, and lmo2839.
DISCUSSION
Transcriptional reshaping is the cornerstone of the transition from saprophytism to infection (24). Interestingly, evidence suggests that assessment of in vitro basal
tran-FIG 8 Legend (Continued)
sets resulted in 52 genes. The figure combines a heatmap representation of transcript levels in log2scale, with a graphical representation of
the Spearman correlation coefficients with each covariate as semitransparent dots (red for lineage, orange for Maury’s classification, and black for LT50 measured in G. mellonella). (B) Fifty-six transcripts corresponding to the highest correlations (|| ⱖ 0.4) with virulence level determined in G. mellonella (LT50). Lists of the genes can be found in Table 3 and Tables S4 and S5 in the supplemental material.
FIG 9 Functional classification of transcripts whose expression is correlated with division of lineages and Maury’s classification. Among
the lists of genes selected by Spearman’s rank correlation analysis (|| ⱖ 0.4), a total of 467 (99%) and 219 genes (99%) were
designated to one of the categories, which is present in two higher hierarchies. Fold enrichment was calculated for each category as
TABLE 3 List of genes whose transcript levels are correlated with virulence measured in G. mellonella
Functional classificationa Locus tag
Spearman correlation analysis
Product HHpredd
Corc value P value
1. Cell envelope and cellular processes
Cell wall lmo0540b N 0.445 0.007 Penicillin-binding protein
Cell envelope and cellular processes
lmo0034 N 0.438 0.003 Phosphotransferase system (PTS) cellobiose transporter subunit IIC
lmo0373 N 0.492 0.001 PTS beta-glucoside transporter subunit IIC lmo0374 N 0.494 0.001 PTS beta-glucoside transporter subunit IIB lmo1389 N 0.443 0.003 Sugar ABC transporter ATP-binding protein lmo1390 N 0.494 0.001 ABC transporter permease
lmo1391 N 0.492 0.001 Sugar ABC transporter permease lmo2569 N 0.491 0.001 Peptide ABC transporter substrate-binding
protein
lmo2838 N 0.449 0.001 Sugar ABC transporter permease lmo2839 N 0.404 0.002 Sugar ABC transporter substrate-binding
protein
Cell surface proteins lmo2085 P ⫺0.448 0.006 Peptidoglycan binding protein Transformation/competence lmo1346 N 0.433 0.001 ComGB; competence protein ComGB
lmo1397 P ⫺0.401 0.016 CinA; competence damage-inducible protein lmo2189 P ⫺0.421 0.012 CoiA; competence protein
2. Intermediary metabolism Metabolism of carbohydrates
and related molecule
lmo0035 N 0.464 0.001 Glucosamine-fructose-6-phosphate aminotransferase
lmo0356 P ⫺0.416 0.013 Oxidoreductase lmo0372 N 0.504 0.001 Beta-glucosidase lmo0557 N 0.401 0.006 Phosphoglycerate mutase lmo2836 N 0.469 0.000 Alcohol dehydrogenase Metabolism of amino acids
and related molecules
lmo1611 P ⫺0.449 0.006 Aminopeptidase lmo2370 N 0.421 0.006 Aminotransferase lmo2462 P ⫺0.466 0.001 Dipeptidase Metabolism of coenzymes
and prosthetic groups
lmo1147 N 0.477 0.001 CopB; cobalamin biosynthesis protein lmo1149 N 0.405 0.005 Alpha-ribazole-5’-phosphatase lmo2024 N 0.440 0.002 NadC; nicotinate-nucleotide
pyrophosphorylase
3. Information pathways DNA restriction/modification
and repair
lmo0390 P ⫺0.436 0.004 Uracil-DNA glycosylase
RNA synthesis lmo1962 N 0.449 0.002 TetR family transcriptional regulator lmo2493 N 0.452 0.001 ArsR family transcriptional regulator 4. Other functions
Transposon and IS lmo0660 N 0.444 0.000 Transposase lmo0832 N 0.425 0.010 Transposase 5. Similar to unknown proteins
From Listeria lmo0617 N 0.423 0.007 Hypothetical protein [PF16729.5_99.2%] DUF5067; domain of unknown function
lmo2568 N 0.462 0.000 Hypothetical protein [COG5294_99.9%] YxeA; uncharacterized protein YxeA, DUF1093 family (Function unknown)
From other organisms lmo0042 N 0.437 0.001 DedA protein; uncharacterized membrane protein
[COG0586_99.8%] DedA; uncharacterized membrane protein DedA, SNARE-associated domain (Function unknown) lmo0133 P ⫺0.419 0.009 Hypothetical protein [COG3592_98.2%] YjdI; uncharacterized Fe-S
cluster protein YjdI (Function unknown) lmo0397 P ⫺0.488 0.003 Hypothetical protein [cd08899_99.8%] SRPBCC_CalC_Aha1-like_6;
putative hydrophobic ligand-binding SRPBCC domain of an uncharacterized subgroup of CalC- and Aha1-like proteins lmo0635 N 0.414 0.003 Hypothetical protein [COG0637_99.9%] YcjU;
beta-phosphoglucomutase or related phosphatase, HAD superfamily (Carbohydrate transport and metabolism, General function prediction only) lmo0763b P ⫺0.438 0.007 Ser/Thr protein phosphatase family protein [COG1408_100%] YaeI; predicted
phosphohydrolase, MPP superfamily (General function prediction only) lmo0831 P ⫺0.502 0.001 Hypothetical protein [COG0679_100%] YfdV; predicted permease
(General function prediction only) lmo0879 N 0.453 0.003 Hypothetical protein [COG3623_100%] SgaU;L
-ribulose-5-phosphate 3-epimerase UlaE (Carbohydrate transport and metabolism)
scription of some bacterial pathogens could be informative of their virulence level. For example, transcriptional profiling of methicillin-resistant and -susceptible cultures of Staphylococcus pseudintermedius identified differentially expressed genes such as sur-face proteins, toxins, and prophage genes that might contribute to virulence (42). In the current study, we produced a comprehensive transcriptome data set from which basal transcription patterns were analyzed in multiple aspects putatively associated with virulence potential. The experimental design of the current study specifically aimed at establishing links between phenotype and transcriptome across the diversity of the Listeria monocytogenes species. To optimize the statistical and biological relevance of the correlations with fixed resources, we maximized the number and diversity of
TABLE 3 (Continued)
Functional classificationa Locus tag
Spearman correlation analysis
Product HHpredd
Corc value P value
lmo0903 N 0.443 0.005 Hypothetical protein [COG1765_99.9%] YhfA; uncharacterized OsmC-related protein (General function prediction only)
lmo1050 N 0.463 0.006 Hypothetical protein [COG1853_100%] RutF; NADH-FMN oxidoreductase RutF, flavin reductase (DIM6/NTAB) family (Energy production and conversion)
lmo1862 P ⫺0.438 0.001 Hypothetical protein [cd04506_99.9%] SGNH_hydrolase_YpmR_like; members of the SGNH-hydrolase superfamily, a diverse family of lipases and esterases
lmo1863 P ⫺0.437 0.003 Hypothetical protein [COG1307_100%] DegV; fatty acid-binding protein DegV (Lipid transport and metabolism)
lmo1963 N 0.471 0.001 Hypothetical protein [COG4200_99.6%] EfiE; predicted lantabiotic-exporting membrane pepmease, EfiE/EfiG/ ABC2 family (Defense mechanisms) lmo2078 N 0.432 0.004 Hypothetical protein [COG0802_100%] TsaE; tRNA A37
threonylcarbamoyladenosine biosynthesis protein TsaE (Translation, ribosomal structure and biogenesis) lmo2106 N 0.474 0.000 Hypothetical protein [COG1408_100%] YaeI; Predicted
phosphohydrolase, MPP superfamily (General function prediction only) lmo2127 N 0.507 0.001 Hypothetical protein [COG1266_98.9%] YdiL; membrane protease
YdiL, CAAX protease family
(Posttranslational modification, protein turnover, chaperones)
lmo2216 P ⫺0.403 0.000 Histidine triad (HIT) protein [COG0537_99.9%] hit; diadenosine tetraphosphate (Ap4A) hydrolase or other HIT family hydrolase (Nucleotide transport and metabolism, Carbohydrate transport and metabolism, General function prediction only)
lmo2486 N 0.450 0.000 Hypothetical protein [PF13349.6_99.9%] DUF4097; putative adhesin lmo2723 N 0.484 0.002 Hypothetical protein [COG2153_99.8%] ElaA; predicted
N-acyltransferase, GNAT family (General function prediction only)
lmo2832 N 0.452 0.004 Hypothetical protein [COG1929_100%] GlxK; glycerate kinase (Carbohydrate transport and metabolism)
6. No similarity or no information available
lmo0375 P ⫺0.487 0.003 Hypothetical protein [COG3077_90.9%] RelB; antitoxin component of the RelBE or YafQ-DinJ toxin-antitoxin module (Defense mechanisms) lmo2567 N 0.480 0.000 Hypothetical protein [PF13314.6_86.3%] DUF4083; domain of
unknown function
lmo2793 N 0.411 0.005 Hypothetical protein [PF17178.4_80.5%] MASE5; membrane-associated sensor
lmo0360a P ⫺0.438 0.005 Hypothetical protein [PF14143.6_78.3%] YrhC; YrhC-like protein (Function unknown)
lmo0368 P ⫺0.441 0.008 Hypothetical protein [KOG0142_99.8%] isopentenyl pyrophosphate: dimethylallyl pyrophosphate isomerase (Secondary metabolites biosynthesis, transport and catabolism)
aFunctional classification for L. monocytogenes EGDe (http://genolist.pasteur.fr/ListiList/). bVirulence factors identified from PATRIC (https://www.patricbrc.org/).
cCorrelation with virulence measured in G. mellonella. N, negative correlation; P, positive correlation. dHomology detected by HHPred is expressed as: [identifier_probability percentage] product (function).
isolates profiled in the transcriptomic study by including only two biological replicates per isolate. These two biological replicates allowed us to assess the overall variability of the transcriptome profiles but imposed a limit on the power of pairwise comparisons of transcriptome profiles between genotypes, which is a question not directly linked to the identification of relations between transcriptome and phenotype. The study thus focused on correlation between transcriptome and phenotypes measured in vivo (in G. mellonella) or inferred from epidemiological data (Maury’s classification). Given existing links between epidemiological data and lineages and to better understand the global pattern of variations in transcriptome profiles across isolates, correlation between transcriptome and lineage was also evaluated.
Exponentially grown cells in BHI at 37°C were used for transcriptomic analysis, since this in vitro condition was reported to be the closest to that of L. monocytogenes in vivo (36). Part of the core transcriptome variations was explained by slight differences in growth stage at the time of cell harvest. This variation was captured by PC1 that discriminated samples according to the transition from exponential to early stationary phase. Functional analysis revealed that while transcript levels of genes involved in protein synthesis reflected exponential phase, those involved in carbohydrate metab-olism could be linked to the transition to early stationary phase. Indeed, a switch from glycolysis to gluconeogenesis is the most important metabolic rearrangement at the end of exponential growth in various organisms (56). Further systematic experimental noise between BRs was captured by PC2. Exclusion of these variations improved correlations and increased robustness of the conclusions drawn between transcript levels and covariates. Even though PC1 showed significant correlations with some covariates (Maury’s classification and lineage), the improved statistical power of corre-lation analyses supported the rationale for using the new data set. This approach of using PCA to filter noise is reminiscent of its well-established use in genome-wide association studies to search for disease markers. In this context, PCA serves to overcome potentially confounding effects of population stratification from geograph-ical attributes by allowing us to adjust genotypes and phenotypes using the main axes of variations (57, 58).
The statistical treatment unveiled significant correlations between large sets of genes with phylogenetic divergence. Among the most prominent differences in func-tional analysis, “Transformation/competence” and “DNA recombination” were overrep-resented in lineage II isolates. It supports the current evolutionary history of L. mono-cytogenes characterized by higher recombination potential in lineage II than lineage I isolates which may have promoted successful adaptation of lineage II isolates to diverse environments (8). In contrast, functions related to pathogenicity were overrepresented in lineage I isolates. For instance, “Soluble internalin” was enriched only in lineage I, and functions related to posttranslational modifications, namely, “Protein modification” and “Protein folding,” were more enriched in isolates of lineage I than in those of lineage II by 1.7- and 2.8-fold, respectively. Posttranslational modification is one of the crucial strategies employed by pathogens to modify the activity of virulence factors as well as to modulate host cell pathways to their benefit (59). A previous study using a mac-roarray compared the transcriptomes of six isolates (two lineage II isolates and four lineage I isolates) during late-exponential growth in defined medium supplemented with 1% glucose (41). The lack of overlap with the genes identified in the present study may be ascribed to differences in the experimental design and in statistical approaches. Technical variations in obtaining the expression values may have also contributed to the differences. Indeed, the current study used RNA-seq, while the previous study relied on a noisier technology. Moreover, investigating a larger collection of isolates allowed us to better capture intraspecific diversity here.
In spite of the high congruence between the set of transcripts correlated with lineage and Maury’s classification of genotypes, functional analyses highlighted some differences. Genotype-specific features were mainly found in intermediary metabo-lisms: while “Metabolism of lipids,” “Metabolism of coenzymes and prosthetic groups,” and “Metabolism of phosphate” were highly enriched in CC1, CC2, CC4, and CC6,
“Metabolism of amino acids and related molecules” was highly enriched in CC121 and CC9. It is tempting to suggest that these differences in basal metabolism may be linked to niche-specific adaptation strategies which led to the current distribution of these CCs from clinical and environmental sources.
In our data, isolates were clustered according to genes sharing similar transcription patterns. Interestingly, 64% of these clustered genes were found to belong to published lists of regulons, among which were the core PrfA virulon. Considering that the published lists that we analyzed accounted for only 26% of the genes of L. monocyto-genes EGDe, our clustering reflects the strong contribution of the known transcription factors to variability of gene expression during optimal growth.
The conserved innate immune response to microbial infections between insects and mammals as well as its cost efficiency and comparably fewer ethical concerns than with mammals makes G. mellonella an attractive in vivo model for evaluating virulence in bacteria (60), and it was successfully applied to L. monocytogenes (61, 62). In the present study, cells were synchronized to stationary phase during which bacterial physiology remains stable for a wider window of time so as to minimize undesired variations between assays and isolates. We reasoned that the initial growth phase is likely to have little weight on in vivo results, since cells washed with phosphate-buffered saline (PBS) and transferred to larval hemocoel experience physiological changes, including adap-tation to the new environment before resuming infection. Certainly, bacterial adapt-ability to hemolymph and adapt-ability to hijack larval pathways for proliferation are one of the factors driving different levels of pathogenicity (63).
Spearman correlation analysis identified 56 genes whose transcript levels were positively or negatively correlated with G. mellonella in vivo virulence. None of the obvious virulence factors were represented among these genes, confirming that base-line expression of virulence genes strictly restricted to host cell invasion are poor markers of virulence potential. Among the correlated genes were phosphatases that broadly modulate activity of pathogenic bacteria and promote their intracellular growth (64). Similarly, lipid metabolism is important for intracellular life cycle, for example, to make use of host lipids as energy sources and to modulate host immune responses (65). Recent studies found existence of several type II toxin-antitoxin systems in L. monocytogenes connected to stress conditions (66, 67), though their role in virulence needs further investigation. Two competence genes (lmo2189 and lmo1397) were positively correlated, while one (lmo1346) was negatively correlated to virulence level. The Com system of L. monocytogenes is required to promote escape from phagosomes during infection (68). The exact role of these competence proteins in virulence requires in-depth exploration. One of the negatively correlated genes was lmo0540, which encodes a penicillin-binding protein. Although disruption of lmo0540 did not alter resistance to penicillin G and cephalosporins, an insertion mutant showed virulence attenuation in vivo (55). In contrast, other penicillin-binding proteins were reported to induce attenuation of virulence in some bacterial pathogens (69–71), even though antibiotic resistance is evolutionarily intertwined with bacterial virulence. Like-wise, negative correlations between transcript levels of lmo0540 and lmo1963 (hypo-thetical lantibiotic-exporting membrane permease) and virulence in G. mellonella may suggest complex relationships between virulence and drug resistance. Other transcripts negatively correlated with virulence included genes involved in sugar transport (lmo0034, lmo0373, lmo0374, lmo1389, lmo1390, lmo1391, lmo2838, and lmo2839) and metabolism (lmo0035, lmo0372, lmo0557, lmo2836, lmo0635, lmo0879, and lmo2832). PrfA-mediated repression of virulence gene expression by specific carbohydrates is one of the subtle mechanisms that control the onset of infection (72, 73). Correspondingly, PrfA overexpression interferes with glucose uptake which resulted in impaired growth (74). In this regard, the current study showing lower basal transcript levels of those genes in more-virulent isolates grown in nutrient-rich BHI medium suggests further connections between central metabolism and infection. Detailed investigations of bacterial metabolism during infection must be assessed to explore possible links between bacterial fitness and virulence potential.
As a whole, our data evidenced vast variations in virulence phenotype and tran-scriptome profiles. PCA successfully filtered noise from the RNA-seq data set and strengthened experimental reproducibility. Clustering of several regulons across sam-ples featured the role of key transcription factors such asB, PrfA, and CodY in the observed transcriptome diversity. The phylogenetic position appeared to be a major factor underlying transcriptome diversity, since as much as 19% of the genes differentially transcribed correlated with lineage. This result documents a genome-wide physiological differentiation during evolution that parallels previously reported epidemiological differ-ences. Although correlations between virulence determined in G. mellonella and transcrip-tomes were evidenced, it is challenging to identify molecular markers whose transcript levels could predict virulence. We hope that the present study can help in the design of future analyses, at an even more ambitious scale, that are needed to tackle the challenges of integrating epidemiological or experimental data on virulence with transcriptome data. Despite the high interest for this idea, it remains unclear at this stage whether transcriptomics could become useful as a predictive tool for virulence that could be applied to large collections of isolates.
MATERIALS AND METHODS
Isolate collection and culture condition. A collection of 91 Listeria monocytogenes isolates from
various origins, serogroups, and genotypes was used in the current study (Table 1) (29, 75). These 91 isolates were of human origin (33 isolates) and food-related origin (58 isolates). Each experiment was performed with freshly prepared cultures from a stock kept at – 80°C in brain heart infusion (BHI) broth (AES Laboratoire, France) with 8.5% glycerol (Sigma-Aldrich, France). After overnight incubation on BHI agar (AES Laboratoire) at 37°C, a few colonies were suspended in BHI broth and grown overnight at 37°C without aeration. Consecutive subculture (16 h, 37°C) was performed to prepare stationary-phase cells
(mother culture) for infection. The cells were centrifuged (5,000⫻ g, 5 min, room temperature), and
pellets were washed twice with phosphate-buffered saline (PBS). Washed cells were suspended in PBS and calibrated to obtain an optical density at 600 nm of 0.1. Part of the suspension was used for enumeration by serial dilutions in PBS and plating onto BHI agar to retrospectively determine the bacterial counts used for injection. CFU were counted after overnight incubation at 37°C.
Whole-genome sequencing and phylogenetic analysis. The genomes of 15 isolates had been
sequenced in a previous study (75). The paired-end reads used in the study are available under the ENA
bioprojects as follows:PRJEB15592(https://www.ebi.ac.uk/ena/data/view/PRJEB15592) and PRJEB32254
(http://www.ebi.ac.uk/ena/data/view/PRJEB32254).
We sequenced additional isolates for phylogenetic analysis. Exponential cells were harvested by
centrifugation at 5,000⫻ g for 10 min and washed twice with TE buffer (10 mM Tris-HCl [pH 7.5], 1 mM
EDTA). Pelleted cells were resuspended in TE buffer, and cells were sonicated for 56 cycles (with one cycle consisting of 30 s on and 30 s off) at low frequency at 4°C using Bioruptor (Diagenode, Belgium) with several spin-downs at intervals. Fragmented genomic DNA was purified using Nucleospin PCR cleanup kit (Macherey-Nagel, Germany) and checked for quality and size using a Labchip GX II bioanalyzer. End repair was performed, followed by ligation of adapters (Illumina, USA), and the final product was purified using MagSi-NGSPrep Plus (AmsBio, UK). The concentration of each library was measured using Qubit dsDNA HS Assay (Thermo Fisher Scientific, France), and pooled libraries were subjected to additional purification using MagSi-NGSPrep Plus. Sequencing was conducted on Illumina NextSeq 500 platform
(single-end, 1⫻ 75 bp per read). After quality control and trimming, de novo gene assembly was
performed using SPAdes (76) for each genome library. The raw reads are available under the ENA
bioproject PRJEB32882 (http://www.ebi.ac.uk/ena/data/view/PRJEB32882).
The 2,867 coding sequences (CDSs) annotated in L. monocytogenes EGDe (GenBank accession no. NC_003210; length, 2,944,528 bp) were mapped on the 33 assembled genomes to retrieve their pattern
of presence/absence as well as all allelic variants. For this purpose, we used “tblastn” version 2.6.0⫹ with
options “-task tblastn -evalue 1e-10 -seg no” (77) and cutoffs corresponding to 80% identity at the amino acid sequence and minimum coverage of 80% of the query. This procedure identified a total of 2,456 conserved single-copy genes whose amino acid sequences were subjected to separate multiple se-quence alignments using MUSCLE version 3.8.31 with default parameters (78). Custom Perl scripts were used for conversion to nucleotide sequences, concatenation, and gap removing. The resulting alignment of 2,241,553 bp containing 167,253 single nucleotide polymorphisms (SNPs) served for phylogenetic tree reconstruction using PhyML version 20120412 with default parameters (79).
Galleria mellonella injection and virulence assay. Galleria mellonella larvae in their final instar
stage were used (Sud Est Appats Sarl, France). Each larva was injected with 10l (approximately
1.53⫻ 106CFU) of stationary growing cells directly into the larval hemocoel via the last left proleg using
ultrafine (29-gauge) needle insulin syringes. Ten larvae were injected per isolate. After injection, larvae were incubated at 37°C and monitored for survival at daily intervals postinfection up to day 5. Larvae showing no movement in response to external stimuli such as shaking of the petri dish and touching with a pipette tip were considered dead, and the time necessary to kill more than or equal to 50% of larvae (LT50) was recorded. Every trial included 10 larvae injected with PBS as a negative control in order
to confirm their viability. Any experiment which resulted in more than 20% mortality in control larvae was excluded. Assays were repeated at least three times.
RNA extraction and DNase I treatment. Mother cultures (see above) were inoculated into fresh BHI
broth and grown at 37°C for 5 to 6 h to reach exponential phase. RNAprotect (Qiagen, USA) was added, and cultures were vortexed followed by incubation at room temperature for 5 min. The mixtures were
pelleted by centrifugation (5,000⫻ g, 10 min, room temperature), and pellets were suspended in 5 M
guanidine thiocyanate (Roth, Germany) lysis buffer with 10l/ml 2-mercaptoethanol (Sigma-Aldrich). To
lyse cell walls, 0.5-mm glass beads (Roth) were added, and bacterial cells were homogenized using
Tissulyser (Qiagen) at a frequency of 30 Hz for 6 min. After centrifugation (16,000 ⫻ g, 30 s, room
temperature) supernatants were collected, and RNA was purified using column-based RNA Clean & Concentrator-5 kit (Zymo Research, Germany). The quality of extracted RNA was assessed using a Labchip GX II bioanalyzer (Perkin Elmer, USA). To remove DNA contamination, total RNA was incubated with
Baseline-Zero DNase (Epicentre, France) in the presence of RiboLock RNase inhibitor (40 U/l) (Thermo
Fisher Scientific, Germany) for 30 min at 37°C, followed by purification using RNA Clean & Concentrator-5 kit. RNA concentration was measured using Qubit RNA HS Assay (Thermo Fisher Scientific).
Library preparation and sequencing. To enrich mRNA and remove rRNA, total RNA was treated by
using a Ribo-Zero rRNA removal kit (Illumina). Briefly, beads were washed twice and hybridized with probes at 68°C for 10 min. Five hundred nanograms of total RNA was added to the mixture and incubated at room temperature and 50°C for 5 min each. rRNA bound to the beads was separated from mRNA using a magnetic stand. Enriched mRNA was then purified by using a RNA Clean & Concentrator-5 kit, and rRNA depletion was confirmed on the Labchip GX II bioanalyzer (Perkin Elmer).
Preparation of cDNA fragment libraries was performed using NEBNext Ultra II Directional RNA Library Prep kit for Illumina (Illumina) with slight modifications. Briefly, the enriched mRNA was fragmented for 15 min at 94°C and reverse transcribed to synthesize the first-strand cDNA followed by second-strand cDNA synthesis. Double-stranded cDNA (ds cDNA) was purified using NucleoMag (Macherey-Nagel) SPRI selection. End repair was performed on the ds cDNA library, followed by ligation of adapters. High-fidelity PCR was performed using KAPA Hifi polymerase (Kapa Biosystems, Germany) and NEBNext Multiplex Oligos for Illumina (Dual Index Primers) to selectively enrich library fragments. The PCR products were purified twice using NucleoMag SPRI beads, and the quality of the final library was assessed on the Labchip GX II bioanalyzer. Indexed and purified libraries were sequenced on the Illumina NextSeq 500
platform (paired-end, 2⫻ 75 bp per read).
Exploratory transcriptomic analysis. High-throughput RNA sequencing (RNA-seq) was performed
in duplicate on a collection of 33 isolates with independently grown bacterial cells. These 33 isolates were selected to represent the variety of LT values and distribution of lineages, clonal complexes (CCs), and origins in the original isolate collection. Sequencing quality was assessed using FastQC, and Illumina adapter sequences and low-quality base pairs were removed using cutadapt version 1.9 (80). Reads were further trimmed in 3= using the sickle program version 1.33 with option -x and default values for all other parameters (implying a Phred quality cutoff of 20). The cleaned reads were then mapped against the whole repertoire of allelic variants for the 2,867 CDSs annotated in strain EGDe found in the 33 genomes using bowtie2 version 2.2.6 (81) with the options “-N 1 -L 16 -R 4” and converted to bam format using SAMtools version 1.9 (82). Read counts on each allelic variant were obtained using HTSeq-count version 0.10.0 (83) with options “-s reverse --nonunique all -a 1.” Read counts associated with all allelic variants were summed up to obtain a single read count per gene per sample. Importantly, bowtie2 as used here mapped each read on a single allelic variant, ensuring that each read could not be counted more than once and “htseq-count” options allowed us to retrieve the reads that mapped equally well on several sequences as expected given the redundancy of the repertoire of allelic variants.
All subsequent analyses and graphical representations were conducted with R. Read counts were normalized with the function “estimateSizeFactors” provided in the R package DESeq2 (84) version 1.20.0 based on the behavior of the 2,456 conserved single-copy genes (option “controlGenes”) and expressed as rpkm (reads per kilobase per million mapped reads) using the median number of reads aligned on
conserved single-copy genes as the library size. Expression levels were converted to log2scale after
adding a pseudocount of 10 which corresponded approximately to the 10% quantile of rpkm values obtained for the conserved single-copy genes.
Principal-component analysis (PCA) used function “prcomp” in R package “stats” on centered but
nonscaled variables corresponding to the expression values in log2 scale, i.e., log2 (rpkm ⫹ 10).
Hierarchical clustering analyses were performed with function “hclust” in R package “stats” using average
link aggregation method based on Pearson distance (1⫺ r where r is the pairwise correlation coefficient).
Pearson and Spearman’s rank correlation coefficients (denoted as r and, respectively) as well as the P
values associated with the PCs presented in Fig. 5B and C were obtained with function “cor” in R. Heatmaps were drawn with function “heatmap.2” provided by R package “gplots.” Quantiles
correspond-ing to the values of under the null hypothesis of no statistical association between transcript levels and
isolate characteristics (lineage, Maury’s classification of genotypes, and LT50) were obtained by 25,000 random permutations of isolate labels that preserved the correlation between biological replicates. Quantiles were converted to P values of a two-sided test designed to reject the null hypothesis of
random association by applying the transformation 1–2|x⫺ 0.5|. These P values served to estimate the
false-discovery rates (q values) using the R function fdrtool version 1.2.15 (85).
The functional classification was downloaded from ListiList (http://genolist.pasteur.fr/ListiList/) which
consists of 43 functional categories, including three noninformative classes (unknown protein functions) for genes found in L. monocytogenes EGDe.