1
Supporting information
Intrinsic Viscosity of Cyclic Polystyrene
Youncheol Jeong, Ye Jin, Taihyun Chang*
Division of Advanced Materials Science and Department of Chemistry, Pohang University of Science and Technology (POSTECH), Pohang, 37673, Korea
Filip Uhlik
Department of Physical and Macromolecular Chemistry, Charles University, Prague, 12843, Czech Republic
Jacques Roovers
Institute for Environmental Chemistry,
2 Figure S1. A part of the simulation trace for Rg
2
for a polymer chain with 1000 beads. The ensemble average is shown as a line.
Figure S2. A part of the simulation trace for [η] for a polymer chain with 1000 beads. The ensemble average is shown as a line.
3
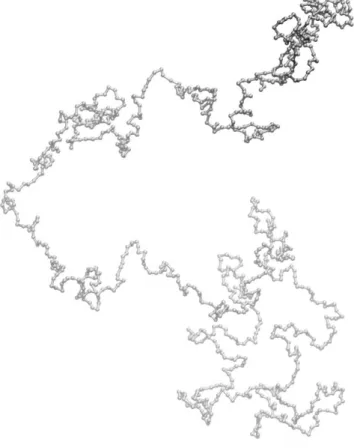
Figure S3. A simulation snapshot of cyclic polymer with 1000 beads with radius of gyration close to the ensemble average.
Figure S4. A simulation snapshot of linear polymer with 1000 beads with radius of gyration close to the ensemble average.
4
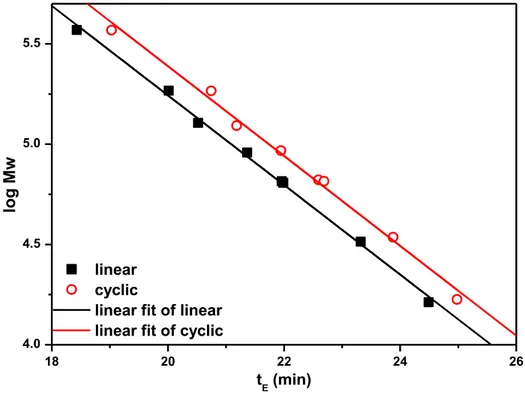
Figure S5. log MW vs. elution time plot of C-PS and L-PS in the SEC analysis. C-PS and L-PS show parallel lines and the shift yields the relationship, MWC, App = 0.72 MWL.
18 20 22 24 26 4.0 4.5 5.0 5.5 linear cyclic
linear fit of linear linear fit of cyclic
lo
g
Mw
5
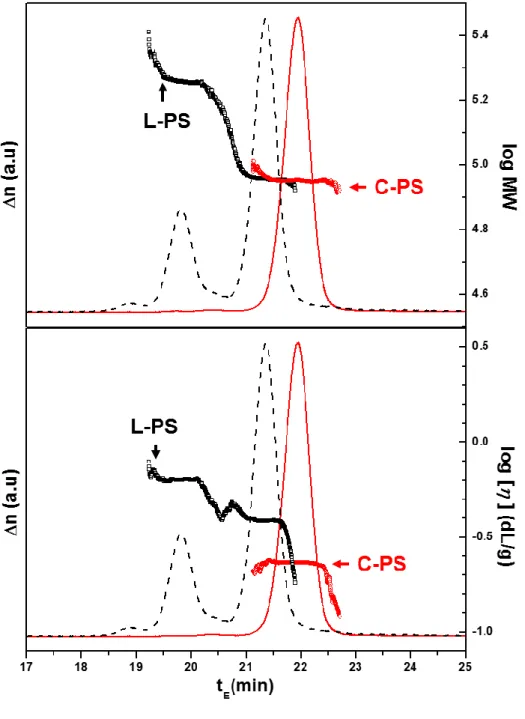
Figure S6. SEC chromatograms of the series of C-PS parts (red solid line) and the L-PS parts (black dotted line) recorded by RI detector. The molecular weight obtained from the LS detection (top) and the intrinsic viscosity obtained from the viscometer detection (bottom) are shown in the plot. SEC condition: three PS/DVB columns (Agilent Polypore 300 × 7.5 mm, Waters Styragel HR4 300 × 7.8 mm, and Jordi mixed bed 300 × 8.0 mm) were used with THF eluent at a flow rate of 0.7 mL/min.
6
7
8
9
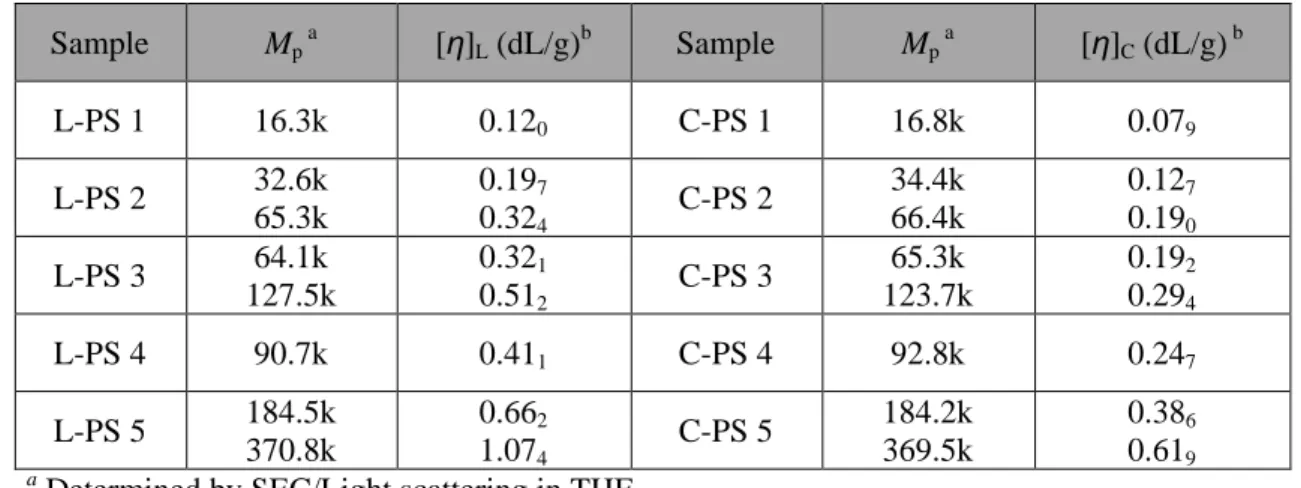
Table S1. Molecular weights and intrinsic viscosities of fractionated L-PS and C-PS samples.
Sample Mp a [η]L (dL/g)b Sample Mp a [η]C (dL/g) b L-PS 1 16.3k 0.120 C-PS 1 16.8k 0.079 L-PS 2 32.6k 65.3k 0.197 0.324 C-PS 2 34.4k 66.4k 0.127 0.190 L-PS 3 64.1k 127.5k 0.321 0.512 C-PS 3 65.3k 123.7k 0.192 0.294 L-PS 4 90.7k 0.411 C-PS 4 92.8k 0.247 L-PS 5 184.5k 370.8k 0.662 1.074 C-PS 5 184.2k 369.5k 0.386 0.619 a
Determined by SEC/Light scattering in THF.
b
Determined by SEC/Viscometer at Mp in THF at 25oC.
Figure S7. Universal calibration of C-PC and L-PS.
18 20 22 24 26 3 4 5 6 linear cyclic linear fit log [ ]M tE (min)
10
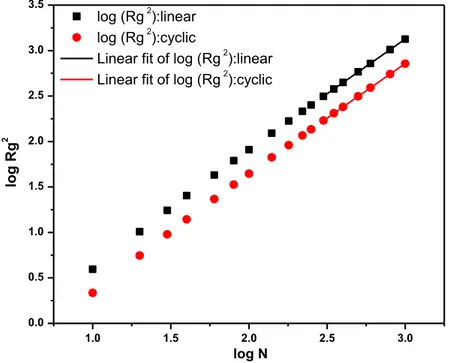
Figure S8. The dependence of the squared radius of gyration on the number of beads. The limiting slopes of linear and cyclic polymers at high N are the same, 1.20.
1.0 1.5 2.0 2.5 3.0 0.0 0.5 1.0 1.5 2.0 2.5 3.0 3.5 log Rg 2 log N log (Rg 2):linear log (Rg 2):cyclic
Linear fit of log (Rg 2):linear
Linear fit of log (Rg 2
):cyclic
Figure S9. The dependence of the intrinsic viscosity on the number of beads. The limiting slopes of linear and cyclic polymers at high N are 0.72 and 0.70, respectively. They are in good agreement with the values of Mansfield and Douglas, 0.711 and 0.692, respectively.
1.0 1.5 2.0 2.5 3.0 0.5 1.0 1.5 2.0 2.5 3.0 log [ ] log N Linear Cyclic
Linear fit of log[]:linear
11 References
1. Mansfield, M.L.; Douglas, J.F., Influence of variable hydrodynamic interaction strength on the transport properties of coiled polymers. Phys. Rev. E 2010, 81, 021803.
2. Mansfield, M.L.; Douglas, J.F., Properties of knotted ring polymers. II. Transport properties.
![Figure S2. A part of the simulation trace for [η] for a polymer chain with 1000 beads](https://thumb-eu.123doks.com/thumbv2/123doknet/14058335.461010/2.893.104.639.222.588/figure-s-simulation-trace-η-polymer-chain-beads.webp)