Publisher’s version / Version de l'éditeur:
Quantitative Biology, 2018-02-21
READ THESE TERMS AND CONDITIONS CAREFULLY BEFORE USING THIS WEBSITE. https://nrc-publications.canada.ca/eng/copyright
Vous avez des questions? Nous pouvons vous aider. Pour communiquer directement avec un auteur, consultez la
première page de la revue dans laquelle son article a été publié afin de trouver ses coordonnées. Si vous n’arrivez pas à les repérer, communiquez avec nous à PublicationsArchive-ArchivesPublications@nrc-cnrc.gc.ca.
Questions? Contact the NRC Publications Archive team at
PublicationsArchive-ArchivesPublications@nrc-cnrc.gc.ca. If you wish to email the authors directly, please see the first page of the publication for their contact information.
Archives des publications du CNRC
This publication could be one of several versions: author’s original, accepted manuscript or the publisher’s version. / La version de cette publication peut être l’une des suivantes : la version prépublication de l’auteur, la version acceptée du manuscrit ou la version de l’éditeur.
Access and use of this website and the material on it are subject to the Terms and Conditions set forth at
Fertilizer usage and cadmium in soils, crops and food
Dharma-Wardana, M. W. C.
https://publications-cnrc.canada.ca/fra/droits
L’accès à ce site Web et l’utilisation de son contenu sont assujettis aux conditions présentées dans le site LISEZ CES CONDITIONS ATTENTIVEMENT AVANT D’UTILISER CE SITE WEB.
NRC Publications Record / Notice d'Archives des publications de CNRC:
https://nrc-publications.canada.ca/eng/view/object/?id=5f55e5a7-f7d7-4ac2-a63d-5a29ab3490df https://publications-cnrc.canada.ca/fra/voir/objet/?id=5f55e5a7-f7d7-4ac2-a63d-5a29ab3490df
arXiv:1802.07338v2 [q-bio.TO] 22 Feb 2018
M.W.C. Dharma-wardana
National Research Council of Canada, Ottawa, Canada, K1A 0R6 and D´epartement de Physique, Universit´e de Montr´eal, Montr´eal, Qu´ebec, Canada.
(Dated: 10-January-2018)
Phosphate fertilizers were first implicated by Schroeder and Balassa in 1963 for increasing the Cd concentration in cultivated soils and crops. This suggestion has become a part of the accepted paradigm on soil toxicity. Consequently, stringent fertilizer control programs to monitor Cd have been launched. Attempts to link Cd toxicity and fertilizers to chronic diseases, sometimes with good evidence, but mostly on less certain data are frequent. A re-assessment of this “accepted” paradigm is timely, given the larger body of data available today. The data show that both the input and output of Cd per hectare from fertilizers are negligibly small compared to the total amount of Cd/hectare usually present in the soil itself. Calculations based on current agricultural practices are used to show that it will take about 18 centuries to double the ambient soil-cadmium level, and about 8 centuries to double the soil-fluoride level, even after neglecting leaching and other removal effects. Hence the concern of long -term agriculture should be the depletion of available phosphate fertilizers, rather than the contamination of the soil by trace metals or fluoride. The conclusion is confirmed by showing that the claimed correlations between fertilizer input and cadmium accumulation in crops are not robust. Alternative scenarios that explain the data are presented. Thus soil acidulation on fertilizer loading, and the effect of magnesium, zinc, and fluoride ions contained in fertilizers are considered using recent Cd2+, Mg2+and F−ion-association theories. The protective role of ions like
Zn, Se, Fe, etc., is emphasized, and the question of cadmium toxicity in the presence of other ions is considered. These help to clarify and rectify difficulties found in the standard point of view. This analysis does not modify the accepted views on Cd contamination by airborne delivery, smoking, and industrial activity, or P-contamination causing algal blooms.
Keywords: Cadmium, metal toxins, fluoride, phosphate, crops, fertilizers, soils, food, mathematical ecology
I. INTRODUCTION
That fertilizers could be a serious source of Cd contam-ination of agricultural soils, and consequently the diet, was suggested almost half a century ago by Schroder
et al [1]. This view has now become a mainstream
paradigm [2, 3] that has raised much public concern [4, 5], as also with the overuse of pesticides [6]. Cadmium in the environment, augmented by industrial activity, years of coal and fossil-fuel usage, mining etc., is a serious health hazard and its monitoring is essential, given its known accumulation in the food chain with the potential for causing chronic diseases of the renal, pulmonary, cardio-vascular and musculoskeletal systems [7, 8]. However, controversy exists regarding a number of aspects [9, 10], and a re-assessment of the “accepted” view of Cd enrich-ment of soils by Cd in P-fertilizers is timely, given the larger body of data available on fertilizer use [11, 12].
Many tropical agricultural communities (e.g., in India, Sri Lanka, El Salvador, Nicaragua, Egypt, China) are fac-ing a new type of chronic kidney disease of unknown aeti-ology (CKDu) appearing even though recognized causes (e.g., diabetes, hypertension, etc.) are absent [13, 14]. Such CKDu is also found in the developed world includ-ing Canada [15]. Some authors have suggested cadmium and other heavy metals to be causative of such chronic kidney disease [13, 16, 17], while the existence of CKDu communities adjacent to non-CKDu communities is con-sistent with other explanations [18–20]. Traditional agri-cultural communities have a relatively low fertizer usage.
For instance, in 2002 El Salvadore (which has CKDu) used about 71 kg/ha while New Zealand (no significant CKDu) used 1836 kg/ha according to [12] data. These show an anti-correlation with fertilizer use and chronic disease, but many authors readily implicate the “green revolution” and P-fertilizers for chronic health issues of unknown aetiology, e.g., [21].
In this study we deal mainly with cadmium toxicity, while our discussion can be easily adapted to other heavy metal contaminants as well. We review the evidence and counter-evidence that exist to claim that increased fertil-izer usage is correlated with increased metal-toxin levels in the soil, together with an increase of Cd in crops grown in such soil. International regulatory bodies have set a 60-70 µg tolerable maximum daily intake for an average adult [22], although some societies traditionally consume rice, or sea-food in diets with Cd exceeding such limits, while remaining quite healthy [23]. Hence, noting possi-ble counter-action among heavy-metal contaminants and micronutrients, a simple model for joint toxicity effects is considered in the last part of this study.
It is argued here that contrary to the commonly held paradigm that ‘the addition of phosphate fertilizers to the soil proportionately increases the bio-available soil cadmium’, simple mass conservation limits any such in-crease to extremely small margins, well within the uncer-tainties of soil chemistry, bio-availability and uptake of metal ions by crops. It is suggested that controlling the Cd content in fertilizers will have no discernible effect on the cadmium content in soil, and in crops. Hence the
increasingly restrictive efforts of some governments, esp. in the EU to minimize dietary cadmium inputs via fertil-izer control will prove to be futile. The European Food and safety Authority (EFSA) set the recommended tol-erable weekly level in the diet at 2.5 µg Cd/kg of body weight in 2012, and proposals to reduce the Cd content in fertilizers correspondingly have been made. Even ac-cording to 2001 regulations more than a decade ago, the amount of Cd allowed was set at 400 mg/kg in USA (e.g.,
in Washington state, for, 45% P2O5 product), while the
EU countries proposed setting limits averaging close to
20 mg/kg of P2O5. In countries like Sri Lanka where
pub-lic concern has been raised, impractical limits as low as 3 mg/kg have been imposed with no basis in science [24]. Roberts, commenting on this restrictive trend remarks in 2012 that “the rationale for the limits provided by the proposal provides little scientific evidence justifying
a limit of 20 mg Cd/kg P2O5and there is little evidence
in the scientific literature suggesting that Cd would ac-cumulate in soils through using P fertilizers containing
less than 60 mg Cd/kg P2O5, much less pose human
health risks” [10]. Similar views are found in recent risk-assessment studies by other authors, e.g., Chaney [9], or the Wageningen University report [25].
In the following we present further evidence against the conventional paradigm of Cd accumulation by fer-tilizer inputs, and examine mechanisms where ferfer-tilizer addition into soils trigger existing soil Cd making it bio-available to plants. Mechanisms like (i) the effect of in-creased acidulation due to fertilizer addition, (ii) compe-tition from ionic forms of Zn, Se, Fe, (iii) salinity effects, (iv) dissolved organic carbon, soil and plant character-istic etc, are usually examined, but in addition we con-sider ionic mechanisms due to added fluoride and mag-nesium, previously inadequately treated in discussions of cadmium dynamics in soils. Hence, if the analysis given here is found to be valid on further investigation, cad-mium uptake by crops from soils may also require con-trolling the magnesium, and fluoride content in fertilizers and in the soil and ensuring an excess of bio-available zinc ions over bio-available cadmium ions.
II. CADMIUM ACCUMULATION AND
FERTILIZER USE
Subsequent to the suggestion of Schroeder and Bal-assa [1] that the use of phosphate fertilizer leads to cad-mium accumulation in soils, interest in monitoring soils for cadmium grew rapidly, with Kjellstrom reporting in 1979 that measured cadmium levels in wheat doubled from 1920 to 1979 [26], while Singh claimed in 1994 that the application of phosphate fertilizer for a period of 36 years resulted in a 14-fold increase in Cd content of sur-face soils [27]. A noteworthy step was the publication of the soil bulletin No. 65 (FAO65) of the food and agri-culture organization (FAO) [11], presenting the status of cadmium, cobalt, and selenium in soils and plants of
0 20 40 60 80
Fertilzer loading [kg/ha]
0 0.04 0.08 0.12 C a Cd
[mg/L] FAO65 Data- Cd in soil
With Cd asymps. FAO65 Data - Cd in Crop
0 20 40 60 80
Fertilzer loading [kg/ha]
5 6 7 8
Soil pH with pH asymps.
FAO65 pH 5 6 7 8 Soil pH 0.3 0.4 0.5 0.6 0.7 0.8 0.9 1 R a [available Cd fraction] Ra= CaCd /(Total Cd) (a) (b) (c)
FIG. 1. (On line colour)(a) Boxes, Soil cadmium (extracted
using a mild regent) Ca
Cd as functions of P-fertilizer input,
(FAO Soil Bulletin No. 65) and extension (dashed lines) af-ter imposing asymptotic constraints. Solid line: cadmium in crop per kg of dry matter. (b) Soil pH calculated using a
re-gression relation between pH and Ca
Cd from FAO65 and after
constraining the alkaline regime (pH¿7) to ambient natural CCd. (c) The fraction of available Cd in the soil, with theb mean total soil cadmium taken at 0.12 mg/L of soil.
thirty countries, determined within a uniform protocol enabling international comparisons. Data from Figure 5 given in FAO65 are shown in Fig.1(a), where a clear correlation of the Cd content in the soil extracted using a mild reagent (see below) are shown for a time dura-tion of three years of P-fertilizer applicadura-tion. A simi-lar curve for the cadmium content in crops is also given in Fig.1(a) and show a similar dependence on cadmium
loading. Sillanp¨a¨a et al. concluded that “although the
fertilization data covers only three years, the relatively firm correlations leave no doubt as to the increasing effect of phosphorous fertilization on the Cd contents of both plants and soils”. However, from this observation it also needs one further tacit assumption to conclude that this increased cadmium comes from the cadmium impurities contained in the P-fertilizers added to the soil annually.
Sillanp¨a¨a et al. do not in fact make that assumption, but
many readers may easily do so. This may be called the “Soil-Cd Enhancement by Fertilizers” (SCdEF) assump-tion, and is articulated quite clearly in many other works [5, 28–33]. In the following we argue that the data can be more correctly interpreted as a case of the P-fertilizer triggering the conversion of already existing soil cadmium to an ‘available form’ of cadmium extractable by mildly acidic reagents.
Hence it is instructive to reexamine many of the studies of the period when the SCdEF paradigm was developed. McLaughlin et al. present a soil-balance calculation in the caption to their Table 2 which states the following. “Assumes 20 kg P/ha applied per wheat crop and 80 kg P/ha per potato crop and fertilizer contains (per kg P) 50 mg As, 300 mg Cd (250 mg Cd for potatoes), 5 mg
TABLE I. Cadmium and phosphorus concentrations in some rock phosphate sources for fertilizers.
Source Cd P Cd [mg/kg] % [ mg Cd /kg P ] Russiaa 0.2 17 1 China(Yunan)a 5 14 35 Sri Lanka: (Eppawala)† <3 14 34 (imported)b† 2.3-46 7-20 325 India (Mussoorie)c † 8 12 62 Egypta 8-9 13 61-67 Moroccoa 12-34 14-15 88-240 USA (N.C.)c 33 15 240 Nauru (NZ)a 100 15.6 641 a[29];b [34];c[35]; †Estimated.
Hg, 200 mg Pb and 200 g F. Element inputs in irriga-tion water assumed to be negligible, although F may be a significant impurity in some waters”. They also assume a fertilizer-application depth of 100 mm of soil, taken to have a density of 1.3 kg per litre. No leaching of the metal impurities added to the soil via the fertilizer is included, but such corrections can be easily applied. McLaughlin
et al. report analytical data for a variety of phosphate
fertilizers. We have included a selection of these in Ta-ble I together with other data, e.g., for Sri Lanka and India where some regions are affected by chronic kidney disease. Columns 2 and three in the Table enable one to roughly convert among the various methods of indicating the Cd concentration in rock-phosphates, viz., as mg/kg
of rock, mg/kg of P, or mg per kg of P2O5, with a ratio
of 0.22 for P/P2O5. In citing published work we have
re-tained the concentration units used by the cited authors. For single superphosphate (SSP) produced by react-ing phosphate rock with sulphuric acid, and triple super phosphate (TSP) produced by acting on phosphate rock with phosphoric acid, all the Cd in the phosphate rock is transferred to the SSP or TSP. In wet-process phos-phoric acid (WPA), About 55-90% of the Cd is trans-ferred to the acid with the balance to the gypsum (a by product). Ammonium phosphates (e.g. monoammonium phosphate [MAP] and diammonium phosphate [DAP]) are produced from WPA. Their Cd content can range from < 1 to > 100 mg/kg, depending on the mineral.
A. Cd input into the soil on application of phosphate fertilizer.
In order to examine more closely the validity of the SCdEF assumption, we recalculate the incremental
change in the soil-cadmium concentration, ∆Cs
Cd on
ad-dition of P-fertilizer to the soil. We summarize the result
using the symbols AFfor the amount of fertilizer (kg/ha)
applied annually, CF
Cd for the concentration of Cadmium
(mg/kg) in the fertilizer, dsthe depth of the soil layer in
cm., while ρs is the density of the soil in kg/litre. The
total concentration of soil cadmium is denoted by Cs
Cd.
Then the change ∆Cs
Cd on fertilizer loading is:
∆CCds = AFCF Cd dsρs ×10−8, Cd, g/kg of soil (1) = 10A FCF Cd dsρs , Cd ng/kg of soil (2)
The change of Cd concentration, being very small, is given in nanograms per kg of soil in Eq. 2. We have ig-nored the additional inputs (e.g., via airborne Cd and via irrigation water) although airborne Cd may be a major source of Cd deposited on soils in industrialized countries. The Cd inputs via irrigation water can be neglected in normal farming environments in most countries like the EU, Canada and USA, and even in less regulated non-industrial environments.
For instance, in a publication relating to CKDu in Sri Lanka [36] the authors considered the non-point source transport of phosphate by the irrigation waters of one of the major rivers (Mahaweli) of Sri Lanka, but the amounts of Cd and other metal toxins transported in the same manner would be quite negligible, being present in parts per million compared to macro-nutrients. The latter (e.g., phosphates) are important pollutants that cause algae blooms. Diyabalanage et al [37] confirmed by detailed analytical studies of Mahaweli river water that metal toxin levels are indeed below maximum allowed limits (MALs). Similarly, Jayasinghe et al [38] showed that toxin levels in irrigation waters were well below the usual MALs and hence required no reverse-osmosis treat-ment to render them safe. McLaughlin et al [29] also dis-regard irrigation-water inputs of Cd into farm soils. A study of the translocation and dispersion of pesticides by irrigation waters of the Mahaweli river also showed the effect to be negligible [39].
Essentially the same analysis as for Cd can be used for As, Pb and other heavy-metal additions to crops via fertilizers, be they wheat, barley, rice, or any other crop,
and the concentration increment ∆Cs
Cdturns out to be in
parts per trillion to fractions of parts per billion (µg/kg of soil). Only a fraction of this, say 0.2-0.8 would be bio-available. This is further lowered if we take into account any leaching effects of rain fall and irrigation wash-off (esp. under monsoonal conditions in the tropical belt).
Thus, even after a millennium of industrial agriculture using a typical rock-phosphate fertilizer (see Table I), the total Cd inputs remain negligible even for accumulations over centuries [20].
In contrast, the calculations of the “cadmium bud-get” given in publications by various authors usually extract a different conclusion that supports the SCdEF
paradigm. The ambient total cadmium Cs
Cd in
Euro-pean soils (within the ‘plough layer’) can range from 0.05 mg/kg to higher values (in industrialized areas e.g., in Belgium, Hungary). Soil cadmium amounts in Shipham,
Wales, UK, ranges from 9 mg/kg – 360 mg/kg [4]. A mean value of 0.4 mg/kg is sometimes used in model calculations for the EU [25], while 0.3 mg/kg has been proposed by [40] as an average for the EU. Scandinavian soils have a lower average of 0.2 mg/kg [41].
Interestingly, the Cd concentrations in the soil of Sri Lanka are reported to range from 0.42 mg/kg in forest soils, to as high as 5 mg/kg in lake sediments [42]. How-ever, most of the cadmium in Sri Lankan soils is found as bound cadmium, since the Cd contents in water and in soil solution were found to be < 3µg/L and are below the MAL [13].
T`oth et al [5] raises the interesting possibility that the low values of Cd in E. Europe, in comparison to W. Eu-rope, are possibly due to the use of Russian P-fertilizer in E. Europe, as opposed to Moroccan fertilizer used in W. Europe. However, the calculations presented in Sec. II A show that the Cd content of Moroccan P-fertilizer can-not account for such a difference. The high content of soil Cd in industrialized regions (e.g., in W. Europe) should be attributed to industrial activity, coal-power produc-tion, and Cd deposition from emissions. These are in fact more important than Cd inputs via P-fertilizer ap-plications. Fortunately, according to Smolders et al [40] airborne Cd sources have decreased by a factor of five
between 1980 and 2005. They propose a 0.35 g ha−1yr−1
as the mean Cd airborne deposition rate for the EU re-gion currently. We limit our study to soil cadmium and Cd from fertilizer inputs.
In order to understand the difference between our con-clusions and the traditional approach to the soil budget for cadmium, we review such a calculation [30] for south-ern Sweden. Eriksson considers the cadmium inputs and
outputs (g ha−1y−1) in his cadmium budget.
1.P-fertilizer, 0.12g from 10 kg P ha−1containing 12
mg Cd kg−1
2.Deposition: 0.7g from airborne sources, rain etc.
(Note that Smolders et al [40] proposed a 0.3 g annual addition from deposition as an EU average in 2013).
3.From lime, 0.02g added for soil remediation.
4.Hence total Cd input = 0.84 g ha−1y−1
Cadmium removal from soil is evaluated as follows:
1.crops, 0.23g by plant uptake, removal of roughage,
stubble etc.
2.leaching, 0.40g Cd, assuming a top soil layer 25
cm deep.(N.B., much higher leaching rates are pro-posed in recent studies as European averages, e.g., in [40]).
3.Total amount removed = 0.63g.
This leads to a total accumulation of 0.21 g ha−1y−1,
1/3 of which is due to deposition. The amount that may
be claimed for P-fertilizer is 0.12 g ha−1y−1, and this is
taken to support the SCdEF paradigm, leading to the conclusion that accumulation of Cd impurities in fertil-izers pose a serious health risk. However, this accumu-lation occurs in a soil volume 25cm deep over an area
of a hectare, i.e., in a soil volume of 25×105 liters,
cor-responding to a soil weight of 3.25 ×10⁶ kg with a soil
density of 1.3 kg/L, producing a change in cadmium
con-centration ∆Cs
Cd= 43 × 10−9 g/kg of soil, i.e., a change
of the order of 40 ng/kg. Thus Eriksson’s Cd budget, and those of other workers are consistent with our cal-culation giving mere nanogram/kg changes in cadmium
concentration in the soil. The mean median cadmium
concentration in top soils (0.2 mg/kg) and subsoils (0.1 mg/kg) as reported by Eriksson [41] are trillion times bigger. The total soil cadmium in the plough layer is 650 kg/ha. Hence the parts per trillion increase in cadmium concentration due to fertilizers is negligible. Unlike the
0.12 g ha−1y−1 Cd input of the P-fertilizer, the 0.7 g
ha−1yr−1 airborne deposition of airborne Cd does not
necessarily get ploughed into a 25cm deep soil layer, but affects a few centimeters of the topmost layer, causing more drastic changes in the soil-Cd concentration in the near surface.
In Loganathan et al [3], Table 2, those authors present a calculation to estimate the time taken for doubling the concentration of Cd and F in top soils (up to 10 cm) when P-fertilizer is applied annually. We reconstitute their data in Table II and present additional estimates. While [3] used the maximum allowed limits for Cd and F in P-fertilizers in their calculations, perhaps to signal the “worst-case scenario”, it is clear that the use of figures conforming to actual usage patterns gives a very different picture. It will take a millennium to double the concen-tration of soil Cd and soil F, even if we neglect leaching and and removal when crops, roughage, straw etc., are taken away from farmland. Our figure of 46 years in the 1st row of Table II using the inputs of Loganathan et al differs from their estimate of 36 years because they used a soil density of 1 kg/L (similar to that of water), while we use 1.3 kg/L following McLaughlin. Hence the major concern of long-term agriculture should be the depletion of stocks of P-fertilizer and not below-threshold contri-butions to the concentration of trace metals or fluoride coming from fertilizer inputs.
Some caution must be used with published data. Page 27 of the Wageningan study [25] states that “the average annual inputs of fertilizers to agricultural soils are in the order of one to three g/ha/yr. At a Cd level in soil of 0.4 mg/kg, assuming a rooting zone of 20 cm and bulk density of 1.2 kg/L, this amounts to a total Cd pool of approx. 960 g/ha”. In effect, the correct value is 960 kg/ha. Thus the maximum 3 g/ha/yr corresponds to a a change of about three parts per million, and not parts per thousand, as implied there. Nevertheless the authors had correctly noted that “reducing the Cd load by fertil-izer would have a very minor effect on the cadmium pool during the first few decades ...”. In fact it can be further
TABLE II. Estimated time for doubling the concentrations of Cadmium and fluoride in topsoils (density 1.3 kg/L) when 30kg/ha of P-fertilizer are applied annually.
Element amount of depth of Input of change in conc. of Years to
X X in P-Fert. soil ds X conc. of X X in soil double
[mg/kg] [cm] [g/ha/ys] ∆Cs[µg/mg] Cs X[mg/kg] C s X Cda 280 10 8.4 6.46 0.300 46 Cdb 15 20 0.45 0.173 0.300 1734 Fa 200,000 10 6000 4615 300.0 65 Fc 31,000 20 1200 358 300.0 839
aLoganathan et al.(2008) use the maximum allowed limit of Cd, and F in Fertilizers. bWe have used a value as in
McLaughlin et al.(1996). cHere we use the actual average value of F found in P-fertilizers from Table 4 of Loganathan et al.
strengthened to say that there would be a very minor effect even in centuries, rather than decades. A similar analysis can be used to show that trace amounts of ar-senic found in P-fertilizers have a negligible effect on the ambient concentration of soil arsenic [20]. Hence public policies on Cd and As content in P-fertilizers, driven by the SCdEF paradigm cannot be justified by the available scientific data. In fact, the available world reserves of P-fertilizers would probably run out long before the soils reach anywhere near the MALs for adverse health effects. Furthermore, the origin of the increased Cd content detected in the soil, and in crops, c.f., Fig.1(a) using a mild regent, cannot be due to the Cd coming from the fertilizer, but caused to be released from the soil itself, by the action of the fertilizer. We examine this further in the next section.
B. The effect of P-fertilizer on available soil cadmium.
The discussion in the previous paragraphs shows that modifying the cadmium content in the P-fertilizer, e.g., using a low-Cd fertilizer as opposed to a high-Cd fertilizer should show no effect on the Cd levels available in soil solution to crops grown in most soils. In this section we give experimental evidence in support of this conclusion that we obtained from considerations of mass conserva-tion.
Figure 1(a), usually invoked to support the SCdEF paradigm actually implies the opposite (see Sec. III A).
Soil cadmium data reported in [11] had been
deter-mined using the Acetate-Ammonium Acetate Na2EDTA
(AAAc-EDTA) reagent which measures “available” or ‘easily extractable’ Cd rather than the total concentra-tion of Cd per kg of soil. The plot shows that on
applica-tion of 70 kg ha−1y−1 of P-fertilizer for three years, the
available soil Cd concentration had reached 0.12 mg/L,
while a much weaker loading at ≃ 5 mg/kg gives CCd≃
0.04 mg/L. Taking the density of soil to be 1.3 kg/L,
mean increment, ∆Cs
cd= (0.12 − 0.04)/(3 × 1.3)=0.0205
mg/(kg.year). However typical ∆Cs
cd are in the nano
to microgram range (at the most), as seen from calcu-lations given in sec. II A and Eq. 1. Hence this result is 20,000 to 20 times too large for it to have originated from the Cd amounts that were input via the P-fertilizer used. As airborne Cd and other inputs were excluded in the experiments reported in FAO65, conservation of mass implies that almost all of it originated from the
pre-existing cadmium pool in the soil, but initially not
extractable using AAAc-EDTA. It is converted to “avail-able” Cd by some mechanism (see below) activated by the agrochemical inputs, and converted to ionic Cd ac-cessible with the mild reagents like AAAc-EDTA, and
by plants. Of course, the total Cd concentration Cs
Cd
can be determined by standard methods using extrac-tion with strong acids (e.g., 2M nitric acid). Experimen-tally fitted relations (or equivalent data) connecting the AAAc-EDTA extractable cadmium, taken to be of the
form Ca
Cd = a + bC
s
Cd or expressed as log-scaled
regres-sions have been quoted by many authors [29, 40], and in FAO65.
Field experiments showing that the cadmium content of the fertilizer may have little or no impact on the soil cadmium concentration and on the crop-Cd content are found in the literature of the period, and are alluded to in reviews and studies by various several authors, e.g., [29, 43]. Here we refer to a number of such examples, (a) Sparrow et al. (1993) compared Cd uptake by pota-toes fertilized with both low- and high-Cd DAP in field trials. They found little differences in Cd uptake between the two cases, with Cd concentration in tubers being re-lated to the rate of P applied, rather than to the amount of Cd applied.
The Cd content of durum wheat fertilized with MAP containing varying amounts of Cd (0.2, 7.8, and 186 mg/kg), and grown at 11 different locations over a three-year period had no significant dependence on the Cd con-tent in MAP [43]. Thus, in spite of soil differences in the 11 locations, the result remained robust.
(b) P-fertilizers are usually applied to the soil together with N and K fertilizers. Nitrogen-fertilizers (e.g., urea, ammonium salts) are converted by soil bacteria to
ions are transferred to plants. Hence additional avail-ability of Cd in the presence of phosphates may also be caused by accompanying N fertilizers. This may be viewed as due to increased leaching of cadmium fixed in
the soil and conversion to Cd2+ in soil solution, caused
by decreased pH.
Already in 1976 Williams and David (as reviewed in [29]) showed that the concentration of Cd in wheat grains harvested from soils treated with superphosphate and ammonium nitrate exceeded that with superphosphate alone by a factor of two.
(c) McLaughlin has also discussed the work of Sparrow et al.(1993), and those of Williams and David (1977) where it is shown that the addition of P to a soil (with no change in Cd input) increases Cd uptake through a stimulation of root proliferation in the zone into which P is added. (d) Onyatta et al [44] report an increase of available cad-mium in the soil, induced by the use of P-fertilizer used in the from of Idaho mono-ammonium phosphate. They attribute their observations to the release of pre-existing Cd from the soil as well as to the cadmium coming from the fertilizer.
(e) Comparisons between Cd content in crops grown us-ing commercial P-fertilizer, and organic fertilizers in field experiments for rye, carrots, potatoes showed no signifi-cant differences in Cd levels [45],
III. EFFECT OF PHOSPHATE FERTILIZER ON
THE SOIL.
Soil is a complex subsystem containing clay, sand, organic materials loosely called ‘humus’, water, elec-trolytes, and dissolved gases, interacting with an in-terpenetrating subsystem consisting of living organisms made up of micro-organisms, insects, ‘bugs’ and plants. The plants as well as the soil organisms need the mineral nutrients, water as well as some of the organic matter for their existence, and exchange material among them mostly via the soil. The exchange of nutrients between the plant subsystem and the soil can be described by transfer coefficients, and they need to be determined by experiment. From Fig.1(a) we see that the transfer coef-ficent is nearly unity at least for moderate fertilizer load-ings.
Even the processes that occur entirely in the soil, e.g., the behaviour of the added fertilizer, and its partitioning among clay, humus and the aqueous phase of the soil (called the ‘soil solution’) are too complex for us to treat using first-principles atomistic models. Hence it has become the practice to characterize the soil using various macro-parameters of the soil, e.g.,
(a) the pH, soil texture characterized by a texture index (TI, see FAO65), organic matter content (OMC) γ , cation-exchange capacity (CEC) ξ, salinity ζ, hardness η, and electrical conductivity σ;
(b) the concentrations of specific ions (micronutrients) like B, Cu, Mn, Mo, Zn etc.;
(c) elements toxic to humans, like Cd, Pb, Hg, As. However, while concentrations of micronutrients and toxins are specified in ‘defining’ a soil, macronutrients like N, K, P are not specified as they are overwhelmingly
controlled by fertilizer loading. Fertilizers themselves
affect the pH of the soil, and nitrogen fertilizers trigger soil-microbial action generating acids. Hence the crop soils need pH adjustments which are usually achieved by the addition of ag-limes like calcite and dolomite. An element like Cd can exist in several forms in the soil: (i) Cadmium ions chemically replacing Al or Mg atoms in octagonal environments, or replacing Si atoms in tetrahedral environments in clays. These are soil-bound
cadmium with a concentration Cb
Cd. They can be
dislodged using strong reagents.
(ii) Fully or partially hydrated exchangeable Cd ions electrostatically attached to edges, oxide groups etc.,
with a concentration Cxb
Cd. These ions may migrate into
internal sites with time, becoming strongly bound. (iii) Fully hydrated cadmium ions ‘available’ in soil
solution at a concentration of Ca
Cd. These aqueous
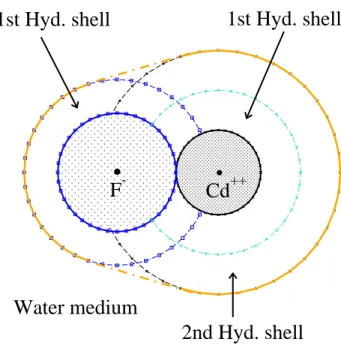
cad-mium ions carry a solvation sheath of water molecules. However stable associations with other ions like fluoride
forming a strong (Cd-F)+ complex ion (see Fig.2)
can occur. It can be shown that such complexes are more stable than the hydrated Cd ion or the hydrated fluoride ion existing without ion association [20]. In such
.
.
F
-Cd
++1st Hyd. shell
2nd Hyd. shell
1st Hyd. shell
Water medium
FIG. 2. (On line colour) A schematic diagram of the (Cd-F)+
ion-pair together with the hydration shells of the Cd2+ ion
and the F−ion prior to pairing. The divalent Cd2+ion holds
tightly two hydration shells, while the monovalent F− holds
only a single hydration shell. The water outside the joint hydration shell of the pair ‘sees’ an ion of effective charge
Zp= 1. The reduction in solvation energy on pairing is offset
cases, essentially all the aqueous cadmium ions are in
associated from since the F− concentration is largely in
excess of the Cd2+ concentration in most soil solutions.
To complicate matters, such associated ions can also attach electrostatically to edges, and surfaces of soil
particles, and hence also contribute to Cxb
Cd. As they
have a lowered positive charge, they are more weakly bound electrostatically.
Thus, while even the specification of the concentra-tion of cadmium is complex due to the several forms, viz. (i)-(iii), reagent chemistry can usually distinguish only between “total cadmium” concentration (extracted using strong acids), and the ‘available’ cadmium con-centration extracted using milder reagents like AAAc-EDTA. Their dependence on macro-soil parameters is obtained from field trials. The use of such macro- param-eters without using a more microscopic physico-chemical model of the soil implies that experimental data con-necting them have to be linked by purely numerical re-gression relations (curve fitting) containing coefficients without a clear physical meaning. For instance, the
bio-available or ‘accessible’ cadmium concentration Ca
Cd in
a soil measured (with a mild reagent) as a function of
the P-fertilizer loading AF can be fitted to a regression
relation as given in Figure 5 of FAO65, log(Ca
Cd) = −1.641 + 0.365 log(A
F). (3)
Logarithms to the base 10 are implied. Similar empiri-cal relationships have been constructed connecting other pairs of parameters like pH, OMC etc., but it is hard to assign error bars and domains of validity to them. Usu-ally, additional field trials fail to reproduce such fits in actual farm situations as additional factors weigh in. Fur-thermore, the use of log-scaled parameters drowns much sensitivity, and renders such equations to be full of pit falls if one were to use several equations in succession to eliminate variables and link a pair of parameters which have not been directly fitted to experiments from field tri-als. Nevertheless, currently used computer codes make wide use of such empirical fits and results of “regression trees” to provide data bases for algorithms whose outputs are rarely physically transparent.
Another approach useful in colloid chemistry is to ex-ploit surface complexation modeling of titration data on clean minerals like gibbsite, kaolinite, providing rate con-stants for Cd absorption, retention etc [46]. However,
most such experiments deal with Cd2+ solutions in the
0.01 Molar solution range or higher, where as the ambient exchangeable cadmium levels in soil solutions are in the milli-molar regime (the bound part of the cadmium pool may be 10 times larger in more alkaline soils). Never-theless, as valid microscopic models are not available, we follow a strategy where empirical regression fits are judi-ciously used by constraining them to known asymptotic behaviours within simplified physico-chemical models.
It is instructive to look at a possible first-principles model of soil even though we will not exploit it fully in
this study. The clay component can be modeled using a
crystal structure where tetrahedral SiO2 sheets and
oc-tahedral sheets (mainly Al or Mg oxide sheets with var-ious cations replacing them) are the building blocks, as in montmorillonite (MMT), illite, or vermiculite. The highly-reactive edge sites and surface defects control the stabilization of soil organic matter, colloidal and rheolog-ical properties [47, 48] The edges of the sheet structure of MMT-type clays represent the boundary that solutes must cross in going between interlayer nanopores and mi-cropores. The dissolution of clay nanoparticles has been observed to proceed predominantly from such edge sur-faces [49]. Hence we may consider such structures where Cd, Mg, Zn and other ions may replace the Al ions in the MMT-type octahedral sites, while some cationic sub-stitution of the tetrahedral Si sites is also possible. Hy-drated ions can remain in the channels between layers, and constitute electrostatically held exchangeable cations in equilibrium with the cations in the soil solution.
The addition of P-fertilizers and other agrochemicals can influence the ambient pool of cadmium in the soil in a variety of ways. These are:
(i) change of soil pH due to P-fertilizer loading, releasing soil-bound Cd into the soil solution,
(ii) change of concentration of competing ions like Zn, Ca, and micronutrient ions,
(iii) we examine the effect of fluoride and magnesium added to the soil via fertilizer loading, and their ion-pair formation, topics which have not been adequately ad-dressed in the past.
(iv)The effect of agrochemicals via their ionicity and ionic strength in modifying the OMC of the soil. Here we use ‘ionic strength’ as used in the theory of strong elec-trolytes, while ’ionicity’ is used to indicate the capacity of an ionic mixture for denaturing or breaking up com-plex structures (e.g., in humus, proteins etc.) by the Hofmeister mechanism [36, 50].
In the following we examine the first three items in greater detail.
A. Change of soil pH due to P-fertilizer loading, releasing Cd into the soil solution.
Although the data given in the FAO soil bulletin No. 65 (FAO65) are somewhat dated, they form a consistent set of continued interest for theoretical modeling. Here we examine the plot II given by [11] using the regression equations given there to clarify possible mechanisms for the increase in Cd content in the soil as P-fertilizer is loaded over a time period.
The amount of cadmium in the soil available to plants depends on the soil pH and its cation-exchange capacity
(CEC), as the H+ ions compete with the Cd ions for
electrostatic binding to edges and surfaces of octahedral and tetrahedral building blocks of clays. Also, decrease of pH hydrolyzes ions bound to humic acids as they are weak organic acids. The data for the cadmium content
TABLE III. Initial pH effect of some common fertilizers on soil acidity, and their nominal Ca and Mg content.
Source initial Ca Mg
pH-effect % %
MAP decreases to ∼ 3.5 – –
DAP increases to ∼ 8.5 – –
Rock-P needs low pH to
act
5-25 5-20
SSP negligible effect 5-20 5-15
TSP ,, 5-13 5-8
Dolomite increases pH 22 12
Sources: [51] and Manufacturers’ data sheets.
in soil used in Fig. 1(a), obtained from FAO65 [11] are for cadmium determined using the AAAc-EDTA reagent as described in FAO65. This in effect extracts essentially
the bio-available Cd, with a concentration Ca
Cd, while
strongly bound Cd located on clay sites are not extracted. Plants are also able to serve themselves of this ‘available’
cadmium. Sillanp¨a¨a et al. give the regression relation,
Eq. 3, connecting Ca
Cd with the the P-fertilizer loading
AF. Here we examine the extent of of pH increase that is
needed to explain these data (Fig. II(a)) and if such a pH-based model is plausible. The rise in the pH associated with the loading of fertilizer may be due to its intrinsic acidity (Table III), or due to bacterial actions triggered by increased availability of fertilizer.
At the high-loading end we may assume that almost all the exchangeable cadmium in the soil has been released. The large-x asymptote to the curve, being a log-log re-gression is somewhat poorly defined, as the fitting has not used such a boundary condition. Nevertheless, we can judiciously take it to be close to the value attained
at the highest loading, viz. Ca
Cd=0.12 mg/L.
Further-more FAO65 provides a regression equation connecting the available cadmium and the pH, viz.,
Ca
Cd = 0.175 − 0.0111pH (4)
The pH used in this equation is the pH determined using
a CaCl2buffer as defined in FAO65. The use of this
equa-tion with Eq. 3 by eliminating Ca
Cd is justified only for
pH≥ 7 as the AAAc-EDTA extraction becomes
ineffec-tive in alkaline media. At Ca
Cd=0.10 mg/L, this equation
predicts a pH of 6.1. Thus the acidulation needed to achieve the observed increase in available soil cadmium is eminently reasonable as continuously fertilized soils are known to reach even higher pH (close to 4) unless reme-died with ag-lime. In order to model the higher (alkaline) range of pH, we assume (using the data in the Appendix 1, FAO65) that the unfertilized initial soil had been ad-justed to a pH of 7.5 at a zero fertilizer loading, viz.,
AF = 0, while the available cadmium in the initial
neu-tral soil is 25% of the total available soil cadmium. In effect, we constrain the regression to satisfy the boundary conditions for small x and large x. The resulting
acidula-TABLE IV. Cadmium, selenium, zinc and fluoride concen-trations in some rock phosphate sources for fertilizers. The indicated Zn concentrations are a lower bound.
Source Cd Se Zn F
[mg/kg] [mg/kg] [mg/kg] [ g/kg]
USSRa,d 0.1-0.2 n.a 19 n.a.
Tunisiaa,d 38-53 11 385 41
Moroccoa,d 3-34 3 209 n.a.
USA (N.C.)c,d 39 5 333 35
Nauru (NZ)a,d 100 n.a. 1000? 30
a[29];b[34];c [35];d[52]
tion curve, i.e., pH due to fertilizer loading AF is shown
in Fig.1(b).
The purpose of the exercise is to demonstrate that while we may qualitatively state that increased acidu-lation of the soil triggered by fertilizer inputs can ex-plain soil-Cd enhancement data like those of the FAO65 set, they can in fact be addressed quantitatively and the results are indeed quite plausible. However, while this might constitute an explanation, it is by no means the only possible scenario that could lead to the observation that the addition of P-fertilizer to the soil increases the cadmium available in the soil and hence in crops grown therein. In fact, given that there are many factors
affect-ing the concentrations of available Ca
Cd and bound soil
cadmium Cb
Cd soil have to be given as a function of al
least the major variables. For instance, a popular empir-ical model is to use the form
CCds = C b Cd+ C a Cd, C b Cd= KDCCda (5)
log KD= a1+ a2pH + a3log CCdb + a4log γ (6)
+a5log(CClay) + a5ξ + · · · ,
where five variables are included via the coefficients ai, i = 1, 2, · · · ,. Equation 5 is written in the form of a
mas-action law using the constant KDalthough this may
not be justifiable as full equilibrium is rarely attained. Cb
Cd consists of lattice-Cd atoms which may be
embed-ded in the tetrahedral -Si and octahedral -Al lattice sites of the clay particles, as well as Cd adsorbed to edges and surfaces of the nanopores and channels of the clay par-ticles and humic acids. The adsorbed Cd is likely to be in equilibrium with the “available” cadmium present in the soil solution, but not with the lattice-embedded cad-mium. In fact, no microscopic model will lead to such a form as the above equation. In fact, Eqs. 5,6 are really a testimony to our lack of a quantitative understanding of the processes involved. When data are analyzed using such fits, in most cases one finds that the pH dependance
associated with the fit parameter a2carries the dominant
effect, providing a basis for the use of the simpler form given in Eq.4.
As a counter argument to focusing on pH, we note that there are many inconsistent results obtained in attempts to control the available soil cadmium by soil-pH
remedi-ation using, say, ag-lime addition (e.g., see Jansson [32] and references therein).
B. Effect of competing ions like Zn, Mg, Fe, etc., on the available cadmium in the soil.
Equation 6 does not make a serious attempt to take account of the effect of other ions like Zn, Mg, Fe etc on the cadmium balance in the soil solution. Zn is in the same group of elements as Cd in the periodic table, and has very similar chemical properties, with Zn being by far the more reactive of the two. The radii of the
hydrated Cd2+, Mg2+ and Zn2+ ions are nearly equal,
being about 4.2-4.4 ˚A depending on the aqueous
envi-ronment. The evidence for such competition between Zn and Cd is widely available in the literature. In addition to their co-action in the aqueous ‘soil solution’ phase, they also compete for sites for incorporation in the inner sub-stitution sites in octahedral and tetrahedral locations of clay crystals. The ionic radii in the crystal lattice largely
favours Mg (0.86˚A), then Zn (0.88˚A) and least of all Cd
(1.09˚A). Thus long-term fixation by incorporation into
the clay lattice applies for Mg, and Zn, but less so for Cd. More attention has been paid in the literature to
ex-change with Ca2+ions (radius in crystals, 1.14˚A), but its
ionic radius is less favourable than that of Mg2+ which is
likely to have a larger impact on cadmium dynamics in the soil, as further discussed below.
Nevertheless, effects of such competing ions are all lumped into the exchangeable cation term ξ in Eq. 6, and in many cadmium ‘risk-assessment’ simulations. This shortcoming is also reflected in the reports of experi-ments on Cd in soil and in crops that fail to report the amount of Zn present together with cadmium, leading to inconsistent conclusions. Greenhouse pot experiments using “simulated” fertilizer mixtures using pure phos-phates and cadmium salts cannot be used to derive con-clusions about actual farming outcomes where fertilizers typically have a Cd/Zn ratio (Table. IV) that may range from 1/10 to 1/100 [9]. That is, Zn largely dominates the Cd input from fertilizers and this effect cannot be ignored, or lumped into a global ‘cation-exchange’ term. The role of Zn has two contradictory effects. We ex-amine them below:
(i) In Sec. II A we showed that the effect of the Cd in-put from P-fertilizers can be neglected, but the Zn inin-put, being possibly a ten to hundred times lager than the Cd input, cannot be neglected, and has a strong impact on
the pre-existing available soil cadmium Ca
Cd as the
Zn-ions will free up many cadmium Zn-ions (denoted by Cdbx)
bound on to soil particles and humic acids moieties.
Cdbx+ Zn2+⇋Cd2++ Znbx (7)
The above equations must be coupled with the equation
for the solubility product for the Cd2+ and PO3−
4
equi-librium since cadmium phosphate is relatively insoluble and the phosphate concentrations in the plough layer are
TABLE V. Concentrations of Cd, Zn and Se present in rice grown in the endemic ‘Dry Zone’(DZ) of Sri lanka, where a form of chronic kidney disease is found and those in the ‘wet zone’ (WZ) which is free of the disease. Median amounts have been used where possible using the data from Diyabalanage et al [55], and Meharg et al[56]. The data are for the grain, while the straw usually has 2-3 times more Cd and Zn content.
Rice unit DZ WZ
Cd µg/kg 52 79
Se µg/kg 26 19
Zn mg/kg 14 16
quite high, thereby suppressing cadmium dissolution into the soil solution.
By making the assumption that the exchangeably
bound zinc, Znxb, and also the available zinc (i.e, Zn2+)
concentrations are quite large compared to the corre-sponding cadmium amounts, the observed enhancement of available cadmium on fertilizer addition displayed in
Fig.1(a) can be explained using a rate constant KDused
in Eq. 5, with KD in the range of 1-100 depending on
various reasonable assumptions that one may make re-garding the initial amounts of bound and available Cd, Zn etc., in the soil prior to fertilizer application. Here we keep the pH fixed as we wish to see if the data of Fig. 1(a) can be explained purely in terms of the impact of cadmium dynamics in the soil. As reported by
Smol-ders et al [40], values for Kdobtained by fitting to data
bases can vary up to even 2300. Hence we see that the increase in available cadmium concentration in soils as observed on fertilizer loading can also be accounted for quite easily by just the effect of Zn addition that occurs automatically via the fertilizer loading, even if the pH were kept constant by calcite addition.
(ii) Even when the available cadmium concentration is augmented by various means, this may not be reflected to the same extent in the plant because the Zn ions will also compete with cadmium ions in the rizosphere. Fur-thermore, the plant will take up both Cd and Zn ions, and the high Zn component will also be reflected in the chemical content of the plant. For instance, taking the rice plant Oriza Satavia, a strong phyto-accumulator of Cd as an example, we show in Table V a typical 1:1000 Cd/Zn ratio in both endemic regions and CKDu-free regions. While the Cd to Zn ratio in the soil may be typically only 1:10 to 1:100, the phyto-accumulation of Zn may be much stronger than that of Cd, further increasing the plant zinc content compared to cadmium. It is believed that this high intake of Zn (and also Se) suppresses the toxin intake of Cd in the gut, and may account for the physiological counteraction of Zn in the diet [53]; and indeed such information has been available in the literature for perhaps over four decades [54].
C. Magnesium and Fluoride mediated enhancement of available cadmium in the soil. Mclaughlin et al [57] drew attention to the impact of salinity and chloride ions on the available cadmium concentration in P-fertilized soils, and proposed that
Cd2++Cl− complex formation in the soil solution has
to be taken into account as a function of the chloride concentration in the soil solution. Smolders et al [58] reported similar results and a linear trend between crop cadmium and soil cadmium. Similarly, Loganathan et al [3] drew attention to the importance of fluoride added to soils via P-fertilizer loading, where they considered mainly fluoride toxicity.
However at the time the impact of fluoride ions on the cadmium balance, or possible synergies of fluoride, mag-nesium and cadmium were not suspected. Recently such synergies among F, Mg and Cd have been proposed to cause enhanced nephrotoxicity [19, 20] via naturally oc-curring fluoride and hard water in dug wells rather than from agricultural inputs. Unfortunately, it is not easy in field trials to control or recognize the role played by many variables like fluoride, chloride, and cadmium levels etc. Furthermore, glass-house experiments do not simu-late the multiple interactions present in actual soils [9]. Of course, results of simplified experiments can be used in principle to construct the synergies and buffering ac-tions that come in to play, but in practice this is full of pitfalls.
Most of the multiple ionic interactions occur in the
aqueous phase of the soil solution and hence they can in
fact be treated rather rigorously using methods of elec-trochemistry and thermodynamics. Manoharan et al [59]
have discussed the complex formation between Al3+ ions
and fluoride as a function of soil pH. However, possible interactions of the fluoride with Cd ions were not dis-cussed.
In [20] we show by calculations of the change in Gibbs
free energy that Cd forms a complex CdF+which is more
stable than CaCl+. Thus the increased presence of F−
ions in the soil solution will bring pre-existing
exchange-ably soil-bound Cd into soil solution by forming CdF+
ions. This effect can contribute to an observed
cad-mium enhancement associated with fertilizer addition, as in Fig. 1(a). However, while Mg, or Al, taken in-dividually with fluoride may show complex formation, a mixture of many ions tends to have a buffering action on each other, and the effects of multiple ions become less marked. This was found to be the case not only from calculations of ionc Gibbs free energies, but also from studies of nephrotoxicity using laboratory mice [19].
IV. CADMIUM CONTENT IN CROPS LIKE
RICE (ORIZA SATIVA)
Fig.1(a) shows the close correlation of the cadmium content in soil and in the plant. Although the rate of
up-take of cadmium from the soil solution during the growth of a plant depends on the growth stage, sunlight, water availability etc., it is possible to make a simple estimate of the final concentration of cadmium, e.g. in paddy and in the water in which it is grown, using a number of sim-plifying assumptions. We present two simple but fairly robust models for the cadmium uptake by a grass or a rice-like plant.
A. Model based on harvest volume
The rice plant absorbs water and cadmium from the
ground and grows from a negligible volume v0to its final
large volume VF during its life time. The water absorbed
is in fact proportional to this increase in volume VF−v0.
Let the volume change at any moment of its growth be dV . Let the concentration of cadmium in the
neighbour-hood of the roots be denoted by Cwat the moment when
the plant has a volume V .
Then the amount of cadmium absorbed by the plant
in changing its volume by dV is CwdV . There is also a
transfer coefficient fsp connecting the Cd concentration
in the soil and the Cd concentration in the plant. As seen
from Fig.1(a) this factor fsp may be taken to be of the
order of unity in typical cases. Hence the total mass of
cadmium MCd absorbed by the plant is:
MCd=
Z VF v0
fsp.Cw.dV (8)
If we assume that fsp and Cw can be replaced by their
average values during the lifetime of the plant, we can take them out of the integral sign and write:
Md= Cw.fsp.(VF −v0) (9)
So, neglecting v0, setting fsp= 1 the cadmium absorbed
by the plant during its life is MCd = CwVF. The final
volume VF used here is the wet volume at harvest and not
the dry volume. We consider a crop grown on a hectare
of land. Let the average height of a plant to be hp, while
the packing fraction is taken tp be fp. Then the volume
of plant matter, and also the weight WF of the total wet
growth are given by
VF = (1 hectare) × hpfp); WF = VFρ. (10)
In the above, ρ is the density, and may be taken to be close to that of water (i.e., 1 kg per litre for order-of
magnitude calculations). The packing fraction fp allows
for the fact that there is space among plants unoccupied
by them. In the case of paddy, we may assume that hp
at harvest is 0.5 to 0.75 m, while the packing fraction fp
may be 0.75 to 0.95 in the full grown condition at harvest time. The above analysis assumes that the water supply to the soil solution remains more or less unchanged at saturation level during growth. In dry-zone cultivation, the soil water may be cutoff at later stages of growth but
such correction effects are indirectly included in the final
plant height and hence on the average high hp used in
the model.
We may now apply the above analysis to compare the predicted values with the Cd data given in Table V re-ported by Diyabanage et. al Ref. [55]. For the case con-sidered, the paddy is grown in a soil containing 0.24 µg of Cd per liter of soil solution [13]. We assume an av-erage height of 0.5m-0.75m for the rice plant at harvest, and a harvest of 4 metric tons of rice per hectare. Typi-cally 1 kg of paddy with 25% moisture content at harvest is brought down to ∼14% moisture content for storage.
Thus taking the total wet-harvest weight WF to be 4-6
metric tons/hectare, we find that the Cd concentration in paddy plants is likely to be in the range 20-100 µg/kg, in consistence with the experimental data of Table V.
B. Model based on water intake
Minerals enter the plants through water intake as well as via aerial deposition. Here we ignore the aerial de-livery which may be important in industrial neighbour-hoods. The water supply needed through out the plant’s life is used up partly in evaporation, and partly by uptake into the plant. If the daily water supply is stated as a
height hw(e.g, 0.10 m), the water volume Vwper hectare
is 104
×hw m3 per day. Of this, a fraction fe is lost by
evaporation and the uptake by the plant is 104h
w(1−fe).
We define the uptake factor fu = (1 − fe). At planting
and at the initial stages fe is significant and may be as
high as 50-60% of that of the grown plant, while most of the water is taken up by the plant during its mid-season growth when the crop is fully developed and in the flowering and grain-setting stage. In ‘dry-harvested’ crops like maize, sunflower or paddy, the end-season
wa-ter needs are minimal. Thus hw(t)fu(t) are functions of
the growth time t, which extents from t = 0 at planting to t = T at harvesting. Let the cadmium concentration
in the water near the roots at the time t be Cw(t). The
soil-to-plant transfer coefficient is fsp(t). Thus the total
mass of cadmium (or any other ion) absorbed is
MCd=
Z T
0
dt104×Cw(t)hw(t)fu(t)fsp(t) (11)
If Cw, fu, fspare replaced by their average values during
growth, and treated as constants, then we may write the total cadmium absorbed by one hectare of crop during its growth season T as
MCd= 104×CwhwfeT = CwfeVw (12)
. Here Vw= Vw is the total water input during the
sea-son. For a 90-day crop requiring an average of 5mm-7mm per day of water, this amounts to 450-600 mm of water per hectare for the whole growth period.
Us-ing the average values fsp ≃ 1, fe ≃ 0.2, hw =7mm
Cw= 0.24µ g/litre, we can estimate the cadmium uptake
by one hectare of a rice plantation during a putative 90-day growth season. Assuming this to yield 4 metric tons of rice grain, and assuming a distribution of 2:1 or pos-sibly 2.5:1 of cadmium between the straw and grain, the calculated concentration in the rice grain (30-80µg/kg) are completely consistent with the values given in Table rice-tab.
Similar calculations can be done for other ions like flu-oride or Zinc. Zn is found in large excess over cadmium according to Table V. Such calculations show that the measured concentrations of ions in crops (e.g., as given in Table V) are in grosso modo agreement with the concen-trations of ions measured in the soil solution, establishing their consistence.
V. TOXICITY EFFECTS OF CADMIUM IN
THE PRESENCE OF OTHER IONS.
The neglect of competitive ionic effects seen in many reported experiments is also seen in the dietary specifi-cations on Cd intake. Thus, as already stated, Se, Zn, Mg, and Fe in the diet have an antagonistic action on Cd toxicity [9, 53, 60, 61] but this is not included or even alluded to in specifying the recommended tolerable monthly intake limits (TMIL) on cadmium in the diet. Of course, local authorities may re-interpret the TMIL to mean that if the Zn inputs are over-overwhelmingly large, then the Cd inputs may be ignored. This happens mainly on the strength of tradition. Sunflower kernels and other foods like shellfish are high in Cd and yet show no ad-verse effects when consumed [23]. Farming communities in the UK in regions with high Cd in the soil consume diets rich in potatoes and cereals without any adverse effects [9]. Similarly, the lack of chronic cadmium toxic-ity in many communities, where rice containing cadmium in amounts exceeding the TMILs has been consumed for generations, can be explained by the protective action of adequate amounts of ions like Zn, Se or Fe in the diet (see Sec.7 of [20], and Sec. 5.4 of [9]). Conversely, when Cd-toxicity from crop products occurs, it is mostly likely that the diet is grossly deficient in protective micronutri-ents like Fe, Zn or Se. Table V shows that Sri Lankan Chronic Kidney disease is uncorrelated with cadmium in rice. Hence other explanations have been conidered [19, 62].
The Codex Alimentarius [63] uses a single- variable step-function model for stipulating a chronic
toxicity-onset amount mCdper kg of body weight per day, week or
month, as is appropriate. No synergies or counter-effects of other contaminants are included in the specification. If for example the daily inputs of Cd, and Zn, Fe ... are
ICd, Ij, j = Zn, Fe, only the amounts scaled by their
bioavailable fractions fa
j are of importance. Many
stud-ies, e.g., Premarathne [33], by Smolders et al [40], values
for Kd obtained by fitting to data bases can vary up to
even 2300. show that fa
j if the order of 30-50% for
com-mon vegetables, rice etc., i.e., fa
each ion has an uptake factor fu
j for intestinal
absorp-tion. Only about 2.5-6% of the bioavailable Cd is
ab-sorbed in the intestines, with fu
Cd∼0.05 [64]. According
to Kim et al [65] cadmium absorption in the gut involves a ferrous transporter, which also takes up Zn, while Zn has other transporters associated with its uptake, and hence the details are unclear [66]. Furthermore, iron de-ficiencies can cause higher Cd absorption. Both ferrous ions and zinc ions are believed to be more actively taken up by this transporter, but even if we assume that the
uptake factors fu are the same for the three elements,
the cadmium uptake will be reduced to a third or less if ferrous and zinc ions are present in equal amounts to compete with Cd. That is, using the simplest picture of a linear model (i.e., without including synergies), it is only if the potential amount of cadmium available in the gut for uptake exceed its competitor ions that there would be absorption. That is, it is reasonable to conclude that the condition ICdfCda f u Cd> ΣjIjfjaf u j (13)
has to be satisfied for any significant cadmium absorption by the gut to set in.
However, the Cadmium TMIL stipulated by CODEX does not even include the bioavailability corrections; it makes no mention of them. The bioavailability factors may also depend on the other components in the diet.
The uptake factors fu have to be determined
empiri-cally and perhaps loempiri-cally as fumight be sensitive to the
overall diet as well. This complexity is the reason why regulatory bodies cannot in fact venture into more com-plex specifications of tolerable daily or monthly intakes of contaminants in the food unless some acceptable ‘gen-eral’ values of factors like fa
j, fjucan be constructed.
VI. CONCLUSION
We have reviewed the widely held hypothesis that “soil-cadmium concentrations get enhanced by the use of P-fertilizer at rates which are likely to create danger-ous conditions for human health in a few decades”, and shown that (a) this strong concern is not at all justified at current levels of fertilizer usage, and (b) the causes of such changes in bioavailable soil cadmium are most probably found in other factors that cause the release of pre-existing soil cadmium.
These conclusions follow since the incremental change in the bio-available soil cadmium concentration on
ad-diton of P-fertilizer is in fractions of micrograms/kg of soil per year, while ambient soil cadmium levels are mil-lions of times larger. The factors that cause the increase in bio-available soil cadmium are most likely to be the following. (i) Change in soil pH due to fertilizer action and associated action of micro-organisms, (ii) The effect of ionic forms of Zn, Mg, F, Cl, Ca, etc., on the ionic equilibria of the soil solution, given that such ionic forms are found in P-fertilizers, ag-lime and such agrochemi-cals. (iii) Competitive effects on clay adsorption sites, humic acid moieties, and in the rizosphere, (iv) Ionicity effects on organic matter and other effects that we have not discussed in this study.
In the case of fluoride, Loganathan et al (2008) had rightly pointed out that additions from fertilizer inputs to soil can be more significant than for Cd, and called for its monitoring since fluoride occurs in g/kg (and not in µg/kg, as with Cadmium). However, as shown in Table-II, while Loganathan et al concluded that ambient soil-fluoride amounts will be doubled within a mere 65 years, we show using more realistic calculations based on more typical agricultural usage patterns, that it will take some 8-9 centuries for that to happen, even after neglecting any leaching away by rainfall. Hence there is absolutely no cause for alarm.
We have also pointed out that the neglect of ion syn-ergies (e.g., Zn in suppressing Cd toxicity), in specifying tolerable maximum weekly intake values can lead to para-doxical situations where healthy communities have been found to be consuming diets that would appear to be dangerous to health if judged according to the CODEX alimentarius stipulations. In contrast, the synergy of Mg (found as a component of hard water) with fluoride or Cd in showing enhanced nephrotoxicity is also not yet alluded to in regulatory stipulations.
Furthermore, we conclude that attempting to control the enhancement of bio-available cadmium in soils caused by P-fertilizer loading may require controlling their fluo-ride, magnesium, and zinc content rather than the cad-mium content. In addition, if these considerations are correct, then the push by the European Food Safety Agency (as well as similar organizations in other coun-tries), to reduce the cadmium content in crops by contin-ued lowering of the allowed cadmium levels in P-fertilizers would turn out to be an expensive and futile exercise.
Acknowledgement – The author thanks Dr. Sarath
Amarasiri for reading and commenting on a version of this manuscript.
[1] H. A. Schroder and J. J. Balassa, “Cadmium: uptake by vegetables from superphosphate in soil,” Science 140 no. 3568, (1963) 819–120.
[2] M. J. McLaughlin and B. R. Singh, cadmium in Soils and Plants. Kluwer Academic Publishers, Dordect, Holland,
1999.
[3] P. Loganathan, M. J. Headly, and N. D. Grace, “Pasture soils contaminated with fertilizer-derived cadmium and fluorine,” Rev. Environ. Contam. Toxicol. 129 (2008) 29– 66.