HAL Id: hal-01336655
https://hal.inria.fr/hal-01336655
Submitted on 23 Jun 2016
HAL is a multi-disciplinary open access archive for the deposit and dissemination of sci-entific research documents, whether they are pub-lished or not. The documents may come from teaching and research institutions in France or abroad, or from public or private research centers.
L’archive ouverte pluridisciplinaire HAL, est destinée au dépôt et à la diffusion de documents scientifiques de niveau recherche, publiés ou non, émanant des établissements d’enseignement et de recherche français ou étrangers, des laboratoires publics ou privés.
Distributed under a Creative Commons Attribution - NonCommercial - NoDerivatives| 4.0
InfraPhenoGrid: A scientific workflow infrastructure for
Plant Phenomics on the Grid
Christophe Pradal, Simon Artzet, Jerome Chopard, Dimitri Dupuis, Christian
Fournier, Michael Mielewczik, Vincent Negre, Pascal Neveu, Didier Parigot,
Patrick Valduriez, et al.
To cite this version:
Christophe Pradal, Simon Artzet, Jerome Chopard, Dimitri Dupuis, Christian Fournier, et al.. In-fraPhenoGrid: A scientific workflow infrastructure for Plant Phenomics on the Grid. Future Genera-tion Computer Systems, Elsevier, 2017, 67, pp.341-353. �10.1016/j.future.2016.06.002�. �hal-01336655�
InfraPhenoGrid: A scientific workflow infrastructure for
Plant Phenomics on the Grid
Christophe Pradala,b, Simon Artzetc, Jerome Chopardd, Dimitri Dupuise, Christian Fournierc,b, Michael Mielewczikc,f, Vincent Negrec, Pascal Neveud,
Didier Parigote, Patrick Valdurieze, Sarah Cohen-Boulakiab,e,g
aCIRAD, UMR AGAP, Montpellier, France bInria, VirtualPlants, Montpellier, France cINRA, UMR459, LEPSE, F-34060 Montpellier, France dINRA, UMR729, MISTEA, F-34060 Montpellier, France
eInria, Zenith, Montpellier, France fICCH, NHLI, Imperial College London, UK
gLaboratoire de Recherche en Informatique, Universit´e Paris-Sud, CNRS UMR 8623, Universit´e Paris-Saclay, Orsay, France
Abstract
Plant phenotyping consists in the observation of physical and biochemical traits of plant genotypes in response to environmental conditions. Chal-lenges, in particular in context of climate change and food security, are nu-merous. High-throughput platforms have been introduced to observe the dynamic growth of a large number of plants in different environmental con-ditions. Instead of considering a few genotypes at a time (as it is the case when phenomic traits are measured manually), such platforms make it pos-sible to use completely new kinds of approaches. However, the data sets produced by such widely instrumented platforms are huge, constantly aug-menting and produced by increasingly complex experiments, reaching a point where distributed computation is mandatory to extract knowledge from data. In this paper, we introduce InfraPhenoGrid, the infrastructure we de-signed and deploy to efficiently manage data sets produced by the PhenoArch plant phenomics platform in the context of the French Phenome Project. Our solution consists in deploying scientific workflows on a Grid using a middle-ware to pilot workflow executions. Our approach is user-friendly in the sense that despite the intrinsic complexity of the infrastructure, running scientific workflows and understanding results obtained (using provenance informa-tion) is kept as simple as possible for end-users.
Keywords: Phenomics, Scientific Workflows, Provenance, Grid computing
1. Introduction
Biological research derives its findings from the proper analysis of experi-ments. However, over the last three decades, both throughput of experiments (from single observations to terabytes of sequences of images produced dur-ing a sdur-ingle day) and the breadth of questions studied (from sdur-ingle molecules to entire genomes) have increased tremendously. One of the main challenges remains to efficiently analyze, simulate and model such big data sets while keeping scientist users in the loop.
In this paper we introduce InfraPhenoGrid, the infrastructure we designed and deployed to efficiently manage and analyze data sets produced by the PhenoArch plant phenomics platform. In this context, one difficulty remains to enable users to analyze, simulate and model increasingly huge data sets on a more frequent base. More precisely, the design of InfraPhenoGrid is driven by three needs, described here-after.
First, management of large-scale experiments involving possibly large numbers of interlinked tools has to be supported. Users should be able to analyze and simulate complex structural-functional relationships of plant architectures, integrating multi-disciplinary models developed by different teams. Experiments should be easy to design by users and it is important that over time they can be changed, adapted to new needs (new analysis algorithms are constantly available), and then shared. As a result, the first brick of our infrastructure is a Scientific Workflow System.
Second, each experiment can be replayed several times, varying data sets and/or parameter settings. Keeping track of the exact data sets and param-eter settings used to produce a given result (provenance) is of paramount importance for scientists to ensure the results reproducibility and allow to properly interpret and understand them. The possibility of comparing re-sults, obtained on several experiments when varying data sets and/or param-eter settings are used, is another need directly associated with provenance. Consequently, the second brick of our infrastructure is a Provenance Layer.
Last but not least, our infrastructure has to efficiently deal with the anal-ysis of huge data sets, possibly acquired on multiple sites. Analanal-ysis may in-volve combining data produced by platforms with completely different kinds of data, including data obtained from public data sources. Data acquisition
is fast compared to the time needed to analyze them. The size of data sets has reached a turning point at which local infrastructures are no longer suffi-cient to provide adequate computational power and storage facilities. Hence, distributed computation has become a major requirement. However, deploy-ing jobs on a parallel environment might be complex for end users. Therefore the third brick of our infrastructure introduces a Middleware able to pilot the execution of jobs on parallel (Grid) environments.
This paper is organized as follows: Section 2 introduces the precise con-text of this work, that is, the Phenome Project, PhenoArch platform and one use case of interest. Section 3 describes in detail the architecture of In-fraPhenoGrid. Section 4 demonstrates the benefit of using our solution for managing plant phenomic data sets. Section 5 provides related work while Section 6 concludes the paper and draws perspectives.
2. Use Case
2.1. The Phenome project and the PhenoArch platform
Selecting genotypes that maintain and increase crop performance is a par-ticularly challenging and important topic in the context of societal challenges such as climate change adaptation, food security and preserving natural re-sources.
A large variety of tasks have to be performed to collect information on plant traits (called phenotyping), including measuring the size of the leaves, counting the number of tails... Performing such tasks manually makes it impossible to consider more than a few plants at a time and it thus cruelly confines the kind of analyses that can be conducted.
In the meantime, massive plant phenotyping in the field, that is, the evaluation of crop performance (yield) of millions of plants in a large range of environmental and climatic scenarios, has been very efficient for driving plant breeding. However plant breeding is now facing a stagnation of genetic progress in several species. New strategies, such as genomic selection, are now evolving to directly link the allelic composition of a genome, available at much higher throughput and lower cost than field phenotyping, to crop performance. The existence of large marker-environment interactions, i.e. the fact that a given combination of markers has very different genetic val-ues depending on the climatic scenario, lead concomitantly to a revolution in phenotyping strategies. Such strategies aim to capture under controlled conditions, the genetic variability of plant responses to environmental factors
for thousands of plants (reference panels), hence identifying more heritable traits for genomic selection.
This first implies the necessity to automate quantification of a large num-ber of traits, to characterize plant growth, plant development and plant func-tioning. Second, it requires a tight control or at least accurate measurement of environmental conditions as sensed by plants. It finally requires fluent and versatile interactions between data and continuously evolving plant response models. Such interactions are essential to be considered in the analysis of a given marker environment interaction and in the integration of processes to predict genetic values of allelic combinations in different environment sce-narios.
High-throughput phenotyping platforms have thus been designed to allow growing and observing traits of a large number of plants. These platforms provide many measurements and imaging functionalities for different plant species grown in various environmental conditions. They potentially allow to assess the genetic variability of plant responses to environmental conditions using novel genetic approaches requiring a large number of genotypes.
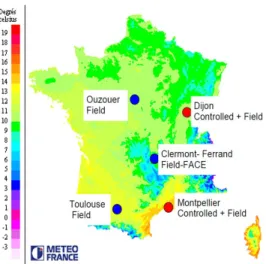
Nine of such platforms, distributed over various regions of France, are gathered in the Phenome project (Figure 1). More precisely, Phenome con-sists of two controlled condition platforms (greenhouses with automated ir-rigation, CO2 control and temperature control) for 1900 plants, two field
platforms (800 plots) equipped with environment control (CO2 enrichment,
automated rain shelters) and three larger field platforms (2000 plots) that use natural gradients of water availability or soil contents. All these platforms are equipped with environmental sensors and permit automated imaging of plants in one or multiple wavelengths (thus allowing functional analysis) using robots to convey plants (for green houses) or to carry instruments to automatically acquire data in the field (Phenomobile, drones). Finally two supporting omic platforms enable us to centralize and optimize high throughput metabolomic and structural measurements associated with the experiments.
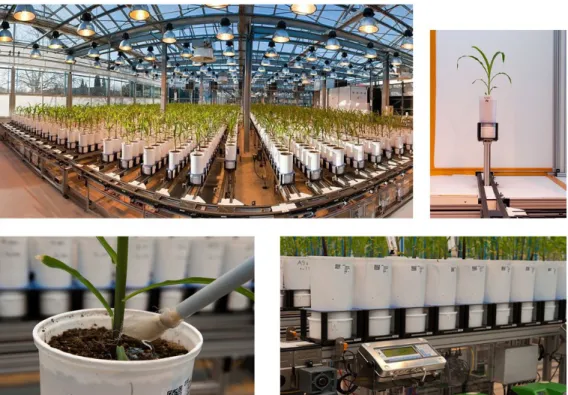
The work depicted in this paper is related to the PhenoArch platform1,
in the south of France (Montpellier). As depicted in Figure 2, PhenoArch is composed of a conveyor belt storage structure of 28 lanes carrying 60 carts each (i.e. total of 1680 pots), and a conveyor belt system that feeds
Figure 1: Location of Phenome platforms, superimposed on a map of mean temperature in France. Phenome platforms are representative of the variability of temperature. They also represent different risks of water deficit.
either the imaging or the watering units. The imaging unit consists of a 3-D image acquisition cabin with top and side channel. Five water units consist of five weighing terminals and five high-precision watering pump-stations, as shown in Figure 2. PhenoArch measures traits associated to the plants’ adaptation to climate change with a throughput of 1650 plants per day. Typical measured variables include the timing of the plant cycle (leaf appearance, duration of phenological phases), plant growth rate in terms of area and volume, plant organ expansion and plant morphology (angles, shape of leaves). The automated irrigation system allows to control various water supply scenarios and estimates the responses of these traits to water availability. Plants are imaged every day from 12 lateral and one apical view (20000 images per day are produced), which allow reconstructing a digital ’avatar’ of each plant of the platform.
Three main categories of workflows have to be executed: The first se-ries of workflows is related to data acquisition in order to collect, describe, and organize data sets while being acquired. The second category consists in gathering, standardizing, and making available produced data sets. The third category aims at finding answers to research questions: analyzing results ob-tained and combining such data with other data sets to extract knowledge. Workflows then need to combine highly heterogeneous data, from very
dif-Figure 2: Phenoarch Phenotyping Platform
ferent sources such as manual samplings, readings, and human observations at different scales (populations, plants, organs, tissues, cells, etc.) and at different times and stages. Such data can be either comparative (mutant versus wild type), absolute (days to flowering of a cultivar) or relative (rel-ative growth per day). Extensive connections to large sets of data types are also mandatory (seed stocks, genes, experimental methods, publications, etc.) leading to major data integration research questions [1] and calling for a new generation of analysis tools.
2.2. Image analysis workflow
As an example, we describe one of the elementary workflows, that mostly consists of an image analysis step targeting the estimation of plant leaf area. Most of the raw data (images) are indeed not used directly, but processed with an image analysis pipeline to get a trait, and then further analyzed with a response model. Analyzing images is part of the important steps of the experiments to be performed. It is shared between many workflows and used
to produce the traits measurements.
A very large variety of algorithms may be used to extract relevant infor-mation from image analysis. Dedicated plant phenotype commercial packages use basic functions to estimate total biovolume and leaf area for example. However current research provides a new landscape of algorithms. They make the link with ecophysiological models and allow to perform a more precise analysis of plant traits. In this context, it is particularly important to allow users to test and compare algorithms on their data sets.
Despite its simplicity, this use case already illustrates one important char-acteristics of phenotyping analysis, that is the intrinsic dependency between data and models. Consecutively such workflows can then be completed by other workflows that couple data analysis with a model for analyzing the response of plant expansion rate to temperature and water availability or with an integrative model, in a simulation context. Furthermore, such a kind of in-silico experiment can be considered in much wider contexts. For instance, after an initial segmentation of organs in the image, the global ar-chitecture of the plant can be reconstructed. This 3D reconstruction can be interfaced with canopy-level models of light interception to gain access to physiological parameters like intercepted light and radiation use efficiency for example. Hence both geometrical parameters attached to a plant (e.g., leaf surface area) and physiological parameters (e.g., photosynthesis) can be tracked throughout time and correlated with genotypes.
All these steps are particularly challenging and involve multi-disciplinary teams (biology, statistics, geometry, bioinformatics, computer science...).
2.3. User Requirements
In the introduction we have presented the three main high-level require-ments we followed to design InfraPhenoGrid: i) the ability for users to design and exchange experiments where a very large number of tools are interlinked (handled by a workflow management system), ii) the ability for users to re-produce experiments and understand the result obtained by such experiments (handled by a provenance layer), and iii) the ability to deal with large-scale experiments involving masses of data (handled by parallel computing envi-ronments). In this subsection we provide precision on the PhenoArch users’ requirements.
A Transparent, Familiar and Flexible Working Environment: The classical users of the PhenoArch platform are bioinformaticians, mainly Python programmers (strongly involved in the design of Jupyter/IPython notebooks
[2, 3]), statisicians, image analysts and more generally modelers, all closely connected to the Plant community. They are already very familiar with the OpenAlea workflow system and in particular they are frequent users of some analysis tools and libraries provided by OpenAlea. InfraPhenoGrid should thus be designed to be as transparent as possible for users, that is, to allow them continuing working in the same environment. However, we want our infrastructure to be flexible to use other workflow systems and/or libraries both for our current users to discover them and to welcome next generation users.
An Adaptable Operational Infrastructure: Faced with the amount of data to be analyzed, the computing infrastructure of InfraPhenoGrid has to be designed in an operational distributed infrastructure, already used in similar projects. While a National (European) and Open infrastructure has to be favored in a first time, InfraPhenoGrid should be adaptable to both Grid and Cloud solutions.
Reproducibility-Friendly Infrastructure: InfraPhenoGrid is a workflow infrastructure for plant scientists to analyze their datasets and understand them. Tracking data used and produced (Provenance) as well as the exact description and environments where the tools have been executed is a crucial need and should be done following international standards of the domain. InfraPhenoGrid should thus be Reproducibility-Friendly, welcoming to any plugins to export, visualize and analyze Provenance information and more generally any tool to enhance reproducibility of experiments.
3. InfraPhenoGrid Architecture
The InfraPhenoGrid we designed to manage and analyze plant phenotyp-ing data sets is an infrastructure based on a number of layers of abstractions. First, computational methods for analysis and simulation are expressed by means of scientific workflows (in the OpenAlea workflow system). Second, a middleware (SciFloware) maps, manages and optimizes the execution of scientific workflows on distributed environments. Third, a provenance layer captures the workflow execution and reports it to users to further understand and explore results of the computation. Last, a large scale infrastructure, the Grid (France-Grilles) allows to have access to a shared, extensible and very large computational power and storage.
France-Grilles makes use of two other important components, namely, DIRAC and iRODS. DIRAC (Distributed Infrastructure with Remote Agent
Control) [4] is a framework for distributed computing particularly well-suited to deal with large communities of users. iRODS (integrated Rule-Oriented Data System) [5] is a scalable open-source data management software used by research organizations and government agencies worldwide. The focus of iRODS is data. It provides data discovery using a metadata catalog that describes every file, directory, and storage resource in the data grid. iRODS is also in charge of implementing data virtualization. (iRODS will be described in more details in Section 3.3.)
More precisely, the architecture of InfraPhenoGrid is depicted in Figure 3. Circled numbers are related to steps described here-after.
Figure 3: InfraPhenoGrid Architecture
The user interacts with InfraPhenoGrid in a visual programming envi-ronment (step 1) by designing a workflow specification from scratch or by selecting an existing workflow in the library of available workflows. To run the workflow, the user has to select the data sets to be taken as input by the workflow at execution time. The distributed infrastructure is thus transpar-ent for the end-user.
Selecting a dataset in InfraPhenoGrid actually corresponds to sending a request to iRODS to concretely get the data (step 2). Resources have then to be allocated; this is performed by DIRAC (step 3). On each allocated worker
or job, OpenAlea workflows are deployed by copying an image from iRODS so that an OpenAlea server is launched (step 4). OpenAlea servers then register to SciFloware (step 5) which is in charge to distribute computations of possible subparts of the workflow to the different OpenAlea servers (step 6). The workflow is then concretely executed on the Grid (step 7). At this stage, provenance information and all information on jobs are stored and available on iRODS.
The next subsections present with more details and discuss the choices we made on the major components of InfraPhenoGrid, namely, the OpenAlea workflow system, the SciFloware middleware and the data management and provenance layer.
3.1. Scientific Workflow Management system: OpenAlea
OpenAlea - A system targeted to the plant community. The OpenAlea sci-entific workflow system is a component-based architecture implemented as a set of pure Python packages [6]. The visual programming environment and graphical user interface (GUI) is implemented using the PyQt toolkit, a Python binding to the Qt application framework. OpenAlea is portable and available on Linux, Windows, and MacOS/X.
OpenAlea has been in constant use since 2004 by users of the French Plant science community but not only since the system has been downloaded 618000 times and the web site counts international 10000 unique visitors a month according to the OpenAlea web repository (https://gforge.inria.fr). OpenAlea is distributed under a free software license (L-GPL) and main-tained and developed by a group of 20 active developers from different re-search institutes and universities. Development is performed under a collabo-rative scheme with shared methodologies (best practices). Coding sprints are regularly organized by various sub-groups of developers (pair programming and test driven development) and scientists (biologists and mathematicians). OpenAlea tools (e.g., models, workflows, components) are published and shared on the web both through the main OpenAlea web repository and through web sites of groups which use and contribute to OpenAlea without being concretely partners of the OpenAlea project2.
As a consequence, more than 60 researchers have contributed to Ope-nAlea packages, in France and internationally, published through large
meta-2See for example the following web sites: http://www.stse-software.org and https://www.cpib.ac.uk/research/themes/digital-plant
packages (e.g., Alinea to simulate ecophysiological and agronomical processes and VPlants to analyze, model and simulate plant architecture and its de-velopment) to ease the installation for end-users.
The strong and long-term experience of PhenoArch users and their inter-national collaborators with both using and developing workflows in OpenAlea made us choose OpenAlea as the workflow system for InfraPhenoGrid. The main technical features of OpenAlea are described here after.
Using OpenAlea (Designing workflows). From an end-user point-of-view, the first feature of OpenAlea exploited is its visual programming environment (part A of Figure 4) where users are provided with a set of predefined work-flows and libraries of tools (part B of Figure 4) to be combined to form new workflows.
Users can create new wrapped tools by implementing them in Python (in part C of Figure 4). Each tool and workflow is associated with some documentation and saved. Ports of actors are typed and widgets can be associated with data types to allow users interaction with the data.
Figure 4: Main graphical user interface of OpenAlea. Users can design and interact with workflows in A. The package manager is in part B and provides users with the structured list of tools available and the list of existing workflows. On part C is the Python interpreter, where OpenAlea actors can be designed. Dotted lines denotes widgets.
Workflow specification. From a more formal point-of-view, in OpenAlea, a workflow is classically represented as a directed multi-graph. Each node is called an actor and represents a task to be executed (a.k.a. component or activity). Each node has a name, a function object (a functor, a program, a Web Service or a composite actor), and an explicitly defined set of input and output ports. Directed edges are data links which connect output to input ports.
While OpenAlea can be classically used to perform data analysis as in other workflow systems such as Galaxy [7], Taverna [8] or Kepler [9], its orig-inality lies in its ability to handle loops expressing retro-action [10]. In other words, OpenAlea is able to deal with simulation and modeling. Iteration is handled by introducing a specific kind of actor, called dataflow variable X. It allows to specify that, at a given port, an actor receives an unbound variable rather than a value. Connecting an X to an actor transforms a workflow into a lambda function. It allows to express higher-order programming providing control flow behavior using a set of algebraic operators. An algebraic opera-tor is an acopera-tor that iterates over first-order function calls, and thus takes one or more functions as inputs. Ports that require a function have an associated semantic type Function.
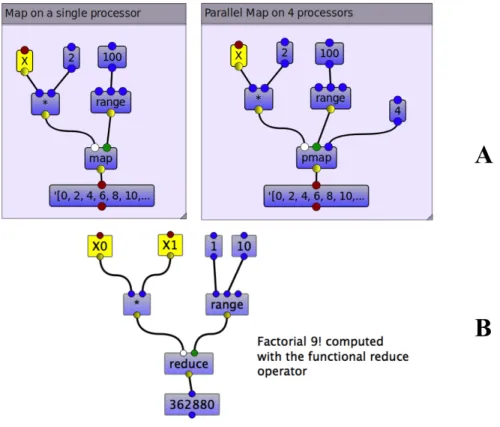
More precisely, the map operator is a higher-order function map :: (α → β) → [α] → [β]. Its argument are a function f :: α → β (first port) and a set of elements of type α (second input port). The map operator applies f to each element of the set and returns the set of resulting elements of type β. In Part A of Figure 5, two implementations of the map operator are provided. The left workflow illustrates the map operator running on one single processor while the one on the right hand side illustrates the parallel map operator with the same workflow running on 4 processors.
Similarly, the reduce operator takes a function g of two variables and a sequence of elements [xi] and returns one element. while is an iteration
operator that takes three inputs: an initial element t0, a boolean function
cond and function h. It initializes a variable t with t0 and iteratively applies
the function h on t while cond(t) is true.
Workflow execution. The execution of a given workflow in OpenAlea is launched in response to requests for data of one of its actors. Such an actor can sat-isfy the request when the upstream sub-workflow has been executed, that is, when all the relevant actors connected to its input ports have been executed. When such an actor has received its data on its input ports, it executes and
Figure 5: Algebraic operators map (A left), parallel map (A right), and reduce (B)
places data on its output ports.
OpenAlea has introduced λ-dataflow evaluation [10] which differs from the classical evaluation if the workflow contains at least one dataflow variable X. The execution is then decomposed into two stages. First, for each port of type Function, a sub-workflow is computed if the upstream sub-workflow contains at least one dataflow variable. This sub-workflow is defined by all the actors needed to produce the data on this port, i.e. the upstream sub-workflow and the connected output port. This sub-workflow is dynamically transformed into a function (i.e. an actor) of one or several variables corresponding to its dataflow variables. Second, the evaluation of this function by algebraic operators consists in replacing the variables by real data and evaluating the sub-workflow.
Additionally, OpenAlea provides several optimizations in the orchestra-tion of the workflow execuorchestra-tion by allowing actors to be blocked and lazy. If
an actor is blocked, the execution is not propagated to the upstream sub-workflow and if the actor is lazy, the execution is performed only if the actor’s inputs have not changed compared to its previous execution. This type of orchestration performs only the operations needed to produce the required result, executing the subset of the graph relevant to the output [11].
3.2. A middleware for parallel environments: SciFloware
The choice of SciFloware. As stated in the user requirements, InfraPhenoGrid should be equipped with a system able to (i) hide the complexity of the com-putation and offer transparent access to data and tools for end-users, (ii) provide a flexible working environment by allowing several workflow systems to be used, (iii) be adaptable to pilot tasks both on Grid and Cloud infras-tructures. Using and tuning such kind of systems remains a very difficult task.
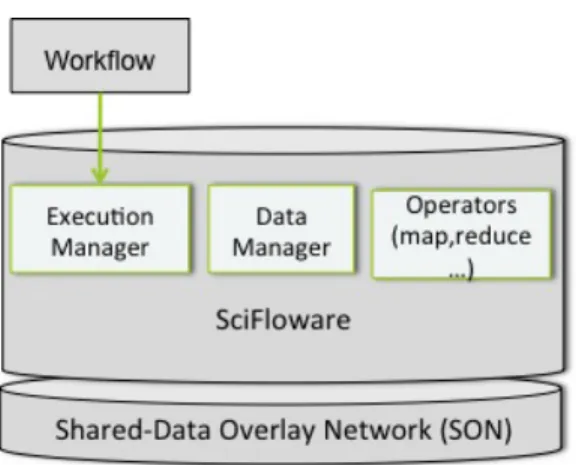
Our research groups have recently developed SciFloware, a generic lightweight middleware able to coordinate and pilot the tasks to be executed in a trans-parent way for the user. SciFloware is based on the Shared-data Overlay Network [12] (SON) which follows a Software as a Service (SaaS) model, eliminating the need to install and maintain the software and allows users to run HPC programs through graphical interfaces (e.g., graphical interfaces of scientific workflow management systems).
SciFloware has been chosen to be the InfraPhenoGrid middleware, be-cause it was a system we are familiar with and it matched our demands on requirements. The technical features of SciFloware are described here after. Internal representation of workflows in SciFloware. SciFloware has been de-signed to allow interoperability of different workflow systems. In absence of standards to represent scientific workflows3, SciFloware defines its own XML
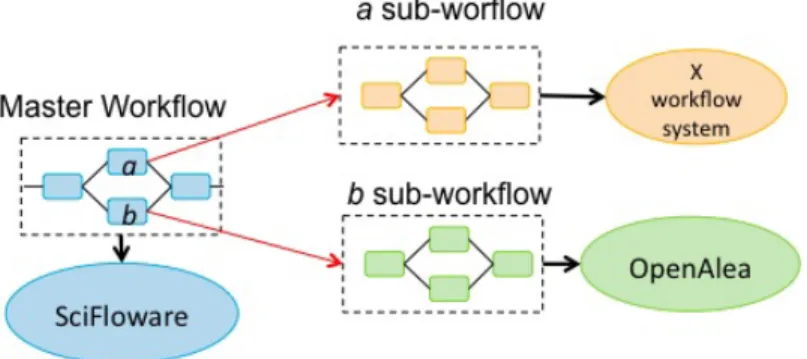
workflow specification to describe a master workflow. A master workflow is a meta-level workflow used to orchestrate and compose concrete workflows. Each workflow is run independently by different scientific workflow systems. As an example, in Figure 6, the SciFloware master workflow consists of four steps, including steps a and b (sub-workflows of the master workflow) which are respectively executed by the X workflow system (for the a sub-workflow ) and the OpenAlea workflow system (for the b sub-workflow ). More precisely,
3The Common Workflow Language (CWL) Intiative may become a solution in the future but it has not reached the right level of maturity yet.
SciFloware is responsible for (i) sending to workflow systems the execution of such two master sub-workflows with the right input data produced by the previous executed master workflow step, (ii) collecting output data gener-ated at the end of each execution of the sub-workflows, and (iii) launching the execution of the last step of the master workflow with such collected data.
While OpenAlea has been the first workflow system orchestrated by Sci-Floware (based on our user requirements), Galaxy [7] and Taverna [8] are currently under consideration (to play the role as ”X workflow system” in Figure 6).
Figure 6: SciFloware distributed middleware.
Algebraic expressions in SciFloware. SciFloware uses a relational data model and an algebraic language to represent data-intensive scientific workflows [13]. Data flows are represented as relations and workflow nodes and activities as algebraic expressions. A relation is a set of tuples composed of basic attributes (e.g., int, float, string, file references).
An algebraic expression consists of algebraic activities, additional operands, operators, input relations and output relations. It is comprised of a workflow, a program or an SQL expression, with input and output relation schemes.
More precisely, SciFloware provides six algebraic operators: Map, SplitMap, Reduce, Filter, SRQuery and MRQuery. The semantics of these operators has been defined in [13].
Software as a Service, communication with workflow systems. As previously stated, SciFloware is particularly modular, following the SAAS (”Software
as a Service”) principle. SciFloware is a service-and-component-based dis-tributed architecture and built from software components. Each compo-nent provides services to other compocompo-nents of the workflow. A service is a self-contained unit of functionality which exposes components through well-defined interfaces. SciFloware provides services that can be combined to build large distributed applications. In InfraPhenoGrid, SciFloware runs on a ded-icated server and provides a registration service, where distributed workers can register themselves. Using a communication protocol, SciFloware dis-tributes the computation among workers, with each worker running behind a dedicated server. The tech stack (e.g., authentification) is implemented using services and can easily be evolved further.
More precisely, three main kinds of services are considered in SciFloware: algebraic operators, scientific workflow systems and the communication pro-tocol between algebraic operators and workflow systems.
SciFloware schedules the computation using algebraic operators. Services associated with these are managed by the SciFloware server. Each compo-nent has its own decentralized execution strategy, which allows to simply distribute the execution on several sites. A component type is associated with each algebraic operator. For example, the Map operator has an associ-ated map type of component, with an input and output service for relations and a service to schedule activity among workers.
As for workflow systems, each worker runs a service, running a workflow within a given workflow system. It receives a workflow description and input data IDs and returns the produced output data. On a Grid infrastructure, workers will run on different nodes, each one executing its own server to communicate with SciFloware.
Eventually, a set of services have been defined to manage communication between SciFloware and different workflow systems. Using these, SciFloware can request the execution of a workflow on any workflow system server, or be notified at the end of the execution of an OpenAlea workflow. Other services manage database relationships and communication protocols.
Figure 7 illustrates a case where a component manages local task execu-tions depending on a given algebraic operator. More precisely, in Figure 7, the Map component distributes the computation among workers (OA servers, that is, OpenAlea servers) depending on its own scheduling policy.
SciFloware allows new components to be added and instantiated dynam-ically to extend the middleware.
Figure 7: Distributed execution of a scientific workflow on the Grid with SciFloware.
SciFloware Architecture. The SciFloware architecture is composed of the fol-lowing components (see Figure 8):
• Algebraic Operators. For each algebraic operator, a specific compo-nent type is associated, which can be instantiated several times during the execution of a given workflow.
• Execution Manager. The Execution Manager takes in a workflow specification and instantiates the needed components (i.e. workflows or part-of workflows), such as the algebraic components. A message is sent to trigger execution of the first workflow component. The Execu-tion Manager also manages and runs the available OpenAlea servers. At each registration of an instance of an OpenAlea server, a worker component is added to the list of available workers.
• Data Manager. The Data Manager provides workers with access to the storage database.
Implementation of SciFloware. The implementation of SciFloware is based on the Shared-data Overlay Network (SON) [12], written in JAVA, fully integrated into the Eclipse environment and implemented on top of OSGi4.
4The OSGi specification describes a modular system and a service platform for the Java programming language that implements a complete and dynamic component model.
Figure 8: SciFloware architecture.
The communication protocol between SciFloware and scientific workflow systems being run on different workers use a REST (Representational State Transfer) interface. The RESTfull communication protocol is used to regis-ter new workers, exchange the workflow specification and the data identifiers stored on iRODS and start and stop the execution. Each service in Sci-Floware is described using description files similar to the Web Service Def-inition Language (WSDL). Each SciFloware component has an associated description file defining the required and provided services.
SON is used for the internal composition of SciFloware components. SON allows to build an application following the SAAS model (Software as a Ser-vice) using a set of components that can be executed in a distributed way (e.g., Peer-to-Peer) on a Grid or on a Cloud infrastructure. The SON middle-ware allows to define new component types by specifying the services offered by each type. During execution it allows to dynamically combine different component instances and to manage the life cycle of these components (cre-ate, init, stop,...).
Concerning the authorization framework, SciFloware uses OAuth2 [14] to enable safe registration of the OpenAlea servers to SciFloware. The OAuth2 flow used is the Resource Owner Password Credentials Grant flow5. During
the deployment of the OpenAlea server, the user provides its SciFloware’s username and password. At startup, each OpenAlea server requests an access
token from SciFloware using login authentication. After registration, all the communication between SciFloware and OpenAlea is mediated through iRODS, whose access requires authentication based on certificates delivered by the French Grid Certification Authority.
As for the Data Manager component, it has been extended to support iRODS. The connection with iRODS is established using the REST interface. iRODS is the focus of the next subsection.
Packaging OpenAlea into a virtual environment. OpenAlea and all its de-pendencies have been built and packaged into a virtual environment [15] on a virtual machine. The operating system (i.e., a scientific Linux version 6) of the virtual machine is the same as the one deployed on each worker of the Grid. The virtual environment is packed and stored on iRODS. When a worker is reserved by DIRAC, the bundle is uploaded locally and uncom-pressed. A shell script updates the environment variables and an OpenAlea server is launched. This method has been preferred to virtualization (e.g., vagrant or docker [16]) for performance reasons and because all the workers have the same operating system. The size of the compressed bundle con-taining all the packages and their dependencies is 210 MB. The latency (or delay) due to the copy of the bundle from iRODS and its installation is less than 1 min, while each worker is deployed once for a maximum of 24 hours.
3.3. Data management and Provenance
Data management with iRODS. As previously stated, iRODS (v3.3) is an open-source data system chosen by France-Grilles for its ability to provide a technology enabling data and policy virtualization for multiple and geograph-ically separated users [17]. iRODS federates distributed and heterogeneous data resources into a single logical file system and provides a modular in-terface to integrate new client-side applications. iRODS does not only allow the worker nodes of the grid infrastructure to access data sets but it provides end-users with access to data, through GUI, while enabling user to annotate such datasets with rich metadata.
Both input data and the results of a scientific workflow computation as-sociated with their provenance are stored on iRODS. This drastically reduces the volume of data to be transferred through SciFloware to launch a compu-tation and retrieve its result (only the address of data in the central catalog has to be exchanged). We also implemented a communication protocol by file to bypass the limitations enforced by the Grid on network communications.
Provenance Layer. One of the major aims of our infrastructure is to be reproducibility-friendly [18]. The starting point to make a scientific result reproducible is to keep track of the exact data sets and exact tools (includ-ing parameter sett(includ-ings) used to obtain a given data item. To answer such needs a Provenance Layer has been designed and implemented in our infras-tructure. A layer currently has two main components: a provenance model, based on the W3C standard PROV [19] and a notebook generator, able to automatically generate notebooks from some workflow executions. The Provenance layer is flexible in the sense that new modules taking in PROV data and making it possible to visualize and analyze provenance information can be integrated.
While iRODS is in charge of concretely managing data, the provenance module reconstructs (by querying iRODS) the history of each data item. In other words, the provenance module is able to provide for each produced data item the exact series of workflow node executions, including the data sets used as input of such nodes. Such provenance information is represented according to the W3C PROV standard [19]. Both prospective (the workflow specification) and retrospective (execution and data sets) provenance are stored.
Notebooks generator. The second component of the provenance layer aims at helping the PhenoArch users understand the results they obtained by allowing them to visualize and interact with the main steps of the process used to produce such results. In other words, we want PhenoArch users to be able to interact and visualize (part of) the execution of some workflows to follow how some final results have been obtained.
The current solution used by an increasing number of scientists to answer such kinds of need is to (manually) design notebooks using the Jupyter/IPython Notebook web application [2]. From a developer point-of-view, a notebook is a JSON document (convertible into a number of open standard output formats including HTML, LaTeX, PDF ... and which can be designed using a web-base user interface) containing an ordered list of input/output cells with iPython code able to generate text, mathematics, plots and rich media (images, video...). From an end-user point-of-view, a notebook is a rich web page, where code, text, mathematics, plots and multimedia (images, video...) can be displayed and interacted with. In particular any user can modify the input of a notebook cell to observe the impact of this change on the objects displayed (e.g., plots).
In InfraPhenoGrid, we implement a notebook generator where a set of OpenAlea workflow executions are automatically converted into Jupyter/ IPython notebooks. More precisely, the generator (i) converts each Ope-nAlea workflow actor (natively coded in Python) into an IPython cell and (ii) queries iRODS to extract automatically information on input and output datasets respectively used and produced by the execution of each OpenAlea actor. Users can then visualize and interact with data used and produced during an execution. A concrete example of generated notebooks is provided in the next Section (Results).
4. Results
In this section, we present the benefits of using InfraPhenoGrid in Plant Phenotyping by showing how the various components of our infrastructure make it possible to perform complex experiments on huge data sets.
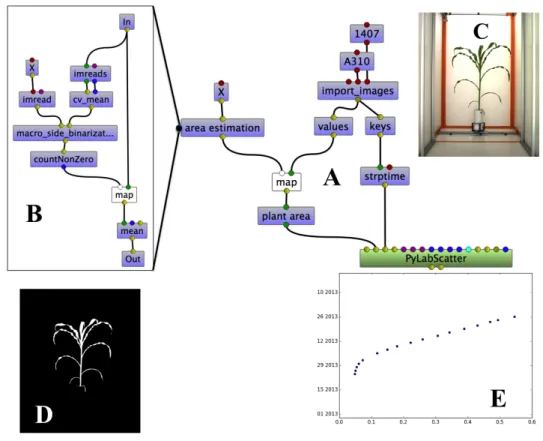
Designing workflow. Figure 9 provides an example of a workflow designed and executed by our end-users to estimate the growth of a plant. Such a workflow starts with querying iRODS to get input data (”import image” node). In this concrete example, the 1407th individual plant of genotype A310 has been considered. As a consequence, ”1407” and ”A310” appears in the name of the actors of the workflow. The import image node returns a time series of images. Each acquisition, taken every two days, records pictures of the plant at various angles by rotating the plant. The node keys returns the order sets of the dates, while values returns a list of images corresponding to the different side views of the growing plant, along time. The map node applies the sub-workflow illustrated on Part B of Figure 9 on each set of images of the time series. The result is a list of estimated areas of the individual plant over time.
The X node represents a dataflow variable and abstracts the sub-workflow (part B) as a function. The sub-workflow B implements a mean-shift algo-rithm. It receives the multiple views of the plant at a given time. All these views are combined (node cv mean) using an OpenCV algorithm to separate the plant from the cabin background in the image. The macro side binarization node subtracts the cabin background of each image and the ”green” pixels are counted (countNonZero). Again, the map algebraic operator is used to run the same treatment on a set of images. Note that the mean shift algorithm is only computed once due to lazy evaluation. The binary image (Part D)
Figure 9: Workflow. Part A represents the main workflow while Part B is a sub-workflow corresponding to the node ”area estimation” of workflow A. Part C depicts one of the set of real images of a plant of a given genotype obtained from the imaging system of the phenoarch platform. D represents the binary image. E plots the growth of the plant.
is produced by one execution of the macro side binarization for each lateral perspective image using an optimized HSV segmentation algorithm.
Finally, the plant area node receives as input a number of ”green pixels” for each plant and estimates, using a linear model, the plant area along its growth and development. The PyLabScatter node plots the graph of the growth of the plant (Part E) using the MatplotLib library [20] wrapped within OpenAlea.
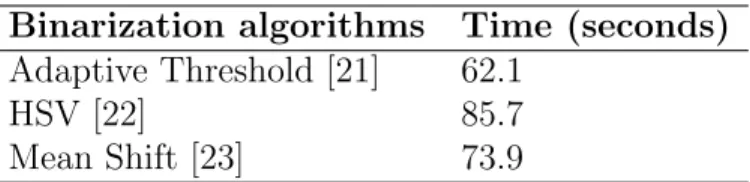
Exploring alternative methods. OpenAlea is modular and allows users to eas-ily test various alternative methods. In particular, several variations of sub-workflow B can be designed, resulting in the use of several Binarization al-gorithms (as mentioned in Table 1). The results obtained by such variations
Binarization algorithms Time (seconds) Adaptive Threshold [21] 62.1
HSV [22] 85.7
Mean Shift [23] 73.9
Table 1: Execution time of the workflow illustrated in Figure 9 with variations of sub-workflow B on one plant measured during one seasonal growth (5 weeks). This experiment gathered 124 images.
can then be compared (mainly qualitatively) by the user.
Exploiting the Grid. Execution times of Binarization algorithms reported in Table 1 are related to one single plant of one single genotype for which 13 images have been collected during one month. The challenge then lies in considering 300 genotypes, with 1900 plants in each genotype. Per day, a PhenoArch platform produces 20000 images of 50M, equivalent to 1To/day, 5To/week and 250 To/year. Without any distributed infrastructure, process-ing these huge amounts of data would take between 409 days and 565 days (depending on the strategy followed for the sub-workflow B).
For this project, France-Grilles provides us with 32 000 logical process units. With only a subset of this resource (2%), the whole computation, scheduled by SciFloware, can be performed in less than 12 hours (night time). Exploiting Provenance. During any execution, provenance data, that is, all the data items processed and produced (including intermediate and final images) are stored on iRODS. Based on this provenance information, IPython notebooks are automatically generated for each individual plant either at a given time, or for the entire growth period, or for a given genotype. Each cell of the notebook contains the script of the workflow node executed. The input/output data are direct references to the data produced and stored in iRODS.
Very interestingly, users can upload a given notebook (see Figure 10) with the corresponding data, and modify the execution parameters directly on their computer to visualize the impact of such modifications and better understand their results. Thus, biologists can explore the obtained results a posteriori to discover for instance why some outliers on the ”growth curve” (see Figure 9E) have appeared. Reasons for this situation may actually be numerous, including problems occurring during acquisition (e.g., the plant
may have fallen...), limitation of the method used (bugs in the implementa-tion...) or wrong set of parameters.
Figure 10: Notebook generated from the provenance of the execution of the workflow illustrated in Figure 9.B. Each node corresponds to a cell containing the equivalent Python function. Values flowing through edges have a name ’edge’ with a value captured by the provenance module and stored into iRODS. The two images displayed correspond to the plant before and after its binarization. The total number of pixels of the plant is 87 489, which is the last cell value.
5. Discussion
In the last ten years, several approaches have been designed to distribute scientific workflows on parallel environments. Survey papers and books in-clude [24, 25, 26, 27]. While cloud computing is increasingly used to manage Life Science data, our project involves large numbers of production sites and collaborating users, and such numbers are growing over time, making Grid technologies particularly well-suited [28].
More precisely, we wrup and discuss the four key aspects of our ap-proach.
First of all, the infrastructure we introduce in this paper works on a production environment with real and huge data sets produced on a daily basis. In Plant phenotyping, which is a field of growing importance in the context of climate change and food security [29, 30, 31], complex data sets produced by high-throughput image based phenotyping platforms need to be combined with highly heterogeneous data. In particular, compared to classical bioinformatics (largely driven by molecular biology), the need in plant phenomics is on modeling, simulation, designing statistical approaches, and performing complex image analysis. This poses new challenges in data integration and calls for new kinds of analytical tools [32, 33].
Second, the workflow system we use is well-established in the Plant com-munity. It is well-known by our first generation users, and has very specific features, making it possible to perform both data analysis and simulation (retro-action loops, modeling) while allowing visualization of complex data. As shown previously in [10, 6], OpenAlea belongs to the family of functional workflow systems (such as [9, 34, 35, 36]). It provides a unique solution, which is able to extend the dataflow model of computation by introducing higher-order language constructs in a visual programming environment, thus allowing to design highly expressive workflows in a fully uniform way.
Third, while the context of this work is data intensive and involves very complex experiments on huge data sets, we use a middleware approach to make the distribution and coordination of jobs transparent to the user. Sci-Floware is data-driven [37] in the sense that its internal workflow language clearly separates the definition of data to be processed from the graph of activities to be applied to the data. This separation is particularly suited to scientific workflows where the same experiment has to be reused for analyzing different data sets without any change. Optimization in SciFloware focuses on two main aspects: It uses asynchronous messages to execute workflows on a distributed infrastructure such as Grid or Cloud [37, 38]. Furthermore, while it uses generally coarse grain parallelism, it is able to exploit the fact that some workflow actors may be algebraic operators (i.e., some actors are not black-boxes) to optimize the workflow execution. Additionally, basing the SciFloware implementation on the middleware SON [12] which follows the SAAS concept (Software as a Service) makes it very modular and flexible.
Last but not least, we have developed a large series of reproducibility-friendly features. Our approach allows users to share their experiments in
the spirit of [39], understand and compare their results [40] and possibly refine their analysis process to augment quality of their data sets. To do so, we have followed the recommendations and current standards on provenance [41] [19] and introduced a generator of IPython/Jupyter notebooks [2].
6. Conclusion
High-throughput phenotyping platforms provide a unique and particu-larly novel kind of solution to study the behavior of plants in context of climate change and food security. At the same time, size and complexity of data sets produced by such platforms are huge, constantly augmenting and the experiments to be performed are becoming increasingly complex, posing particularly novel challenges.
This paper introduces the InfraPhenoGrid infrastructure we designed and deployed to efficiently manage the data sets produced by the PhenoArch plant phenomics platform in the context of the Phenome Project.
Our solution consists in deploying scientific workflows on a Grid (France-Grilles) using a middleware to pilot workflow executions. InfraPhenoGrid is user-friendly in the sense that despite the intrinsic complexity of the in-frastructure, running scientific workflows and understanding results obtained (using provenance information) is kept as simple as possible for end-users.
Future work includes considering automatic transformation of scripts de-signed by scientists into OpenAlea scientific workflows to augment the size of the workflow library. We are also working on techniques to augment the reuse of workflows (and scripts) by guiding the design of such experiments ([42, 43]).
Another very important point we are actively working on is the repro-ducibility of scientific results. From the data point-of-view, one of the main challenge lies in finding the right level of granularity at which visualizing and, to some extent, recording the data [44]. Currently, the complete data sets are kept while we investigate several techniques (inspired from [42]) to re-duce the amount of data stored while ensuring a good level of reproducibility. From the environment point-of-view, we are currently able to consider virtual machine techniques to reproduce a given experiment in the exact same con-ditions (same OS, software versions...). Ongoing work includes considering techniques to re-execute experiments in new environments, where upgraded versions of software are considered [45].
7. Acknowledgement
The authors acknowledge the support of France-Grilles for providing com-puting resources on the French National Grid Infrastructure. This work has been performed in the context of the IBC (Institute of Computational Biol-ogy) in Montpellier, France. MM has received the support of the EU in the framework of the Marie-Curie FP7 COFUND People Programme, through the award of an AgreenSkills fellowship under grant agreement n 267196. Authors would like to thank Julien Coste (from INRIA) for his help in the OpenAlea server.
[1] S. Cohen-Boulakia, U. Leser, Next generation data integration for life sciences, in: Proc. of the 25th Int. Conf. on Data Engineering (ICDE), IEEE, pp. 1366–1369.
[2] H. Shen, Interactive notebooks: Sharing the code., Nature 515 (2014) 151–152.
[3] M. Ragan-Kelley, F. Perez, B. Granger, T. Kluyver, P. Ivanov, J. Fred-eric, M. Bussonier, The jupyter/ipython architecture: a unified view of computational research, from interactive exploration to communication and publication., in: AGU Fall Meeting Abstracts, volume 1, p. 07. [4] A. Tsaregorodtsev, M. Bargiotti, N. Brook, A. C. Ramo, G. Castellani,
P. Charpentier, C. Cioffi, J. Closier, R. G. Diaz, G. Kuznetsov, Y. Y. Li, R. Nandakumar, S. Paterson, R. Santinelli, A. C. Smith, M. S. Miguelez, S. G. Jimenez, Dirac: a community grid solution, Journal of Physics: Conference Series 119 (2008).
[5] M. Hedges, A. Hasan, T. Blanke, Management and preservation of research data with irods, in: Proceedings of the ACM first workshop on CyberInfrastructure: information management in eScience, ACM, pp. 17–22.
[6] C. Pradal, S. Dufour-Kowalski, F. Boudon, C. Fournier, C. Godin, Ope-nalea: a visual programming and component-based software platform for plant modelling, Functional plant biology 35 (2008) 751–760.
[7] J. Goecks, A. Nekrutenko, J. Taylor, Galaxy: a comprehensive approach for supporting accessible, reproducible, and transparent computational research in the life sciences., Genome Biology 11 (2010) R86.
[8] P. Missier, S. Soiland-Reyes, S. Owen, W. Tan, A. Nenadic, I. Dunlop, A. Williams, T. Oinn, C. Goble, Taverna, reloaded, in: M. Gertz, T. Hey, B. Ludaescher (Eds.), Proceedings of the 22nd International Conference on Scientific and Statistical Database Management (SS-DBM), Heidelberg, Germany.
[9] B. Lud¨ascher, I. Altintas, On providing declarative design and pro-gramming constructs for scientific workflows based on process networks (2003).
[10] C. Pradal, C. Fournier, P. Valduriez, S. Cohen-Boulakia, Openalea: sci-entific workflows combining data analysis and simulation, in: Proceed-ings of the 27th International Conference on Scientific and Statistical Database Management (SSDBM), ACM, p. 11.
[11] V. Curcin, M. Ghanem, Scientific workflow systems-can one size fit all?, in: Proc. of Biomedical Engineering Conference, pp. 1–9.
[12] A. A. Lahcen, D. Parigot, A lightweight middleware for developing p2p applications with component and service-based principles, in: Compu-tational Science and Engineering (CSE), 2012 IEEE 15th International Conference on, IEEE, pp. 9–16.
[13] E. Ogasawara, J. Dias, D. Oliveira, F. Porto, P. Valduriez, M. Mattoso, An algebraic approach for data-centric scientific workflows, Proc. of VLDB Endowment 4 (2011) 1328–1339.
[14] D. Hardt, The oauth 2.0 authorization framework (2012).
[15] P. Guo, Cde: A tool for creating portable experimental software pack-ages, Computing in Science and Engineering 14 (2012) 32–35.
[16] D. Merkel, Docker: lightweight linux containers for consistent develop-ment and deploydevelop-ment, Linux Journal 2014 (2014) 2.
[17] A. Rajasekar, R. Moore, C.-y. Hou, C. A. Lee, R. Marciano, A. de Torcy, M. Wan, W. Schroeder, S.-Y. Chen, L. Gilbert, et al., irods primer: integrated rule-oriented data system, Synthesis Lectures on Information Concepts, Retrieval, and Services 2 (2010) 1–143.
[18] G. Sandve, A. Nekrutenko, J. Taylor, E. Hovig, Ten simple rules for reproducible computational research, PLoS comp. biology 9 (2013) e1003285.
[19] L. Moreau, P. Missier, Prov-dm: The prov data model (2013).
[20] J. D. Hunter, Matplotlib: A 2d graphics environment, Computing In Science & Engineering 9 (2007) 90–95.
[21] E. Navon, O. Miller, A. Averbuch, Color image segmentation based on adaptive local thresholds, Image and vision computing 23 (2005) 69–85. [22] S. Sural, G. Qian, S. Pramanik, Segmentation and histogram generation using the hsv color space for image retrieval, in: Image Processing. 2002. Proceedings. 2002 International Conference on, volume 2, IEEE, pp. II– 589.
[23] D. Comaniciu, P. Meer, Mean shift: A robust approach toward fea-ture space analysis, Pattern Analysis and Machine Intelligence, IEEE Transactions on 24 (2002) 603–619.
[24] J. Liu, E. Pacitti, P. Valduriez, M. Mattoso, A survey of data-intensive scientific workflow management, Journal of Grid Computing (2015) 1– 37.
[25] I. Foster, Y. Zhao, I. Raicu, S. Lu, Cloud computing and grid computing 360-degree compared, in: Grid Computing Environments Workshop, 2008. GCE’08, Ieee, pp. 1–10.
[26] J. Yu, R. Buyya, A taxonomy of workflow management systems for grid computing, Journal of Grid Computing 3 (2005) 171–200.
[27] G. C. Fox, D. Gannon, Workflow in grid systems, Wiley Interscience, 2006.
[28] M. T. ¨Ozsu, P. Valduriez, Principles of distributed database systems, Springer Science & Business Media, 2011.
[29] F. Tardieu, R. Tuberosa, Dissection and modelling of abiotic stress tolerance in plants, Current opinion in plant biology 13 (2010) 206–212.
[30] R. T. Furbank, M. Tester, Phenomics–technologies to relieve the phe-notyping bottleneck, Trends in plant science 16 (2011) 635–644.
[31] D. Houle, D. R. Govindaraju, S. Omholt, Phenomics: the next challenge, Nature Reviews Genetics 11 (2010) 855–866.
[32] F. Fiorani, U. Schurr, Future scenarios for plant phenotyping, Annual review of plant biology 64 (2013) 267–291.
[33] S. Dhondt, N. Wuyts, D. Inz´e, Cell to whole-plant phenotyping: the best is yet to come, Trends in plant science 18 (2013) 428–439.
[34] D. Turi, P. Missier, C. Goble, D. De Roure, T. Oinn, Taverna work-flows: Syntax and semantics, in: e-Science and Grid Computing, IEEE International Conference on, IEEE, pp. 441–448.
[35] P. M. Kelly, P. D. Coddington, A. L. Wendelborn, Lambda calculus as a workflow model, Concurrency and Computation: Practice and Experience 21 (2009) 1999–2017.
[36] J. Brandt, M. Bux, U. Leser, A functional language for large scale scientific data analysis, in: BeyongMR, ICDT/EDBT Workshop. [37] J. Montagnat, B. Isnard, T. Glatard, K. Maheshwari, M. B. Fornarino,
A data-driven workflow language for grids based on array programming principles, in: Proceedings of the 4th Workshop on Workflows in Sup-port of Large-Scale Science, ACM, p. 7.
[38] D. Rogers, I. Harvey, T. Truong Huu, K. Evans, T. Glatard, I. Kallel, I. Taylor, J. Montagnat, A. Jones, A. Harrison, Bundle and pool archi-tecture for multi-language, robust, scalable workflow executions, Journal of Grid Computing (JOGC) 11 (2013) 457–480.
[39] S. Cohen-Boulakia, U. Leser, Search, adapt, and reuse: the future of scientific workflows, ACM SIGMOD Record 40 (2011) 6–16.
[40] Z. Bao, S. Cohen-Boulakia, S. B. Davidson, A. Eyal, S. Khanna, Differ-encing provenance in scientific workflows, in: Data Engineering, 2009. ICDE’09. IEEE 25th International Conference on, IEEE, pp. 808–819.
[41] P. Groth, M. Luck, L. Moreau, A protocol for recording provenance in service-oriented grids, in: Principles of Distributed Systems, Springer, 2005, pp. 124–139.
[42] O. Biton, S. Cohen-Boulakia, S. B. Davidson, C. S. Hara, Querying and managing provenance through user views in scientific workflows, in: Data Engineering, 2008. ICDE 2008. IEEE 24th International Confer-ence on, IEEE, pp. 1072–1081.
[43] S. Cohen-Boulakia, J. Chen, P. Missier, C. Goble, A. Williams, C. Froidevaux, Distilling structure in Taverna scientific workflows: a refactoring approach, BMC Bioinformatics 15 (2014) S12.
[44] A. Chapman, H. Jagadish, Issues in building practical provenance sys-tems., IEEE Data Eng. Bull. 30 (2007) 38–43.
[45] F. S. Chirigati, D. Shasha, J. Freire, Reprozip: Using provenance to sup-port computational reproducibility., in: TaPP, International Workshop on Theory and Practice of Provenance.