Publisher’s version / Version de l'éditeur:
Proceedings of the 16th IAHR International Symposium on Ice, 2, pp. 187-193, 2002-12-02
READ THESE TERMS AND CONDITIONS CAREFULLY BEFORE USING THIS WEBSITE.
https://nrc-publications.canada.ca/eng/copyright
Vous avez des questions? Nous pouvons vous aider. Pour communiquer directement avec un auteur, consultez la première page de la revue dans laquelle son article a été publié afin de trouver ses coordonnées. Si vous n’arrivez pas à les repérer, communiquez avec nous à [email protected].
Questions? Contact the NRC Publications Archive team at
[email protected]. If you wish to email the authors directly, please see the first page of the publication for their contact information.
NRC Publications Archive
Archives des publications du CNRC
This publication could be one of several versions: author’s original, accepted manuscript or the publisher’s version. / La version de cette publication peut être l’une des suivantes : la version prépublication de l’auteur, la version acceptée du manuscrit ou la version de l’éditeur.
Access and use of this website and the material on it are subject to the Terms and Conditions set forth at
Ice Strength During the Melt Season
Timco, Garry; Johnston, Michelle
https://publications-cnrc.canada.ca/fra/droits
L’accès à ce site Web et l’utilisation de son contenu sont assujettis aux conditions présentées dans le site
LISEZ CES CONDITIONS ATTENTIVEMENT AVANT D’UTILISER CE SITE WEB.
NRC Publications Record / Notice d'Archives des publications de CNRC: https://nrc-publications.canada.ca/eng/view/object/?id=dde8b5bc-f5bf-4da9-a515-dcd87782240b https://publications-cnrc.canada.ca/fra/voir/objet/?id=dde8b5bc-f5bf-4da9-a515-dcd87782240b
Ice in the Environment: Proceedings of the 16th IAHR International Symposium on Ice Dunedin, New Zealand, 2nd–6th December 2002
International Association of Hydraulic Engineering and Research
SEA ICE STRENGTH DURING THE MELT SEASON
G.W. Timco1 and M.E. Johnston1
ABSTRACT
An analysis has been made of the changes in the strength of first-year sea ice as it goes through the melt season. A comparison has been made between measured ice borehole strengths and flexural strengths calculated using the equation of Timco and O’Brien (1994). Both strengths show a dramatic decrease as the air temperature rises during the spring season. The analysis shows that there is excellent agreement between the decrease in strength of the ice borehole strength and the flexural strength. The strength of the ice sheet is approximately 20% of its peak mid-winter strength once the mean daily air temperature has been above 0°C for a few days. This paper discusses the analysis and results.
INTRODUCTION
Sea ice is a complex material which is composed of solid ice, brine, air and, depending upon the temperature, solid salts. Ice growth mechanisms produce different grain structures, depending upon the prevailing conditions. Details of the ice microstructure influence significantly the mechanical and physical properties of the ice. When ice grows, it traps some of the salt that is present in the seawater. The amount of salt that is trapped in the growing ice sheet is affected by several factors, including growth rate, grain structure and the natural rejection of salt from the ice lattice. Typically first-year sea ice has salinity in the range of 4 to 6 ‰ salt, which is lower than the typical 35 ‰ salinity of seawater. The brine, air and solid salts are usually trapped at sub-grain boundaries between a mostly pure ice lattice. Also, because a temperature gradient exists in the ice, the upper surface of the ice is close to the ambient air temperature, and the lower surface is at the freezing point (-1.8°C). Because various salts are present in the ice, the phase relationship with temperature is multifarious (see e.g., Weeks and Ackley, 1982). All of these factors make understanding and characterizing sea ice extremely difficult.
The Canadian Hydraulics Centre of the National Research Council of Canada has carried out field programs to measure the properties of sea ice during the melt season (Johnston and Frederking, 2001a, 2001b; Johnston et al., 2001, 2002). Measurements were conducted in landfast first-year sea ice near Resolute, Cornwallis Island in the Canadian Arctic, in support of the scientific basis of the Canadian Ice Regime System
1
(Timco and Kubat, 2001). Field programs have been conducted for two sequential years, in 2000 and 2001. The programs began in May, when the ice was cold, and extended until June and July, when the snow cover had melted fully and the ice was beginning to ablate. Basic ice property measurements included snow depth, ice thickness, air and ice temperature, ice salinity and borehole jack strength.
In 1994, Timco and O’Brien developed an equation that related the flexural strength of first-year sea ice to the brine volume of the ice. Since the brine volume can be determined from basic ice property measurements that were made during the 2000-2001 field programs, it is possible to calculate the flexural strength of the ice. In addition, a large number of in situ borehole jack measurements were made throughout the field programs (Johnston et al., 2002). This paper presents a comparison between the calculated flexural strength and the measured ice borehole strengths.
CALCULATING THE FLEXURAL STRENGTH
Several researchers have related the strength of sea ice to the brine volume or total porosity of the ice. There is a good reason for this. It is generally assumed that as the total porosity in the ice increases, the strength should decrease, since there is less "solid ice" that has to be broken. Timco and O’Brien (1994) have done the most comprehensive analysis of the flexural strength of ice. They compiled a database of over 2500 reported measurements on the flexural strength of freshwater ice and sea ice. The authors showed that the data for first-year sea ice could be described by:
) * 88 . 5 ( exp 76 . 1 b f υ σ = − (1)
where σ f is the flexural strength of the ice in MPa, and the brine volume (υb) is
expressed as a brine volume fraction. The brine volume of the ice can be related to the ice temperature (Ti in °C) and ice salinity (Si in ppt) by (Frankenstein and Garner,
1967):
[
49.185 +0.532]
= i i
b S T
υ for –0.5°C ≥ Ti≥ -22.9°C (2)
For the present purposes, it was of interest to calculate the flexural strength based solely on external physical properties of the ice. To do this, the salinity of the ice was determined using the relationship between the salinity of cold sea ice and the ice thickness (hi) as [from Timco and Frederking (1990) updating the earlier work of Cox
and Weeks (1974)]: i i h S =13.4−17.4 for hi≤ 0.34 m; i i h S =8.0−1.62 for hi≥ 0.34 m. (3)
The average ice temperature (Tia) was used for calculating the average brine volume of
the ice in Equation (2). The average ice temperature was determined by assuming a linear temperature profile in the ice. The bottom ice temperature was taken as –1.8°C, and the ice surface temperature (Ts) was determined from the relationship developed by
Ts = Ta for –2 ≥ Ta≥ -10
Ts = 0.6 Ta – 4 for Ta < -10 (4)
where Ta is the air temperature in °C. Using this approach, the flexural strength was
calculated based upon only the ice thickness and air temperature.
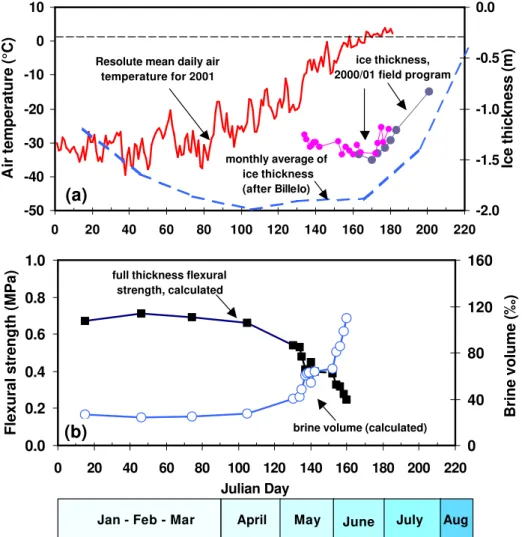
Figure 1 presents a case study illustrating a portion of the annual (winter-spring) ice cycle. Figure 1a shows the ice thickness and the air temperature in the Resolute region in the Canadian Arctic from January to mid-July. Mid-winter ice thickness values were approximated using ice thickness measurements made by Billelo (1980) on first-year ice near Resolute from 1959 to 1972. His measurements for that time period were about 0.40 m thicker than ice during the decay season field measurements (for the same time of year). As a result, the figure shows a discontinuity between ice thickness reported by Billelo (1980) and the field measurements from years 2000/2001. The air temperatures in the figure are the mean daily air temperatures recorded at Resolute in year 2001.
-50 -40 -30 -20 -10 0 10 0 20 40 60 80 100 120 140 160 180 200 220 A ir temperature (°C) -2.0 -1.5 -1.0 -0.5 0.0 Ice thickness (m) monthly average of ice thickness (after Billelo) ice thickness, 2000/01 field program Resolute mean daily air
temperature for 2001 0.0 0.2 0.4 0.6 0.8 1.0 0 20 40 60 80 100 120 140 160 180 200 220 Julian Day
Flexural strength (MPa)
0 40 80 120 160 Brine volume (‰)
brine volume (calculated) full thickness flexural
strength, calculated
April May June July Aug
Jan - Feb - Mar
(a)
(b)
Figure 1: Plot of the (a) ice thickness and air temperature at Resolute and (b) the calculated brine volume and flexural strength of the first-year sea ice. The properties are plotted as a function of the Julian Day.
Figure 1b shows the brine volume that was calculated using Equation (2) and the ice thickness and air temperature data from Figure 1a. The brine volume was relatively constant throughout the winter months and began to rise at Julian Day (JD) 130. After that date, the brine volume increased rapidly. At JD 160, the rate of increase of the brine volume was extremely large, resulting in a brine volume being in a near “run-away” condition. Figure 1b also shows the flexural strength calculated using Equation (1). The strength is almost a mirror reflection of the brine volume behaviour. It was relatively constant throughout the winter months with a value of approximately 0.7 MPa. At about JD 130, it began to decrease rapidly such that by about JD 160, the flexural strength was on the order of 0.25 MPa. For higher brine volumes, the flexural strength relationship would not be valid.
COMPARISON OF FLEXURAL AND ICE BOREHOLE STRENGTH
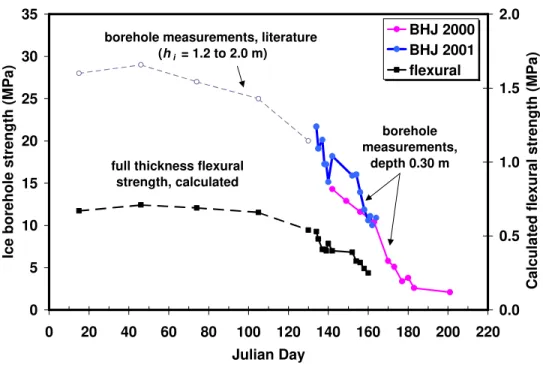
Johnston et. al. (2002) describe the borehole jack measurements made on the ice in the Resolute region. Figure 2 shows a comparison of the calculated flexural strength with these ice borehole strength measurements. As expected, the ice borehole strengths (BHJ) are considerably higher than the flexural strength since the BHJ measures the confined compressive strength of the ice. Nevertheless, the general trends of the strength behaviour are very similar. The ice borehole strength in mid-winter was estimated from BHJ measurements on cold sea ice reported by Blanchet et al. (1997).
0 5 10 15 20 25 30 35 0 20 40 60 80 100 120 140 160 180 200 220 Julian Day
Ice borehole strength (MPa)
0.0 0.5 1.0 1.5 2.0
Calculated flexural strength (MPa)
BHJ 2000 BHJ 2001 flexural borehole measurements, depth 0.30 m borehole measurements, literature
(hi = 1.2 to 2.0 m)
full thickness flexural strength, calculated
Figure 2: Plot of the measured borehole jack strength (left axis) in the 2000 and 2001 field programs, and the calculated flexural strength (right axis) for sea ice in the Resolute region as a function of Julian Day.
The ratio of ice borehole strength to flexural strength was forty-three in mid-winter and decreased to about eight in late spring. Since the relation between the two strength measurements cannot be represented by a constant ratio, the two strengths were normalized with respect to their maximum, mid-winter values. For the flexural strength, the calculated mid-winter strength of 0.71 MPa was used as a normalizing value. For the
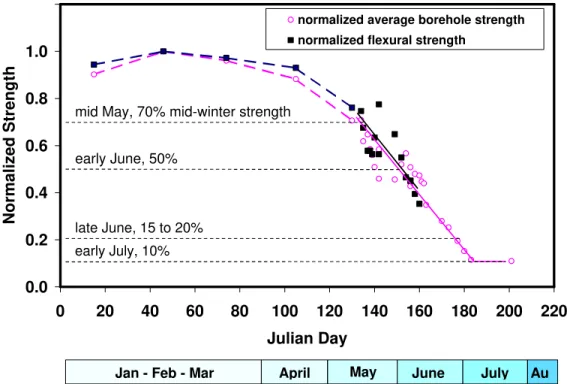
BHJ data, the borehole strengths at depths 0.30 and 0.90 m were extrapolated to give the winter strength of the two ice depths. These were then averaged to give a mid-winter ice borehole strength value for the full ice sheet of 25.5 MPa. Figure 3 shows the results of the mid-winter normalization process. The trends of decreasing normalized strengths in Figure 3 are in excellent agreement with one another. Both strengths show that in mid-May, the ice had about 70% of its mid-winter strength. By early June, the ice had about 50% of its mid-winter strength. After the first week of June, only the borehole jack measurements provided information about the degradation in ice strength. Measurements showed that by the end of June, the ice had only 15 to 20% of its mid-winter strength. The ice strength was stable during the month of July, when only 10% of the mid-winter ice strength remained. To put this in perspective, this flexural strength value for the sea ice of approximately 70 kPa is only slightly higher than the flexural strength of ice used in physical modelling facilities. In physical model tests, the flexural strength of the model ice is typically on the order of 30 to 60 kPa.
0.0 0.2 0.4 0.6 0.8 1.0 1.2 0 20 40 60 80 100 120 140 160 180 200 220 Julian Day Normalized Strength
normalized average borehole strength normalized flexural strength
April May June July Au Jan - Feb - Mar
mid May, 70% mid-winter strength
early June, 50%
late June, 15 to 20% early July, 10%
Figure 3: Comparison of normalized ice borehole strength and calculated flexural strength as a function of the Julian Day
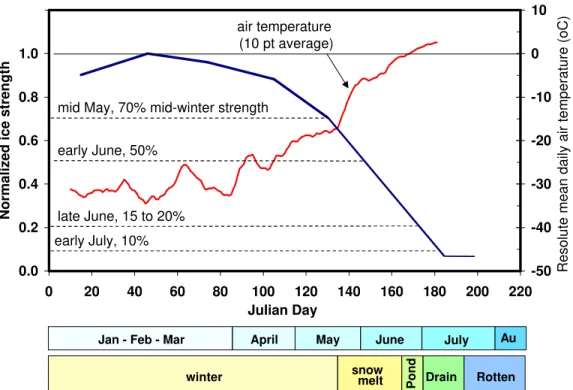
Figure 4 shows the correlation between the ice strength and air temperature. Increasing air temperatures and increased solar radiation are the primary reasons for the decrease in ice strength during the decay season. Once the air temperature warms to about –10°C, the majority of the internal salts within the ice have been converted from the solid phase to the liquid phase, and the sea ice is no longer in its mid-winter state. After the ambient air temperatures rise above about –10°C, the brine pockets rapidly begin to increase in size, causing a decrease in ice strength. Figure 4 shows that the decrease in ice strength continues until early July, by which time the ice has about 10% of its mid-winter strength.
0.0 0.2 0.4 0.6 0.8 1.0 1.2 0 20 40 60 80 100 120 140 160 180 200 220 Julian Day
Normalized ice strength
-50 -40 -30 -20 -10 0 10
Resolute mean daily air temperature (oC)
April May June July Au
g Jan - Feb - Mar
winter snow
Pond Drain Rotten
melt air temperature (10 pt average) early June, 50% late June, 15 to 20% early July, 10%
mid May, 70% mid-winter strength
Figure 4: Relation between the ice strength and air temperature as a function of Julian Day.
ICE STRENGTH AND STAGES OF DECAY
DeAbreu et al. (2001) examined time-sequenced satellite images of landfast first-year sea ice in the Resolute region during the 2000 ice decay season. They described five stages of ablation: winter sea ice, snow melt, pond formation, pond drainage, and rotten ice. These five stages of ablation are indicated in the bottom bar on Figure 4. The snow melt stage began in mid-May and extended to late-June. Ice strength during the snow melt stage ranged from 70% to 40% of its mid-winter strength. After the snow melt stage, melt ponds began to form on the ice surface. The ponding stage occurred in late June and lasted for about one to two weeks. During the ponding stage, the ice had about 30% to 20% of its mid-winter strength. Melt pond drainage began in early July and continued throughout the month. Ice strength during the pond drainage stage was from 20% to 10% of the mid-winter ice strength. Once the melt ponds drained from the ice, the ice was considered rotten, the most advanced stage of decay. This information on ice strength and stages of decay is being used by the Canadian Ice Service to develop a product providing weekly information on the strength of first-year level sea ice in the Canadian Arctic (Gauthier et. al., 2002).
ACKNOWLEDGEMENTS
The authors would like to thank Victor Santos-Pedro for his support to undertake this research, and Transport Canada for funding. The interest and support of this work by the Canadian Ice Service is also greatly appreciated.
REFERENCES
Billelo, M. 1980. Maximum Thickness and Subsequent Decay of Lake, River and Fast Sea Ice in Canada and Alaska, USA CRREL Report 80-6, Hanover, NH, USA.
Blanchet, D., Abdelnour, R. and Comfort, G. 1997. Mechanical Properties of First-year Sea Ice at Tarsiut Island. Jour. of Cold Regions Engineering, Vol. 1, pp. 59-83. Cox, G. and Weeks, W.F. 1974. Salinity Variations in Sea Ice. J. Glaciology Vol. 13,
pp 109-120.
DeAbreu, R., Yackel, J., Barber, D., and Arkette, M. 2001. Operational Satellite Sensing of Arctic First-Year Sea Ice Melt. Can. J. of Remote Sensing, Vol. 27, pp. 487-501.
Frankenstein, G.E. and Garner, R. 1967. Equations for Determining the Brine Volume of Sea Ice from -0.5 to -22.9 C. Journal of Glaciology, Vol. 6, pp. 943-944. Gauthier, M-F., DeAbreu, R., Timco, G.W. and Johnston. M.E. 2002. Ice Strength
Information in the Canadian Arctic: From Science to Operations. Proceedings IAHR Ice Symposium (this volume), Dunedin, New Zealand.
Johnston, M. and Frederking, R. 2001a. Decay of First Year Sea Ice: A Second Season of Field Measurements. NRC Report HYD-TR-69, Ottawa, Ont., Canada, 21 pp. Johnston, M. and Frederking, R. 2001b. Decay Induced Changes in the Physical and
Mechanical Properties of First-year Sea Ice. Proceedings POAC’01, Vol. 3, pp. 1395-1404, Ottawa, Canada.
Johnston, M., Frederking, R. and Timco, G. 2002. Properties of Decaying First Year Sea Ice: Two Seasons of Field Measurements. Proceedings 17th International Conference on Okhotsk Sea and Sea Ice, pp 303-311, Mombetsu, Hokkaido, Japan.
Johnston, M., Frederking, R. and Timco, G. 2001. Seasonal Decay of First-Year Sea Ice. NRC Report HYD-TR-058, Ottawa, Ont., Canada.
Timco, G.W. and Frederking, R.M.W. 1990. Compressive Strength of Sea Ice Sheets. Cold Regions Science and Technology, Vol. 17, pp. 227-240.
Timco, G.W. and Kubat, I. 2001. Canadian Ice Regime System: Improvements Using an Interaction Approach. Proceedings POAC’01, Vol. 2, pp 769-778, Ottawa, Canada.
Timco, G.W. and O’Brien, S. 1994. Flexural Strength Equation for Sea Ice. Cold Regions Science and Technology, Vol. 22, pp. 285-298.
Weeks, W.F. and Ackley, S.F. 1982. The Growth, Structure and Properties of Sea Ice. USA CRREL Monograph 82-1, Hanover, NH, USA.