HAL Id: hal-00945881
https://hal.inria.fr/hal-00945881
Submitted on 18 Feb 2014
HAL is a multi-disciplinary open access
archive for the deposit and dissemination of
sci-entific research documents, whether they are
pub-lished or not. The documents may come from
L’archive ouverte pluridisciplinaire HAL, est
destinée au dépôt et à la diffusion de documents
scientifiques de niveau recherche, publiés ou non,
émanant des établissements d’enseignement et de
running on multi-core physical machines
Laurent Pouilloux, Jonathan Rouzaud-Cornabas
To cite this version:
Laurent Pouilloux, Jonathan Rouzaud-Cornabas. Performance analysis and models for collocated
VMs running on multi-core physical machines. [Research Report] RR-8473, INRIA. 2014, pp.30.
�hal-00945881�
0249-6399 ISRN INRIA/RR--8473--FR+ENG
RESEARCH
REPORT
N° 8473
February 2014Analyse et modélisation
de performance pour les
machines virtuelles
partageant des machines
physiques multi-cœurs
RESEARCH CENTRE GRENOBLE – RHÔNE-ALPES Inovallée
machines physiques multi-cœurs
Laurent Pouilloux
∗, Jonathan Rouzaud-Cornabas
∗Project-Team Avalon
Research Report n° 8473 — February 2014 — 29 pages
for fault tolerance and energy optimisation. In this context, understanding the performance behav-ior of virtual machines and the interference between them is a major scientific challenge that will allow a more efficient usage of resources. The first step is to characterize CPU usage sharing and to propose a performance model for virtual machines. Nonetheless, focusing on the sharing of a single CPU core is no more possible as next generation high performance machines will contain a large number of cores. Moreover, as these cores share micro-architectural resources e.g. caches, using a single core performance model is not sufficient as inter-core interference can happen. Finally, to be able to use such a model in large scale infrastructures as Clouds or high performance computers, the model must be lightweight to simulate the behavior of tens of thousands physical machines hosting hundreds of thousands virtual machines (VMs).
In this paper, we present an in-depth analysis of the performance of collocated VMs. By running our experiments on the Grid’5000 testbed, we were able to evaluate 2 processor families for a total of 6 different processor models. We have systematically explored the effect of collocation by testing all the different VCPU to CPU mapping while taking into account micro-architectural components (shared caches and NUMA nodes). We also explored the effect of multi-core virtual machines. Based on these experiments, we evaluate 8 lightweight performance models and observe that the virtual machine performance can be accurately predicted using a model that takes into account the number of VMs on the core and on the related NUMA node (with less than 8% error). Finally, we validate our models on several processors and on both single and multi-(virtual)-cores VM. Using this model, we can increase the accuracy of the virtualization layer of the general purpose distributed system simulator SimGrid and improve it’s usability to simulate (HPC) Clouds. These results may also be used to improve VM placement algorithms.
Key-words: Cloud, IaaS, Isolation, VM, Performance analysis, Performance model, Experimen-tal science, Multi-cores
running on multi-core physical machines
R´esum´e : La prochaine g´en´eration d’ordinateur haute performance (HPC) utilisera massive-ment la virtualisation comme un moyen pour partager les ressources mat´erielles entre plusieurs applications et ´egalement pour fournir des m´ecanismes flexibles pour la tol´erance aux fautes ainsi que l’optimisation ´energ´etique. Dans ce contexte, comprendre comment se comporte la performance des machines virtuelles et les interf´erences entre elles est un d´efi scientifique majeur qui permettra d’aller vers un utilisation plus efficace des ressources. La premi`ere ´etape est la caract´erisation du partage de processeur et d’en proposer un mod`ele de performance pour les machines virtuelles. Mais, se concentrer sur le partage d’un processeur unique n’est plus possible. En effet, les prochaines g´en´erations d’ordinateur haute performance contiendront un tr`es large ensemble de cœurs. De plus, comme ces cœurs partages des ressources micro-architecturales, e.g. caches, utilis´e un mod´ele de performance d’un cœur unique n’est pas suffisant car il ne capturerait pas les interferences entre cœurs. Finalement, pour pouvoir utiliser un tel mod`ele `a l’´echelle d’infrastructures large ´echelle tel que les Clouds ou les ordinateurs HPC, le mod`ele doit ˆetre l´eger pour pouvoir simuler des dizaines de milliers de machines physiques h´ebergeant des centaines de milliers de machines virtuelles.
Dans ce papier, nous pr´esentons une analyse en profondeur des performances de machines virtuelles colocalis´ees, i.e. s’ex´ecutant sur la mˆeme machine physique. En ex´ecutant nos exp´erimentations sur le banc d’essai Grid’5000, nous avons pu ´evaluer 2 familles de processeurs pour un total de 6 diff´erents mod`eles de processeurs. Nous avons explor´e syst´ematiquement l’effet de la colocalisation en testant tous les diff´erentes placements VCPU vers CPU tout en prenant en compte les composants micro-architecturaux (caches partag´es et NUMA nodes). Nous avons ´egalement explor´e l’effet des machines virtuelles qui ont plusieurs cœurs. En se basant sur ces exp´erimentations, nous avons ´evalu´e 8 mod`eles l´egers de performance et observ´e que la perfor-mance d’une machine virtuelle peut ˆetre pr´ecis´ement pr´edite en utilisant un mod`ele qui prend en compte le nombre de machines virtuelles sur le cœur et le nombre de machines virtuelles sur la NUMA Node (avec un taux d’erreur inf´erieur `a 8%). Finalement, nous avons ´evalu´e nos mod`eles sur plusieurs processeurs et sur des machines virtuelles avec un ou plusieurs processeurs virtuels. En utilisant ce mod`ele, nous pourrons accroˆıtre la pr´ecision de la couche de virtualisation du simulateur g´en´erique pour les syst`emes distribu´es, SimGrid mais ´egalement sa capacit´e `a simuler des Clouds (haute performance). Nos r´esultats peuvent ´egalement ˆetre utilis´es pour am´eliorer les algorithmes de placement de machines virtuelles.
Mots-cl´es : Cloud, IaaS, Isolation, Machine Virtuelle, Analyse de performance, Mod`elisation de performance, Science exp´erimentale, Multi-cœurs
1
Introduction
Nowadays, virtualization is used everywhere from public to private infrastructures. One of the main advantages of virtualization is to be able to introduce flexibility in hardware resources usage by providing the ability to run multiple virtual machines (VMs) on a single physical machine (PM), i.e. consolidation. This applies to classic server virtualization but also on Clouds and high performance computers. In fact, running a single VM on a PM is an exception more than the norm. Hypervisors, through their scheduler, provide fair performance sharing between VMs running on the same PM. Nevertheless, this performance sharing must be carefully studied [14]. The performance sharing policy used by most hypervisors is based only on the fair sharing of a single physical CPU between multiple virtual CPUs (VCPU). Nonetheless, the physical CPUs are not the only hardware component shared between the collocated VMs. Micro-architectural components such as caches, NUMA nodes but also memory banks are shared between the VMs. Consequently, the sharing of these components can have an impact on the performance of col-located VMs. Thus, complex performance interferences can happen between the VMs and they need to be characterized.
To perform such a study, we must evaluate all the different mapping of VCPU to CPU that can happen while taking into account the micro-architectural components. Furthermore, by study-ing different processor families and models, we avoid bias due to different micro-architectural components (such as different hierarchy of caches) but also due to different low-level architecture (such as the ones due to the manufacturer of the processor).
The goal of our study is to provide some insight on how the performance of a VM is impacted by other VMs collocated on the same PM and the impact of the micro-architectural components when doing so. Thanks to an in-depth performance analysis, we give some insight on the real-world performance sharing between VMs. Moreover, this performance analysis allows us to propose a model of the performance of multiple VMs collocated on a single PM. Such model will be used to increase the accuracy of a virtualized platform and Cloud simulator [7]. Indeed, this work is part of a project with the goal of providing a fully accurate and validated simulator for Clouds. Part of this work has been published in [7, 10]. Finally, it can then be used to improve performance predictions of applications on virtualized platforms such as Clouds.
In this paper, we present an extensive analysis of the performance of collocated VMs. First, in Section 2, we motivate the need of having such model and especially the necessity of increasing the accurary of simulators. Moreover, we present the existing processor models and show that none of them are both taking into account multi-core architectures while being lightweight. In Section 3, we present our experiments and describe our methodology. During our experiments, we have tested all the different combinations of collocated VMs by carefully pinning1 VMs on
specific cores and NUMA nodes. Based on these experiments presented in Section 4, we propose 8 different performance models and select the best two. We validate our models on multiple processor families and models. Moreover, we demonstrate that a lightweight performance model that takes into account the number of VMs on a core and on the related NUMA node, can predict the performance of a VM with a margin of error of 8% in the worst case. Furthermore, we show that our model applies to both single and multi-(virtual)-cores VM. Finally, in the Section 5, we conclude and present our future work.
1
2
Related Work
As we previously stated, it is critical to have an in-depth knowledge on how the collocation of VMs impacts performance. Indeed, to simulate a platform and predict the performance of an application, it is critical to have a sound-proof model. In [10], it has been shown that having lightweight yet accurate model for virtualized platforms is complex. In virtualized platforms (mainly Clouds) simulator [3, 4, 13, 15], the model used when multiple VMs shared a physical machine consists in dividing the capacity of the core into fair shares. By doing so, the model puts aside the impact on performance due to VMs collocated on the same PM but on different cores. But, interferences between VMs are much more complex than just core sharing as shown in [17]. Accordingly, we need a more accurate model to predict how the sharing of the resources of a PM between multiple VMs happens.
Multiple fine-grained multi-core models and simulators have been created. First, cycle accu-rate processor simulators exist but they are too heavy and complex to be used to simulate tens thousands PMs [16, 6]. The paper [8] focuses on the impact on performance of caches shared between collocated VMs. They show the importance of taking into account micro-architectural components when running collocated VMs. Nevertheless, they do not propose a performance model. In [9], the authors do the same but focus on HPC applications. The authors of [11] focus on the performance interference between 2 VMs running on a PM. They study the impact on performance of sharing different components (cache and core) between these VMs. But they focus on an attack behavior and not on the normal sharing of resources between 2 VMs. The authors of [2] propose a performance model for multi-core systems. They do not study virtual-ization but the general case. Their simulator is accurate but complex and slow. The paper [1] focuses on one processor. Furthermore, the paper presents a benchmark tool more than a generic performance model. As these multi-core models are accurate but complex, they are well fitting to simulate a single PM but not more tens of thousands of them as required for Cloud simulator. Motivation Our goal is to study the impact on performance of collocated VMs and go further than just studying a single core. Indeed, virtualized platforms are no more composed of single CPU physical machines but of large multi-core PMs. Based on in-depth experiments, our goal is to propose an enhanced performance model that takes into account micro-architectural compo-nents. Nonetheless, we want a lightweight yet accurate model that can be used inside a Cloud simulator. Moreover, to execute such experiments, we need to use a reproducible approach that can be used for every combinations of the different parameters we want to study. To do so, we use Execo a toolkit to perform automatic and reproducible Cloud experiments [12]. We have run our experiments on the Grid’5000 testbed. Applying an open-science approach, we publish both the experiment engine and our experimental data. By doing so, we ease the reproducibility of our experiments and the validation by others of our models. In the rest of the paper, we present the different experimental parameters and present in detail the results of our experiments for one specific processor. Based on these results, we propose 6 performance models and select the 2 most accurate ones. Finally, we validate them on different kind of processor families and models and on both single and multi VCPU VMs.
3
Experimental Plan
As previously said, the goal of our study is to analyze the impact on performance of running multiple VMs on a multi-core computer. Accordingly, we use only one physical machine for each combination of experimental parameters. First, we have fix the following limitation: we
Cluster Processor Name Frequency Number Number of cores Number of NUMA (Ghz) of CPU (per CPU) Nodes(per CPU)
suno Intel Xeon E5520 2.26 2 4 1
granduc Intel Quad-Core Xeon L5335 2 2 4 2
stremi AMD Opteron 6164 HE 1.7 2 12 2
parapluie AMD Opteron 6164 HE 1.7 2 12 2
petitprince Intel Xeon E5-2630L 2 2 6 1
taurus Intel Xeon E5-2630 2.3 2 6 1
Table 1: Characteristics of the processor of each cluster
focus on the amount of FLOPS each VM gets. To measure the amount of FLOPS available, we use a part (kflops) of Linpack2. Our benchmark runs kflops during 300 seconds and for each
execution, it measures the amount of FLOPS. Second, we limit ourself to 2 types of VMs: no more than one VM with multiple VCPUs and a set of VMs with one VCPU. Third, we set the following constraint: no more than 4 VCPUs per CPU core. Indeed, a core (on Grid’5000) has 2Gb of RAM and we have set our VMs to use 512Mb of memory. Finally, we focus on the KVM hypervisor running on a Debian wheezy. Each VM is running a Debian squeeze.
Consequently, we have between 0 and 4 VCPUs per physical CPU core that run the bench-mark during each experimentation. The same is true for all the physical CPU cores of the PM. Moreover, when generating the different combinations of parameters, we take into account cells, i.e. shared caches and NUMA nodes. Accordingly, we have 2 main parameters: the number of VCPUs per core for each CPU core and the number of VMs on each cell. For each cluster, i.e. different processor architecture, we generate the different parameters’ combinations. Each com-bination corresponds to a specific mapping of VMs and VCPUs to physical cores. For example, a plan specifies to run 14 VMs with 3 VMs on core 0, 3 on core 1, 1 on core 2, 3 on core 3 and 1 on core 4 and one multi-core VMs with 2 VCPU on core 0 and 1. Then, we run the kflops benchmark on each VCPU by pinning process using numactl.
Our experiment engine is based on Execo 3 and is available at the following url: https:
//github.com/lpouillo/vm5k (MicroArchbench). This toolkit has been explained in details in [12].
4
Results
In this section, we first present our experimental environment. Then we do an in-depth analysis of the results of these experiments on an Intel Xeon E5-2630 processor. Based on these analysis, we propose 8 different performance models. Finally, we validate the best two on 5 different processor families and models and on single and multi-core VMs.
We have run our experimental plan on 6 processor architectures, i.e. clusters on Grid’5000 (suno, granduc, stremi, parapluie, petitprince and taurus). The Table 1 shows the physical machines’ characteristics of each cluster.
The raw results of the experiments are available at http://graal.ens-lyon.fr/~jrouzaud/ files/vmcollocated/raw/. The pre-processed data (in csv) of the experiments are available at http://graal.ens-lyon.fr/~jrouzaud/files/vmcollocated/csv.
2
It is available at http://graal.ens-lyon.fr/~jrouzaud/files/vmcollocated/kflops.tgz
3
4.1
Evaluating performance of single VCPU VMs on Intel Xeon
E5-2630
In this section, we study how the performance of a PM is shared between multiple single-VCPU VMs. Moreover, we focus on a single processor architecture, i.e. Intel Xeon E5-2630 and only on the experiments without multi-core VMs.
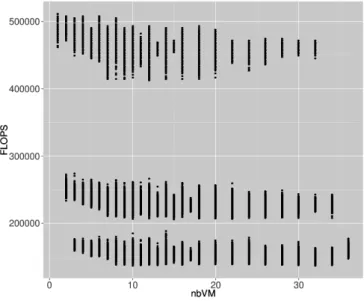
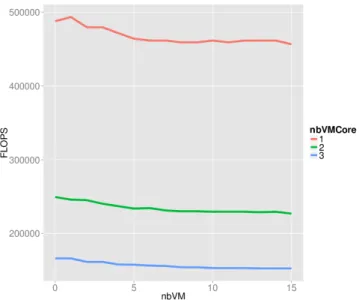
The Figure 1 displays the performance of VM depending on the number of VMs running on the physical machine (PM). By looking at it, one can see that there is 3 different performance behaviors for each value of the number of VMs running on the PM. Furthermore, as we do not consider multi-core VMs in this section, the maximum of VMs per core is 3. Consequently, it can be assume that these 3 behaviors are linked to different number of VMs per core.
Figure 1: Amount of FLOPS for different number of VMs on the PM
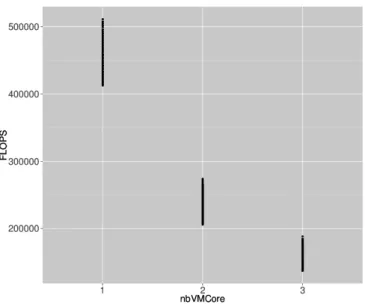
Based on the observation of the Figure 1, we now look on how the number of VMs per core impacts the performance of a VM. Indeed, a classic approach when dealing with multiple VMs on a PM is to think that each core is being fairly shared between the different VCPUs running on it. The Figure 2 shows the amount of FLOPS a VM gets for different number of VMs per core. The figure shows clearer results than the previous one even if there is still performance variations. Consequently, it seems that there is a strong correlation between the number of VMs on a core and the performance of a VM.
To confirm it, we have done a linear regression using the following formula F LOP S= 1
nbV M Core
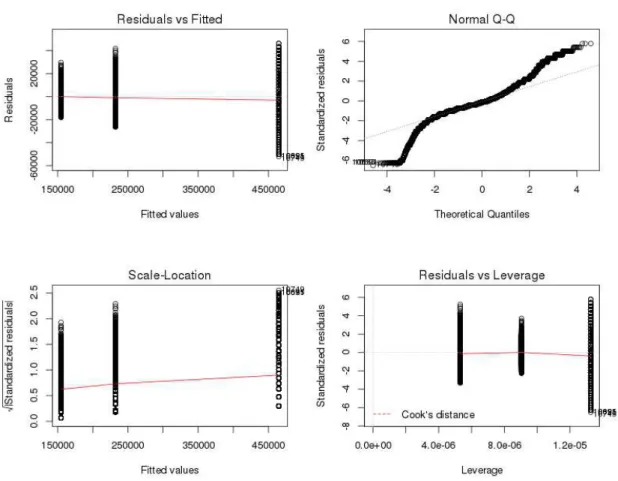
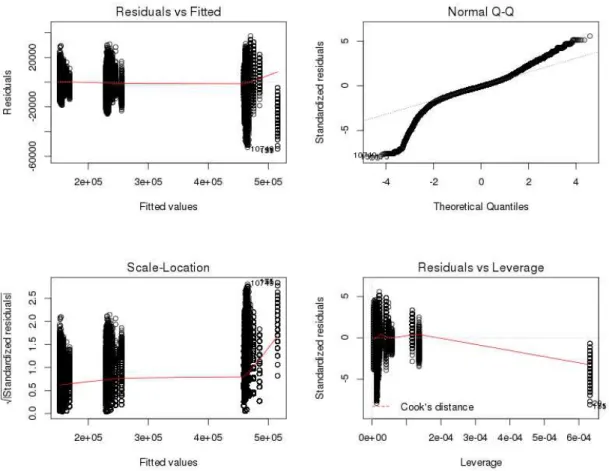
(1) expressing that the amount of FLOPS gets by a VM is correlated with the number of VMs running on the same CPU (nbV M Core). The summary of the linear regression is shown in the Table 2 and the fitness of the regression in the Figure 3. As the R2value is closed to 1 (0.9963),
the correlation between the amount of FLOPS a VM can get and the number of VMs on the core is very strong.
Figure 2: Amount of FLOPS for different number of VMs on a core
Coefficients Estim. Std. Error t value Pr(¿—t—) (Intercept) 10.67 40.82 0.261 0.794 nbVMCore 464633.64 60.57 7671.077 ¡2e-16 Residual standard 7995 on 217461
error degrees of freedom Multiple R-squared 0.9963 Adjusted R-squared 0.9963 p-value ¡ 2.2e-16
F-statistic 5.885e+07 on 1 and 217461 DF
Figure 3: Additional information about the fitness of the linear regression with the number of VMs per core as parameter
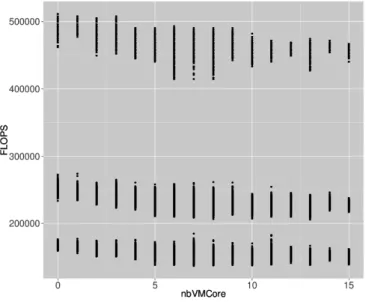
But, we also wanted to know if micro-architectural components, e.g. caches, have an impact on the performance of a VM. For example, does the number of VMs running on the same cell has an impact on the performance of a VM. First, we look at the intra-cell performance impact. The Figure 4 shows the amount of FLOPS a VM gets for different number of VMs in a cell without VMs running on another cell. We find the same 3 behaviors than previously when looking at the scale of the PM.
Figure 4: Amount of FLOPS for different number of VMs on a cell
Nonetheless, it does not mean that the number of VMs on a cell has no impact. As one can see in the Figure 5, the correlation is rather weak but it exists. Indeed, a decrease of performance can be observed when the number of VMs running on other cores but on the same cell increase.
To validate this statement, we have done a linear regression with the following formula F LOP S= 1
nbV M Core+ 1
nbV M Cell (2)
expressing that the amount of FLOPS gets by a VM is correlated with the number of VMs running on the same core (nbV M Core) and the number of VMs running on different cores but on the same cell (nbV M Cell). The summary of the linear regression is shown in the Table 3 and the fitness of the regression in the Figure 6. The R2 value is even closer to 1 (0.9974) than the
one of the previous model. Accordingly, the correlation between the amount of FLOPS a VM can gets, the number of VMs on a core and the number of VMs running on other cores but on the same cell is even stronger than if we just take into account the number of VMs on a core.
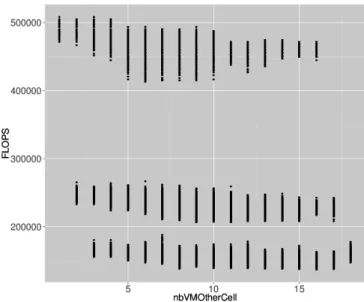
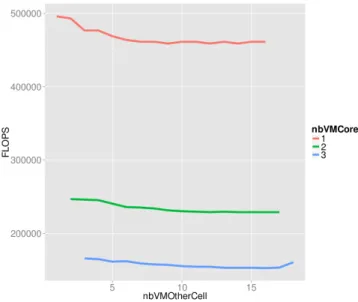
Next, we take a look at the inter-cell performance impact i.e. does the number of VMs running on a cell has an impact on the performance of VMs running on another cell. The Figure 7 shows the amount of FLOPS a VM gets for different number of VMs in the other cells. We find exactly the same 3 behaviors than previously found when looking at the scale of the PM and the cell.
By comparing the Figure 5 and the Figure 9, the impact on performance of the number of VMs on the other cell seems to have an smaller impact than the number of VMs on the same cell but different cores. To validate this statement, we have done a linear regression with the
Figure 5: Amount of FLOPS for different number of VMs on a core and on a cell
Coefficients Estim. Std. Error t value Pr(¿—t—) (Intercept) -4001.33 36.61 -109.3 ¡2e-16 nbVMCorei 459422.44 53.51 8586.2 ¡2e-16 nbVMCelli 59969.89 196.77 304.8 ¡2e-16 Residual standard 6692 on 217460
error degrees of freedom Multiple R-squared 0.9974 Adjusted R-squared 0.9974 p-value ¡ 2.2e-16
F-statistic 4.204e+07 on 2 and 217460 DF
Table 3: Summary of the linear regression with number of VM per core and per cell as parameters following formula
F LOP S = 1
nbV M Core+
1
nbV M OtherCell (3)
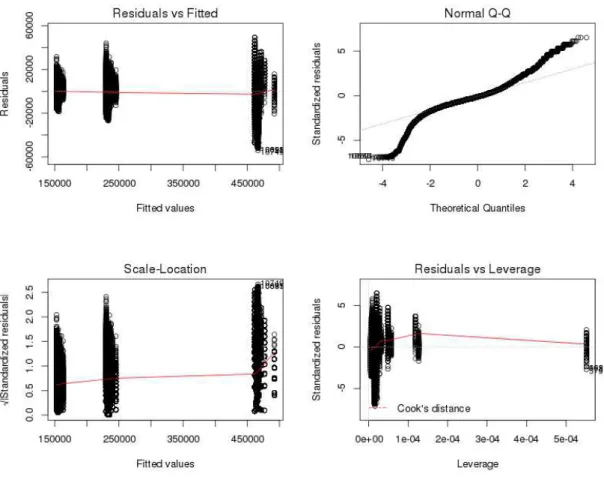
expressing that the amount of FLOPS gets by a VM is correlated with the number of VMs running on the same core (nbV M Core) and the number of VMs running on a different cell (nbV M OtherCell). The summary of the linear regression is shown in the Table 4 and the fitness of the regression in the Figure 8. The R2value (0.9967) is smaller than the one that takes into account the number of VMs on the same cell. Accordingly, it validates our previous statement saying that the number of VMs on the cell is more significant than the number of VMs on another cell.
Figure 6: Additional information about the fitness of the linear regression with number of VM per core and per cell as parameters
Coefficients Estim. Std. Error t value Pr(¿—t—) (Intercept) -1377.12 39.74 -34.66 ¡2e-16 nbVMCorei 462871.17 58.57 7903.25 ¡2e-16 nbVMOtherCelli 30514.24 196.25 155.49 ¡2e-16 Residual standard 7584 on 217460
error degrees of freedom Multiple R-squared 0.9967 Adjusted R-squared 0.9967 p-value ¡ 2.2e-16
F-statistic 3.271e+07 on 2 and 217460 DF
Table 4: Summary of the linear regression with number of VMs per core and per other cells as parameters
Figure 8: Additional information about the fitness of the linear regression with number of VMs per core and per other cell as parameters
We also wanted to evaluate another statement: the performance of a VM is strongly correlated with the number of VMs running on the same core and weakly correlated with the number of VMs running on other cores on the same PM. The Figure 11 illustrates this statement. Accordingly, we modify our formula to
F LOP S= 1
nbV M Core+ 1
nbV M (4)
It expresses that the amount of FLOPS gets by a VM is correlated with the number of VMs running on the same core (nbV M Core) and the number of VMs running on the same PM but different cores (nbV M ). The summary of the linear regression is shown in the Table 5 and the fitness of the regression in the Figure 10. This model has a R2 value (0.9971) that is smaller
than the ones of other models. But, it is easier to use that the ones that take into account cells. Furthermore, it validates our statement stating that the number of VMs on the cell is more significant than the overall number of VMs.
Coefficients Estim. Std. Error t value Pr(¿—t—) (Intercept) -2712.62 38.11 -71.17 ¡2e-16 nbVMCorei 461055.79 56.00 8232.64 ¡2e-16 nbVMi 61668.49 259.09 238.02 ¡2e-16 Residual standard 7121 on 217460
error degrees of freedom Multiple R-squared 0.9971 Adjusted R-squared 0.9971 p-value ¡ 2.2e-16
F-statistic 3.712e+07 on 2 and 217460 DF
Table 5: Summary of the linear regression with number of VMs per core and per PM as param-eters
Finally, based on these knowledge, we propose a more complex formula F LOP S= 1 nbV M Core+ 1 nbV M Cell + 1 nbV M OtherCell (5) that combines the three parameters: the number of VMs on the core, on the related cell and on the other cells. The Figure 13 illustrates this formula. The summary of the linear regression is shown in the Table 6 and the fitness of the regression in the Figure 12. This model has a R2
value (0.9974) that is equal to the one of the simpler model (see formula 2). Furthermore, as one can see in the Table 6, the impact of the number of VMs on other cells is smaller by many orders of magnitude than the two other parameters.
Coefficients Estim. Std. Error t value Pr(¿—t—) (Intercept) -4000.72 36.61 -109.27 ¡ 2e-16 nbVMCorei 459422.04 53.50 8586.56 ¡ 2e-16 nbVMCelli 60580.01 243.57 248.72 ¡ 2e-16 nbVMOtherCelli -910.96 214.36 -4.25 2.14e-05 Residual standard 6692 on 217459
error degrees of freedom Multiple R-squared 0.9974 Adjusted R-squared 0.9974 p-value ¡ 2.2e-16
F-statistic 2.803e+07 on 3 and 217459 DF
Table 6: Summary of the linear regression with number of VM per core, per cell and per other cells as parameters
Figure 10: Additional information about the fitness of the linear regression with number of VMs per core and per PM as parameters
In the table 7, we summarize the different models and give their R2 values. As one can see,
two models have the highest R2 value. The first one is the model that takes into account the
number of VMs on the core and the number of VMs on other cores but on the same cell. The second one is the model that takes into account the number of VMs on the core, the number of VMs on other cores but on the same cell and the number of VMs on other cells. Nonetheless, the first one is simpler to use as it has less parameters.
Figure 11: Amount of FLOPS for different number of VMs on a core and on the PM Model R2 F LOP S =nbV M1 0.08641 F LOP S =nbV M Core1 0.9963 F LOP S =nbV M Cell1 0.1225 F LOP S =nbV M Core1 + 1 nbV M Cell 0.9974 F LOP S =nbV M OtherCell1 0.04483 F LOP S =nbV M Core1 + 1 nbV M OtherCell 0.9967 F LOP S =nbV M Core1 + 1 nbV M Cell+ 1 nbV M OtherCell 0.9974 F LOP S =nbV M Core1 + 1 nbV M 0.9971
Figure 12: Additional information about the fitness of the linear regression with number of VM per core, per cell and per other cell as parameters
Figure 13: Amount of FLOPS for different number of VMs on a core and on the related cell and the other cells
4.2
Validating the models on other processors
In this section, we validate our previous best two models, formula 2 and 5, against experiments that have been executed on different processor families and models.
4.2.1 Intel Xeon E5-2630L
The PMs of the petitprince cluster on Grid’5000 have a quite similar processor architecture (Intel Xeon E5-2630L) than the ones of taurus cluster (Intel Xeon E5-2630). But, they do not have the same processor frequency: taurus (2.3Ghz) and petitprince (2.0Ghz). Apart from it, they are not exactly the same PM. taurus PMs are Dell PowerEdge R720 and petitprince PMs are Dell PowerEdge M620. In this section, we evaluate if the models proposed in the previous section based on experiments run on taurus can be validated with the experiments run on petitprince.
Figure 14: Amount of FLOPS for different number of VMs on a core and on the cell
FLOPS = (1 / nbVMCore) + (1 / nbVMCell) The Figure 14 shows the performance of VMs for different number of VMs on the same core and on different cores but on the same cell. The same kind of behavior than the one observed on taurus, can be seen on petitprince.
We use the model F LOP S = 1 nbV M Core+
1
nbV M Cell to predict performance on petitprince and
compare the result with the observed performance during the experiments (see Figure 15). The Figure 16 shows the margin of errors between the predicted FLOPS and the ones observed during the experiments. As one can see, the margin of error is always between 8 and 14%. We have asked ourself the following question: Would this shift be due to the different processor frequency between taurus (2.3Ghz) and petitprince (2.0Ghz) ? Accordingly, the amount of FLOPS that a VM will have, is not the same.
To evaluate our previous statement, we modify the previous formula to the following one
Figure 15: Amount of FLOPS as predicted by F LOP S = nbV M Core1 + 1
nbV M Cell (triangle) and
amount of FLOPS from experiments run on petitprince (circle)
Figure 16: Accuracy of the predicted FLOPS from the ones get by experimentation on petitprince
predictedF LOP S × petitprinceF LOP SnbV M Cell=1 nbV M Core=1
taurusF LOP SnbV M Cell=1 nbV M Core=1
(7)
where petitprinceF LOP SnbV M Cell=1
nbV M Core=1 and taurusF LOP SnbV M Cell=1nbV M Core=1 represent the amount of FLOPS
a VM alone on a core and on a cell can have on respectively a petitprince PM and a taurus one. The result of this transformation is shown in the Figure 17. As one can see, the formula is removing the shift we have observed previously. As for taurus, the margin of error is of few percents in most of case and never more than 5%.
Figure 17: Accuracy of the rectify predicted FLOPS from the ones get by experimentation on petitprince
To conclude this section, we propose the following updated model:
F LOP S= (8)
(nbV M Core1 + 1
nbV M Cell) ∗ T GT P rocF LOP SnbV M Cell=1 nbV M Core=1
SRCP rocF LOP SnbV M Cell=1 nbV M Core=1
(9) where T GT P roc is the processor which we want to predict the performance and SRCP roc is the processor from which we have built the model. Thank to this model, by running an experiment with only one VM on a single core during 4 minutes on a new platform, you can predict the performance a VM will have for all the different number of VMs per each CPU on this platform. FLOPS = (1 / nbVMCore) + (1 / nbVMCell) + (1 / nbVMOtherCell) We also wanted to test the more complex model to see if the margin of error can be reduced. As for the previous model, we rectify it to take into account the difference of the amount of FLOPS between processors. The result is shown in the Figure 18. As one can see, the prediction is not improved by the more complex model. On the contrary, in most of the cases, the margin of errors is slightly larger than with the simpler model. This can be due to different way of handling inter-cell interferences between processors.
Figure 18: Accuracy of the rectify predicted FLOPS from the ones get by experimentation on petitprince with the complex model
4.2.2 Other processors
In this section, we focus on the rectified model (see formula 8) as it is simpler and has been shown to be more accurate than the more complex one. The Figure 19 shows the margin of error between predicted FLOPS and real one observed during experiments for 4 different processors. The margin of error is never more than 8% for parapluie, 4% for granduc, 7.2% for suno and 8% for stremi. Accordingly, we can use our model to accurately predict the performance of a VM on different processor models of the same family, i.e. Intel processors. Furthermore, using the same model, we can predict the performance of a VM on processors from another family, i.e. AMD processors. Consequently, we have shown that our model is generic and not sensitive to the architecture of the processor or of the PM.
(a) Accuracy of the predicted FLOPS from the ones get by experimentation on granduc
(b) Accuracy of the predicted FLOPS from the ones get by experimentation on suno
(c) Accuracy of the predicted FLOPS from the ones get by experimentation on parapluie
(d) Accuracy of the predicted FLOPS from the ones get by experimentation on stremi
Figure 19: Accuracy of the predicted FLOPS from the ones get by experimentation on 4 different processors
4.3
Validating the model on multi-core VMs
Nowadays, most VMs do not use a single VCPU but a set of VCPUs. Accordingly, we want to evaluate if the model we proposed is also accurate for multi-core VMs. The Figure 20 shows the margin of error between predicted FLOPS and real one observed for multi-core VMs on taurus and petitprince. The margin of error is never more 8.3% for petitprince and 4% for taurus. Consequently, the multi-core VMs are behaving in the same way that single core VMs. Therefore, our model can be used for either single and multi core VMs with the same accuracy.
(a) Accuracy of the predicted FLOPS for multi-core VMs from the ones get by experimentation on taurus
(b) Accuracy of the predicted FLOPS for multi-core VMs from the ones get by experimentation on petitprince
Figure 20: Accuracy of the predicted FLOPS for multi-core VMs from the ones get by experi-mentation on 2 different processors
5
Conclusion
As we have shown, it is critical to study the impact on performance of collocated VMs. But most of virtualized platforms and Clouds simulators focus on a simple model that only takes into account the number of VMs on a given PM to predict the performance. We have shown that these models are no more accurate on multi-core PMs with multiple collocated VMs. Nonetheless, existing accurate simulators for multi-core physical machines are complex and do not scale. Indeed, when simulating a Cloud, it is required to simultaneously simulate tens of thousands of PMs. Accordingly, these accurate but complex simulators and their related models do not fit our needs.
Through in-depth experiments, we have shown that by taking into account the number of VMs on a core and the number of VMs on different cores but on the cell, i.e. VMs that share caches or NUMA nodes, we can improve the performance prediction. Accordingly, we have proposed 8 performance models and select the best one (accurate and lightweight) that takes into account the number of VMs on a core and the number of VMs on the related cell but on different cores. Then we have validated it on different processor families and models. Furthermore, we have also validated our model on multi-virtual-CPU VMs. We have shown that our model can predict the performance of a VM with a margin of error of at most 9%. Consequently, we are almost as accurate as complex models are but with a lightweight model.
In the future, we will implement this model on top of SimGrid. By doing so, we will improve the accuracy of the simulation run on top of SimGrid [5]. Moreover, in this paper, we have focus on a compute-intensive benchmark. In the future, we will evaluate the accuracy of our model with different benchmarks but also with full applications.
Acknowledgment
This work is partially supported by ANR (Agence National de Recherche), project reference ANR 11 INFRA 13 (SONGS).
Experiments presented in this paper were carried out using the Grid’5000 experimental testbed, being developed under the INRIA ALADDIN development action and the INRIA large-scale initiative Hemera, with support from CNRS, RENATER and several Universities as well as other funding bodies (see https://www.grid5000.fr).
References
[1] P. Apparao, R. Iyer, and D. Newell. Towards modeling & analysis of consolidated cmp servers. SIGARCH Comput. Archit. News, 36(2):38–45, May 2008.
[2] R. Bergamaschi, I. Nair, G. Dittmann, H. Patel, G. Janssen, N. Dhanwada, A. Buyukto-sunoglu, E. Acar, G.-J. Nam, G. Han, D. Kucar, P. Bose, and J. Darringer. Performance modeling for early analysis of multi-core systems. In Hardware/Software Codesign and Sys-tem Synthesis (CODES+ISSS), 2007 5th IEEE/ACM/IFIP International Conference on, pages 209–214, 2007.
[3] R. N. Calheiros, R. Ranjan, A. Beloglazov, C. A. F. De Rose, and R. Buyya. CloudSim: A Toolkit for Modeling and Simulation of Cloud Computing Environments and Evaluation of Resource Provisioning Algorithms. Softw. Pract. Exper., 41(1):23–50, Jan. 2011.
[4] J. Cartlidge and D. Cliff. Comparison of Cloud Middleware Protocols and Subscription Network Topologies using CReST, the Cloud Research Simulation Toolkit. In Procs of the 3rd International Conf. on Cloud Computing and Services Science (CLOSER-2013), May 2013.
[5] H. Casanova, A. Legrand, and M. Quinson. SimGrid: a Generic Framework for Large-Scale Distributed Experiments. In Proceedings of the Tenth International Conference on Computer Modeling and Simulation, UKSIM ’08, pages 126–131, Washington, DC, USA, 2008. IEEE Computer Society.
[6] A. M. Dani, K. Varadarajan, B. Amrutur, and Y. N. Srikant. Accelerating multi-core simulators. In Proceedings of the 2010 ACM Symposium on Applied Computing, SAC ’10, pages 2377–2382, New York, NY, USA, 2010. ACM.
[7] F. Desprez and J. Rouzaud-Cornabas. SimGrid Cloud Broker: Simulating the Amazon AWS Cloud. Rapport de recherche RR-8380, INRIA, Nov. 2013.
[8] W. Emeneker and A. Apon. Cache effects of virtual machine placement on multi-core processors. In Computer and Information Technology (CIT), 2010 IEEE 10th International Conference on, pages 2261–2266, 2010.
[9] J. Han, J. Ahn, C. Kim, Y. Kwon, Y.-R. Choi, and J. Huh. The effect of multi-core on hpc applications in virtualized systems. In Proceedings of the 2010 Conference on Parallel Processing, Euro-Par 2010, pages 615–623, Berlin, Heidelberg, 2011. Springer-Verlag. [10] T. Hirofuchi, A. L`ebre, and L. Pouilloux. Adding a Live Migration Model Into SimGrid,
One More Step Toward the Simulation of Infrastructure-as-a-Service Concerns. In 5th IEEE International Conference on Cloud Computing Technology and Science (IEEE CloudCom 2013), Bristol, Royaume-Uni, Dec. 2013.
[11] Q. Huang and P. P. Lee. An experimental study of cascading performance interference in a virtualized environment. SIGMETRICS Perform. Eval. Rev., 40(4):43–52, Apr. 2013. [12] M. Imbert, L. Pouilloux, J. Rouzaud-Cornabas, A. L`ebre, and T. Hirofuchi. Using the
EXECO toolbox to perform automatic and reproducible cloud experiments. In 1st Inter-national Workshop on UsiNg and building ClOud Testbeds (UNICO, collocated with IEEE CloudCom 2013, Bristol, Royaume-Uni, Sept. 2013.
[13] D. Kliazovich, P. Bouvry, and S. Ullah Khan. GreenCloud: A Packet-Level Simulator of Energy-Aware Cloud Computing Data Centers. The Journal of Supercomputing, 62(3):1263– 1283, Dec. 2012.
[14] R. McDougall and J. Anderson. Virtualization performance: Perspectives and challenges ahead. SIGOPS Oper. Syst. Rev., 44(4):40–56, Dec. 2010.
[15] A. Nunez, J. Vazquez-Poletti, A. Caminero, G. Castan´e, J. Carretero, and I. Llorente. iCan-Cloud: A Flexible and Scalable Cloud Infrastructure Simulator. Journal of Grid Computing, 10(1):185–209, 2012.
[16] A. Patel, F. Afram, S. Chen, and K. Ghose. Marss: A full system simulator for multicore x86 cpus. In Design Automation Conference (DAC), 2011 48th ACM/EDAC/IEEE, pages 1050–1055, 2011.
[17] V. Varadarajan, T. Kooburat, B. Farley, T. Ristenpart, and M. M. Swift. Resource-Freeing Attacks: Improve your Cloud Performance (At your Neighbor’s Expense). In Proceedings of the 2012 ACM conference on Computer and communications security, CCS ’12, pages 281–292, New York, NY, USA, 2012. ACM.
Inovallée BP 105 - 78153 Le Chesnay Cedex inria.fr