Publisher’s version / Version de l'éditeur:
Proceedings 15th International Conference on Port and Ocean Engineering under Arctic Conditions, POAC'99, 2, pp. 687-696, 1999-08-23
READ THESE TERMS AND CONDITIONS CAREFULLY BEFORE USING THIS WEBSITE.
https://nrc-publications.canada.ca/eng/copyright
Vous avez des questions? Nous pouvons vous aider. Pour communiquer directement avec un auteur, consultez la
première page de la revue dans laquelle son article a été publié afin de trouver ses coordonnées. Si vous n’arrivez pas à les repérer, communiquez avec nous à [email protected].
Questions? Contact the NRC Publications Archive team at
[email protected]. If you wish to email the authors directly, please see the first page of the publication for their contact information.
NRC Publications Archive
Archives des publications du CNRC
This publication could be one of several versions: author’s original, accepted manuscript or the publisher’s version. / La version de cette publication peut être l’une des suivantes : la version prépublication de l’auteur, la version acceptée du manuscrit ou la version de l’éditeur.
Access and use of this website and the material on it are subject to the Terms and Conditions set forth at
The Local Pressure-Area Relation in Ship Impact with Ice. Frederking, Robert
https://publications-cnrc.canada.ca/fra/droits
L’accès à ce site Web et l’utilisation de son contenu sont assujettis aux conditions présentées dans le site
LISEZ CES CONDITIONS ATTENTIVEMENT AVANT D’UTILISER CE SITE WEB.
NRC Publications Record / Notice d'Archives des publications de CNRC: https://nrc-publications.canada.ca/eng/view/object/?id=eeec6e4c-d52d-4302-8159-97dae3921743 https://publications-cnrc.canada.ca/fra/voir/objet/?id=eeec6e4c-d52d-4302-8159-97dae3921743
Proceedings 15th International Conference on Port and Ocean Engineering under Arctic Conditions, POAC’99, Vol.2, pp 687-696, Helsinki, Finland, August 23-27, 1999.
POAC 99
The Local Pressure-Area Relation in Ship Impact with Ice R. Frederking
Canadian Hydraulic Centre National Research Council Ottawa, Ontario Canada K1A 0R6 ABSTRACT
The relation between pressure and area is used to describe various ice-ship interaction processes. Two types of pressure-area relations have been defined. One pressure-area relation describes the process of ship penetration into an ice feature. The other pressure-area relation describes the spatial distribution of pressure at an instant in time. The extensive local pressure data from the Louis S. St. Laurent and the Oden provide useful insights into the nature of pressure-area relations. The cases examined in this paper show that even though the two types of relations demonstrate similar trends of decreasing pressure with increasing area, they are quite different in nature. More examination of data in the context of the process pressure-relation is required before generalizations can be made. There is adequate data for describing the spatial distribution of local pressure as a function of area. 1. INTRODUCTION
The pressure-area relation has been used as a means of describing various types of ice loading data. A pattern of decreasing ice pressure with increasing contact area has emerged, sometimes referred to as the pressure-area effect. Daley et al (1985) analysed data from hull instrumentation of the USCGC Polar Sea to determine pressures on a range of hull areas. The 9-m2 instrumented area was comprised of 60 elements, each 0.15 m2 in area, and a trend of higher pressures for smaller areas was observed. Sanderson (1988) made a comprehensive compilation of many data and presented pressure-area data for areas from 10-4 m2 to 106 m2. More recently Masterson and Frederking (1993) collected data in the context of local ice loads, covering areas ranging from 10-1 m2 to 102 m2. From these reported data, two fundamentally different types of pressure-area relations are identified. One describes the change in average pressure as a function of contact area during an impact, for example a ship ramming a large ice feature (Riska, 1987). This has been termed a process pressure area relation by Frederking (1998). The other pressure-area relation describes the average pressure on sub-areas of various sizes within a larger area at an instant in time during an impact. This is the type of pressure-area relation presented by Daley et al (1985) and referred to by Jordaan et al (1993) as pressure on local areas within a global area. It is proposed that this be termed a spatial distribution pressure-area relation.
More data are becoming available on temporal and spatial distributions of local loads during impact of ships with ice. Recently the Louis S. St. Laurent and the Oden were instrumented to measure hull response to ice loads. The instrumented areas were of the order of 20 m2 and local loads over 30 to 40 elements within this area were measured. The areas were large enough and the number of elements sufficient that information on the nature of the ice contact area and the pressure distribution within it could be determined. This paper will examine the time series of some examples of these data, the pressure-area relation during the course of a few selected
impacts, and the distribution of pressures within the contact patch to demonstrate the type of information that can be extracted from these data.
2. DESCRIPTION OF THE MEASUREMENTS
The data used in the analysis are from summer transits made to the North Pole by the Oden in 1991 and the St. Laurent in 1994. Both ships had areas of the hull instrumented with strain gauges to allow the local ice load to be measured. The technique used was to measure shear strain at a number of locations along a frame and relate load to shear strain difference. The measurement programs are described in more detail in St. John and Minnick (1993) and Ritch et al (1997).
The two ships are quite different in bow form. The Louis S. St. Laurent has a conventional ice breaking bow, while the Oden has a low stem angle landing craft bow form. The characteristics of the hull form at the centre of instrumented area for each ship are summarized in Table 1. Note that the measured forces are normal to the hull surfaces defined in the table.
Table 1 Hull form in area of local load measurement instrumentation
Ship Waterline angle (deg) Frame angle (deg) Buttock angle (deg)
Louis S. St. Laurent 22 35.5 30
Oden 90 90 20
Time series records of the local pressures were recorded for a number of impact events at a rate of 50 Hz in the case of the Oden and 100 Hz for the Louis S. St. Laurent. Additionally, information on ice conditions, nature of impact and ship speed were documented.
2.1 Louis S. St. Laurent
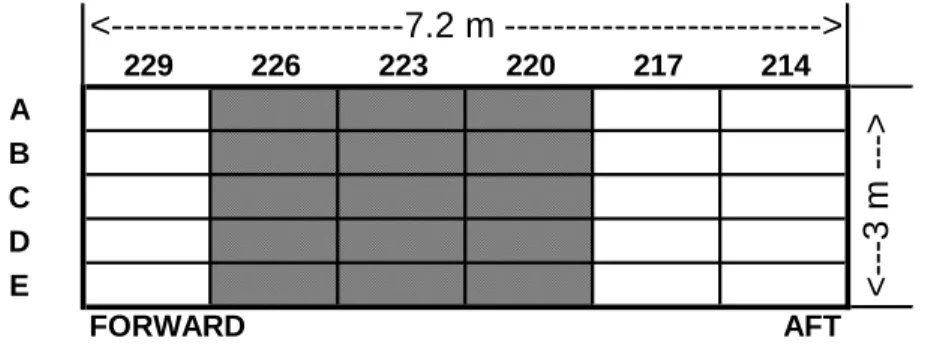
An area 7.2-m long by 3 m high just below the water line, and approximately midway between the stem and the shoulder, was instrumented on the Louis S. St. Laurent. The top of this area is about 0.75 m below the waterline. Six frames were instrumented (see Figure 1). For the forward frame (229) and the two aft frames, only the top and bottom were strain gauged so the total force over a 3 m height of the frame was determined; however, for each of the middle three frames (shown shaded in Figure 1) four additional gauges were equally spaced so that loads over five 600 mm high sub-panels could be determined. An extrapolation routine was used to generate sub-panel loads for the frames that only had strain gauges at the top and bottom. Average pressures on an array of 30 sub-panels were available for analysis.
Figure 1 Location of instrumented sub-panels on Louis S. St. Laurent; frame numbers at top, levels noted at left, each sub-panel 1200 mm wide by 600 mm high.
229 226 223 220 217 214 A B C D E FORWARD AFT <---7.2 m ---> <---3 m --->
2.2 Oden
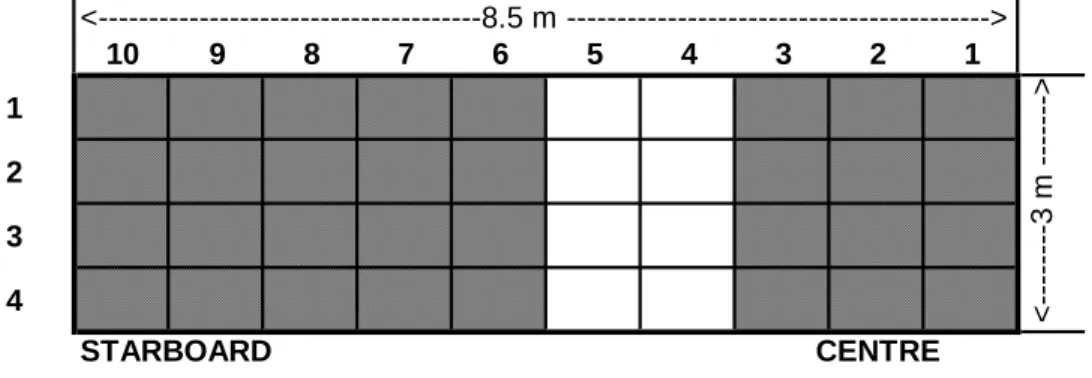
The instrumented area on the bow of the Oden was 8.5 m wide by 3 m high and the water line was near the top of the first row of sub-panels. Strain gauges were installed on eight longitudinal frames so that local load could be measured on a total of 32 sub-panels, each 850 mm wide and 770 mm high. Knowing the load, and the area of each panel, local average pressures were determined. Three columns of sub-panels surrounding the centre frames and five columns of sub-panels on outboard frames were instrumented, see shaded areas in Figure 2. To fill in the area that was not instrumented, pressures were synthesized by linear interpolation from adjacent panels. Thus average pressure for 40 sub-panels were available. The hull girder was strain gauged near the bow to independently measure the total load on the bow.
Figure 2 Location of instrumented sub-panels on Oden; horizontal position numbers at top, levels at left; each sub-panel 850-mm wide by 770 mm high.
3. PRESSURE-AREA RELATIONS DURING AN IMPACT
Impact of a vessel with an ice feature can be described in simplest terms by a force-time record. This force could be a global bow force as in the case of the Oden, or a local load as determined by summing the panel loads on the instrumented areas. In other trials the hull girder was instrumented to give a bow force. With a knowledge of the geometry of the bow, the ice edge and ship motion, an assumed contact area can be determined as a function of time (Riska, 1987). Combining the bow force and contact area, a process pressure area relation can be developed to describe the impact process. An example of this type of analysis was given in Frederking (1998), and showed a trend of decreasing average pressure with increasing contact area during an impact. Most analysis of pressure area process data only considered the area, not the shape of the area. Iyer (1983) has demonstrated that the shape of the contact area or aspect ratio can influence failure pressures too. The instrumented areas on the Louis S. St. Laurent and the Oden provide an opportunity to examine the pressure-area relation and shape of the contact area for ship impacts.
3.1 Louis S. St. Laurent
Several thousand impacts were measured for various ice conditions and ship velocities during the 1994 polar transit voyage. The results of a few select glancing impacts with an ice feature will be presented here. Total force on the instrumented area is determined by summing the force on each sub-panel. Note that this is not necessarily the total force on the bow since ice forces could be acting on sub-panels outside the instrumented area. Nevertheless, the forces so determined are of use in studying impacts. A total of six impacts were examined, three for ice thickness in the range 1 to 2 m
10 9 8 7 6 5 4 3 2 1 S 1 S 2 S 3 S 4 STARBOARD CENTRE <---8.5 m ---> <---3 m --->
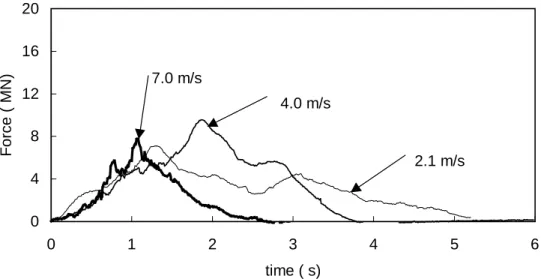
and three for thickness in the range 4 to 5 m. Figure 3 presents time series of the thinner ice impacts at three different velocities. No significant velocity effect was noted on the maximum force attained, however the duration of the impact was longer at lower velocities. The loading rate was about the same for all three velocities, about 5 MN/s. Also noteworthy is the symmetric nature of the force time records, that is, the unloading portion takes about as much time as the loading portion. This suggests that there is significant elastic energy in these impacts.
Figure 3 Louis S. St. Laurent, glancing impacts on 1-2 m thick ice.
The nature of the impacts on thicker ice was significantly different, as shown in Figure 4. Firstly the loading rate was much higher, about 40 MN/s for higher velocities and 15 MN/s for 1.4 m/s. The unloading rate was also higher, and thus the impact durations were much shorter. Secondly, the impact forces were higher. In the case of thicker ice, the force time records did not show symmetry in the loading and unloading portions.
Figure 4 Louis S. St. Laurent, glancing impacts on 4-5 m thick ice.
Since forces on each sub-panel were measured, the number of sub-panels experiencing load, and the magnitude of that load could be easily determined at each instant of time. By counting the number of sub-panels experiencing a load a contact area can be determined. With the actual contact area, and the corresponding total force on the instrumented area, an average pressure can be determined. Thus, at successive time steps, an average pressure and an area can be determined and a process pressure-area curve generated. The contact area could be defined as being all sub-panels
0 4 8 12 16 20 0 1 2 3 4 5 6 time ( s) F o rce ( MN) 4.0 m/s 2.1 m/s 7.0 m/s 0 4 8 12 16 20 0 1 2 3 4 5 6 time (s) Force, MN 1.4 m/s 3.8 m/s 5.4 m/s
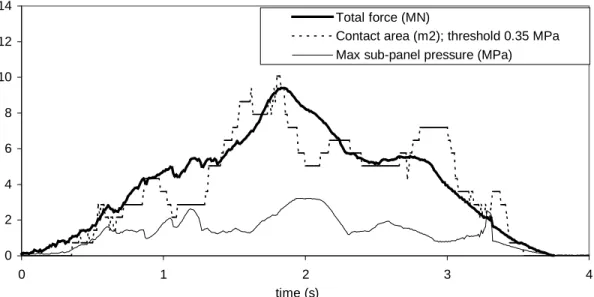
with a load greater than zero, but this would give excessively low average pressures. To obtain a more realistic estimate of contact area, only those sub-panels experiencing a load greater than some threshold value are considered. The actual contact area and hence average pressure is dependent on the threshold value. Selecting a higher threshold reduces the area and thus increases the average pressure. An example, but not necessarily typical, plot of a total force, contact area and maximum sub-panel pressure as a function of time is presented in Figure 5 for an impact of 4 m/s on 1 to 2 m thick ice (one of the cases in Figure 3). It can be seen that the contact area generally tracks the total force. It has a stepped nature since the area changes in integer increments of sub-panel size (0.72 m2). In this instance a threshold pressure of 0.35 MPa has been selected in generating the contact area. The maximum contact area was about 10 m2 in this case. Figure 5 also shows the maximum sub-panel pressure, which is the maximum sub-panel pressure anywhere within the measurement area at that instant of time. The largest individual sub-panel pressure during this impact is about 3 MPa. The largest maximum sub-panel pressures measured for the other impact velocities on 1-2 m thick ice were similar.
Figure 5 Total force, contact area and maximum sub-panel pressure as a function of time for Louis S. St. Laurent impact at 4 m/s against 1-2 m thick ice.
The results of calculating average pressure as a function of contact area for the same conditions as in Figure 5 are plotted to produce a pressure-area relation for the impact (see Figure 6). The lines connecting the plotted points are added to show the time sequence of the data. A characteristic trend of decreasing pressure with increasing contact area is seen. Similar trends were observed for M.V. Arctic rams, and Pond Inlet iceberg and Ice Island multi-year ice impact tests (Masterson and Frederking, 1993). The pressure-area plot of Figure 6 differs from the M.V. Arctic rams in that in this case there is both a loading part and an unloading part to the global load. The loading part starts at an average pressure of just under 2.5 MPa on an area of 0.72 m2, and descends to an average pressure of about 1 MPa on an area of 10 m2, and the unloading part returns to an average pressure of about 1.5 MPa on 0.72 m2. Similar behaviour was observed on the other two impacts on 1-2 m thick ice and low speed impact on 4-5 m thick ice. For the case of the thick ice impacts at 5.4 m/s, the trend of decreasing average pressure with increasing contact area was not evident (see analysis in Frederking, 1998). 0 2 4 6 8 10 12 14 0 1 2 3 4 time (s) Total force (MN)
Contact area (m2); threshold 0.35 MPa Max sub-panel pressure (MPa)
Figure 6 Pressure vs. area for Louis S. St. Laurent impact at 4.0 m/s against 1-2 m thick ice; 0.35 MPa threshold pressure.
Time series records of sub-panel pressures can be examined to obtain an appreciation of the similarity or difference between pressures on adjacent sub-panels. Figure 7 plots sub-panel pressures for three adjacent frames at level C for the same loading event already presented in Figure 5. Note that each trace represents the average pressure on the 1.2-m width of a sub-panel. A sweeping action in the pressure is apparent with frame 226 experiencing a peak pressure first, followed by frames 223 and 220. Note that frame 226 has no pressure on it by the time frame 220 is experiencing its peak.
Figure 7 Sub-panel pressures for three horizontally adjacent frames at level C for 4.0 m/s impact by Louis S. St. Laurent on 1-2 m thick ice.
0 0.5 1 1.5 2 2.5 0 2 4 6 8 10 12 area (m2)
average pressure (MPa)
Threshold pressure (MPa) 0.35
loading unloading -500 0 500 1000 1500 2000 2500 3000 3500 0 1 2 3 4 time (s) sub-panel pr essur e ( k P a ) frame 226 frame 223 frame 220
3.2 Oden
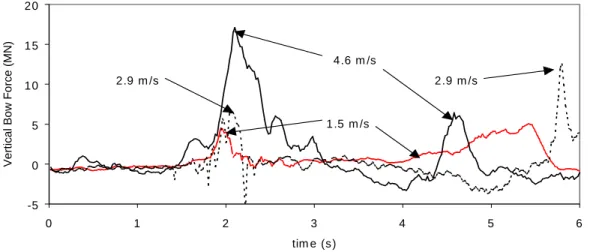
The Oden conducted a transit to the North Pole in late summer 1991 and recorded about 800 impact events. Information on the ice conditions and vessel speed for each event were documented. The time series of total vertical bow force (based on hull girder strain) for impact at three different velocities on old ice about 4 m thick are presented in Figure 8. The magnitude of the bow forces are equivalent to those of the Louis S. St. Laurent (see Figure 3). There is a trend of increasing maximum bow force with increasing velocity for the three cases presented here. The loading rate for the conditions of thick ice is about 50 MN/s, and does not depend on velocity. The force-time record for each impact is symmetric, having an unloading rate comparable to the loading rate.
Figure 8 Total vertical bow force on Oden for impacts at various speeds on 4 m thick ice.
Using the force measurements from the sub-panels, the total force on the instrumented part of the bow and the actual contact area were determined. Process pressure-area curves were generated for a number of impact cases, but no consistent pattern emerged.
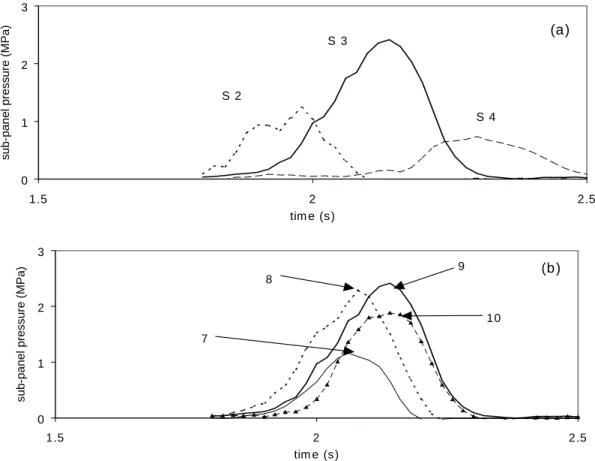
The time series of sub-panels pressures were examined to provide some insight into the nature of local pressures during an impact. Figure 9 is a time expansion of a 1-second portion of sub-panel pressures for the case of the 2.9 m/s impact on 4 m thick ice (case plotted in Figure 8). Pressures on three vertically adjacent panels at levels S 2, S 3 and S 4, and centered over position 9 (see Figure 2 for locations) are plotted Figure 9(a). Note that because of the 20o slope of the bow of the Oden, it would be more correct to speak of a horizontal distribution in the longitudinal direction; levels S 1 to S 4 are successively further aft. A sequence of peak pressures for each sub-panel in the longitudinal direction is evident. At the instant of maximum pressure on the sub-panel at level S 3, there is no pressure on either S 2 or S 4. Remembering that each sub-panel is 770 mm high, this gives some indication of the height of the loading patch. Figure 9(b) plots the pressures from four horizontally adjacent (in the lateral direction) sub-panels (at level S 3 for locations 7, 8, 9 and 10; see Figure 2 for actual positions). While not plotted in Figure 9(b), the sub-panel at location 6 level S 3 had no pressure on it during this part of the event. It can be seen that all four sub-panels respond in a fairly simultaneous fashion. The pressures are higher in the centre, locations 8 and 9, and at any point in time act on at least 3, and sometimes 4 sub-panel widths, equivalent to 2.5-m to 3.5-m width. This implies that in this instance the pressure patch is quite elongated, that is about 3 m wide by 0.8 m high. This would correspond to an aspect ratio of about 4:1.
-5 0 5 10 15 20 0 1 2 3 4 5 6 tim e (s ) V e rt ica l B o w Fo rce (MN) 4.6 m /s 2.9 m /s 2.9 m /s 1 .5 m /s
0 1 2 3 1.5 2 2.5 tim e (s) s ub-panel pr es s u re ( M Pa) S 2 S 4 S 3 (a) 0 1 2 3 1.5 2 2.5 tim e (s ) s ub-panel pr es s ur e ( M Pa) 8 9 10 7 (b )
Figure 9 Sub-panel pressures as a function of time for Oden impact at 2.9 m/s on 4-m thick ice; (a) vertically adjacent sub-panels, (b) horizontally adjacent sub-panels.
4. SPATIAL DISTRIBUTION OF PRESSURES
The nature of the instrumentation of the bow section of the Oden and Louis S. St. Laurent allows the spatial distribution of pressure within the contact area to be examined. Pressures on each sub-panel are known at any instant in time. By grouping the output of adjacent sub-panels in various combinations, average pressures on areas of increasing size can be determined. From these calculated data, a spatial distribution of pressure as a function of area can be determined. The grouping can be done both in terms of area and shape of the sample area. This spatial distribution of pressure as a function of area is what is required for design of local ship structure.
The instrumented bow area of the Louis S. St. Laurent was divided into 30 sub-panels, each of area 0.72 m2. Two vertically adjacent sub-panels can be grouped to make a new panel of area 1200 mm by 1200 mm. A group of four sub-panels, two horizontally adjacent and two vertically adjacent is the next grouping (area 2.88 m2). Further groupings were 2 across and 3 down, 3 across and 3 down and 3 across and 4 down, for areas 4.32 m2, 6.48 m2 and 8.64 m2, respectively. These contiguous areas were swept across the instrumented area, so that in addition to the 30 single sub-panel pressures, there were 24, 20, 15, 12 and 8 average pressures, respectively, for the other groupings. For each grouping an extreme value (mean + 3 standard deviations) and the maximum value were determined. Average pressures as a function of area are plotted in Figure 10. A trend of decreasing average pressure with increasing area is obtained. The equation of the best-fit line through the extreme pressure data is
where p is pressure in MPa and A is contact area in m2. This equation is similar to the ones reported in Riska (1987) and Masterson and Frederking (1993).
Figure 10 Spatial distribution pressure-area relation for Louis S. St. Laurent impact at 4 m/s on 1-2 m thick ice (at time 1-2.07 s in Figure 5).
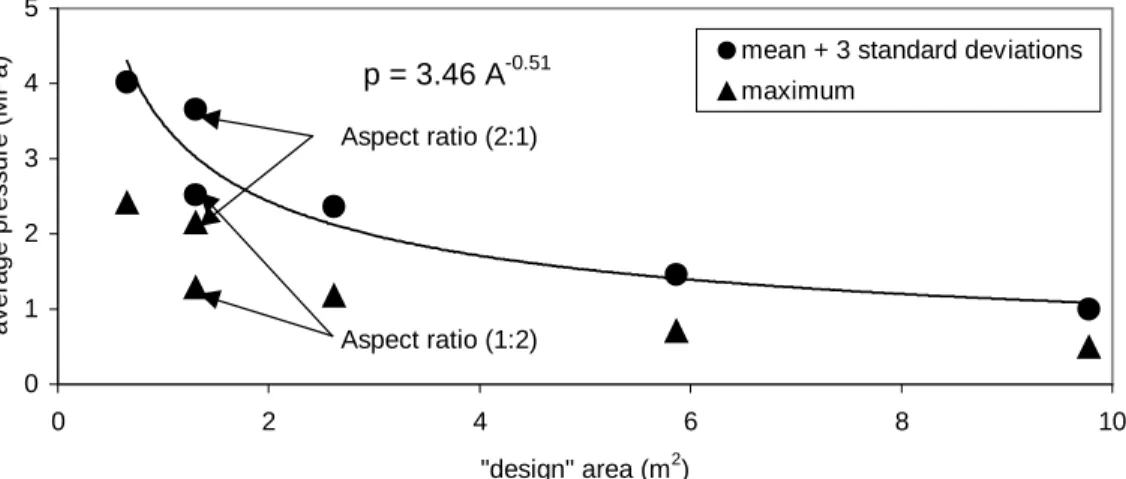
A similar analysis was carried out on data from an Oden impact. The Oden had 40 instrumented sub-panels, and arranged in an array 10 wide by 4 high. The smallest measurement area was 0.65 m2. Groupings of 2, 4, 9 and 15 contiguous panels were selected in addition to the single sub-panels to obtain average pressures on various areas. Horizontal and vertical arrangements of two sub-panels allowed aspect ratio affect to also be examined. The results of the calculations on an Oden impact are presented in Figure 11. The two groupings of two sub-panels showed a higher average pressure for the horizontal arrangement (aspect ratio 2:1) than the vertical one (aspect ratio 1:2). The Oden data also demonstrated a decreasing spatial distribution of pressure with area. Note that the data of Figures 10 and 11 and the best fit curves are only presented here for illustrative purposes and should not be used for design as they stand.
Figure 11 Spatial distribution pressure-area relation for Oden impact at 2.9 m/s on 4 m thick ice (at time 2.14 s in Figure 9).
p = 2.35 A-0.42 0.0 0.5 1.0 1.5 2.0 2.5 3.0 3.5 0 2 4 6 8 10 "design" area (m2)
average pressure (MPa)
mean + 3 standard deviations maximum p = 3.46 A-0.51 0 1 2 3 4 5 0 2 4 6 8 10 "design" area (m2)
average pressure (MPa)
mean + 3 standard deviations maximum
Aspect ratio (2:1)
5.0 SUMMARY AND CONCLUSIONS
Pressure-area plots have been used as a means of generalizing ships impacting with ice. An inverse relation of high pressures for small areas and low pressures on large areas has generally characterized the nature of local ice pressures on ships. It has been observed that one pressure-area relation describes the process of ship penetration into an ice feature, and the other pressure-area relation describes the spatial distribution of pressure in the contact area at an instant in time. For a number of glancing impacts of the Louis S. St. Laurent, a trend of decreasing pressure with increasing area was observed, however more impacts have to be analysed before a general process pressure-area relation can be proposed.
Data on sub-panel pressures provide information on the contact area shape, indicating that it is elongated in the horizontal or lateral direction. The spatial distribution pressure-area relation extracted from the data and shows a consistent trend of decreasing pressure with increasing area. Aspect ratio effects can also be determined. This paper show that insights can be extracted from the data, but many more events will have to be analysed before there are results suitable for design. 6.0 ACKNOWLEDGEMENTS
The work reported here was done in support of the Polar Code. The support of Prairie and Northern Region, Transport Canada and the interest of Victor Santos-Pedro is acknowledged.
7.0 REFERENCES
Daley, C., St. John, J.W., Seibold, F, and Bayly, I. 1985. Analysis of extreme ice loads and pressures on USCGC Polar Sea, SNAME Annual Meeting, November 1984, Paper No. 8 Frederking, R. 1998. The pressure area relation in the definition of ice forces, 8th Int. Offshore and
Polar Engineering Conference, May 24-29, 1998, Montreal, Vol. II, pp. 431-437.
Iyer, S.H. 1983. Size effects in ice and their influence on the design of offshore structures. Proceedings of POAC ’83, 7th Int. Conf. on Port and Ocean Engineering under Arctic Conditions, April 5-9, 1983, Helsinki, VTT Symposium 37 vol. 3, pp.414-432.
Jordaan, I.J., Maes, M.A., Brown, P.A. and Hermans, I.P. 1993. Probabilistic analysis of local ice pressures, Journal of Offshore and Arctic Engineering, ASME Vol. 115, pp. 83-89.
Masterson, D.M. and Frederking, R. 1993. Local contact pressures in ship/ice and structure/ice interactions, Cold Regions Science and Technology, Vol. 21, pp. 169-185.
Ritch, R. and St. John, J., 1994. Hull/ice interaction load measurements on board the Louis S. St-Laurent during the 1994 Arctic voyage – trip report and data summary, December, 1994, Report on contract no. T8080-4-6051 for Transport Canada.
Riska, K., 1987. On the mechanics of the ramming interaction between a ship and a massive ice floe, Thesis for degree of Doctor of Technology, Technical Research Centre of Finland, Publication 43, Espoo, Finland.
Sanderson, T.J.O. 1988. Ice Mechanics - Risks to Offshore Structures. Graham and Trotman, London, 253 pp.
St. John J.W. and Minnick P.V., 1993. Swedish Icebreaker Oden – Ice impact load measurement during International Arctic Ocean Expedition 1991, Report to US Coast Guard under contract DO-92-0007 DTCG23-91-D-ENM026, May 1993.