Publisher’s version / Version de l'éditeur:
Vous avez des questions? Nous pouvons vous aider. Pour communiquer directement avec un auteur, consultez la première page de la revue dans laquelle son article a été publié afin de trouver ses coordonnées. Si vous n’arrivez pas à les repérer, communiquez avec nous à [email protected].
Questions? Contact the NRC Publications Archive team at
[email protected]. If you wish to email the authors directly, please see the first page of the publication for their contact information.
https://publications-cnrc.canada.ca/fra/droits
L’accès à ce site Web et l’utilisation de son contenu sont assujettis aux conditions présentées dans le site LISEZ CES CONDITIONS ATTENTIVEMENT AVANT D’UTILISER CE SITE WEB.
Proceedings of the International Conference on Bioinformatics and its
Applications (ICBA'04), 2004
READ THESE TERMS AND CONDITIONS CAREFULLY BEFORE USING THIS WEBSITE. https://nrc-publications.canada.ca/eng/copyright
NRC Publications Archive Record / Notice des Archives des publications du CNRC :
https://nrc-publications.canada.ca/eng/view/object/?id=9a7732a1-f24d-4fc0-a0f7-9ed9dc113d8b
https://publications-cnrc.canada.ca/fra/voir/objet/?id=9a7732a1-f24d-4fc0-a0f7-9ed9dc113d8b
NRC Publications Archive
Archives des publications du CNRC
This publication could be one of several versions: author’s original, accepted manuscript or the publisher’s version. / La version de cette publication peut être l’une des suivantes : la version prépublication de l’auteur, la version acceptée du manuscrit ou la version de l’éditeur.
Access and use of this website and the material on it are subject to the Terms and Conditions set forth at
Modular Neural Networks and Their Application in Exon Prediction
Pan, Youlian; Sensen, C.W.
Council Canada Institute for Information Technology de recherches Canada Institut de technologie de l'information
Modular Neural Networks and Their
Application in Exon Prediction *
Pan, Y., and Sensen, C.W.
December 2004
* published in the Proceedings of the International Conference on Bioinformatics and its Applications (ICBA’04). Fort Lauderdale, Florida, USA. Advances in Bioinformatics and its Applications (by World Scientific Inc) December 16-19, 2004. 13 pages. NRC 47386..
Copyright 2004 by
National Research Council of Canada
Permission is granted to quote short excerpts and to reproduce figures and tables from this report, provided that the source of such material is fully acknowledged.
1
MODULAR NEURAL NETWORKS AND THEIR APPLICATION IN EXON PREDICTION
YOULIAN PAN
Institute for Information Technology, National Research Council Canada, 1200 Montreal Road, M-50, Ottawa, Ontario, K1A 0R6 Canada
CHRISTOPH W. SENSEN
Faculty of Medicine, Department of Biochemistry and Molecular Biology, University of Calgary, 3330 Hospital Drive N.W., Calgary, Alberta, T2N 4N1 Canada
Rapid progress in genome research has produced a huge amount of nucleotide sequence data, including hundreds of complete genomes (Entrez Genomes). There is therefore a need to automate the gene prediction process to ensure that the amount of information does not in itself become a problem. Many prediction engines are available to facilitate such identification, but their application scope and prediction capability vary. This paper investigates the potential to improve gene prediction by integrating three available engines, GrailEXP, Genscan, and MZEF by means of a modular mixture of expert (MoE) neural network, where the utilization of a modular architecture is able to directly support the partitioned nature of the original data sources. The three selected engines represent three different categories of the prediction software. We were able to demonstrate that the integration system has markedly better recovery (proportion of actual exons that are predicted) than any of the individual prediction engines alone. After integration, we were able to achieve a higher correlation coefficient of exon prediction and thus a higher accuracy of the results. The program is available on line at http://www.cbr.nrc.ca/pany /integ.html with links to the data used for this research.
1. Introduction
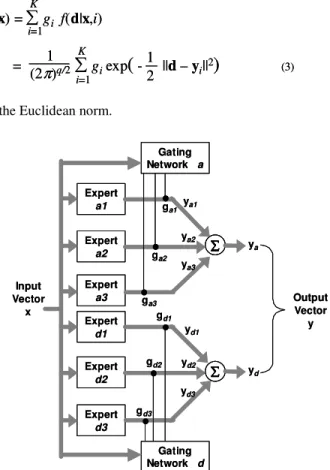
Machine learning systems have naturally been applied to a wide range of bioinformatics applications, including those of gene prediction. Neural networks, and in particular the Mixture of Experts (MoE) paradigm is to provide a scalable framework for combining multiple prediction engines, thus benefiting from the individual strengths of each engine. Such a context, although requiring the identification of an unknown integrating function, does provide for the incorporation of a priori knowledge that may facilitate the learning process. Secondly, from a machine learning perspective, a divide and conquer approach to model identification often facilitates more transparent models and better generalization of the resulting model [1]. Such a scheme defines the general architecture for a hierarchical decomposition of problems into sets of ‘expert’ and ‘gating’ models (Fig. 1). Experts represent subtasks from which the overall solution is composed, whereas each gate learns how to combine subtasks into an overall solution.
The MoE paradigm has been successfully applied to a range of complex prediction problems, including robot arm control [2], nonlinear direct control [3] and power utility demand [4]. Secondly, although not offering the same degree of accuracy as support vector machines [5], the technique is explicitly modular. Such modularity enables the user to directly determine the contribution from each component of the model for each classification where such an analysis may provide the basis for a better understanding of the problem, see for example [3]. Finally, we note that the modular approach embodied in the MoE paradigm facilitates a divide and conquer approach to learning, thus providing a simplification of the learning problem. Such architecture is therefore significantly different from the classical connectionist neural network approaches, as in the case of a multilayer perceptron.
In bioinformatics community, decision trees or statistical classifiers are often the norm. However, it has not been until recently that a more thorough analysis was performed on the characteristics associated with different learning algorithms [6]. For example, decision trees are often considered to offer transparent solutions, whereas statistical classifiers either rely on their implicit simplicity – as in the case of linear discriminant functions – or are too complex to analyze – as in the case of discriminant functions based on higher order polynomials. Naturally, there is a trade off between classification accuracy and transparency. However, a recent empirical analysis of 32 classification algorithms on sixteen benchmark classification problems has demonstrated that decision trees typically produce solutions too complex to analyze [6]. Finally, we note that standard linear discriminant analysis continues to represent a good compromise between computational effort and solution transparency [6]. In this study, we applied MoE paradigm to the integration of exon predictions.
The completed human genome sequence announced on April 14, 2003 showed that the human genome consists of approximately 3 billion base pairs
(bp)*. Only less than 1.5% is used for 30,000 – 40,000 protein-encoding genes,
whereas 24% consists of introns and 75% of the genome represents intergenic DNA (repeated sequences of various types and others) with no known function [7, 8]. Many genes have alternative splicing options. This results in a larger number of gene products. Given this volume and complexity, the ability to predict a gene structure is both an intellectual and a practical challenge [9].
Many gene prediction engines have been made available over the World Wide Web, such as Genscan [10], Grail family [11], GeneFinder family [12, 13] (original MZEF), HMMgene [14], GeneMark [15], Genie [16], FGENES [17] and many others [9]. However, such engines are often originally designed for specific purposes, for example GeneMark is specialized in prokaryotes, whereas others such as Genscan are useful for vertebrates. Although 80% of genes are accurately predicted at the nucleotide level, only 45% are at the exon level, and ~20% at the whole-gene level [9].
3 Each prediction program has its strengths in particular areas and weaknesses in others [9]. Some engines predict one type of exon better than the others. However, an exon predicted with a high score (probability) by more than one engine is more likely to be a real exon than that by any individual engine. In this paper, the potential for enhancing a prediction through the integration of strengths available in different prediction engines is investigated using MoE neural network architecture. The participating prediction engines are Genscan [10], GrailEXP [11] and MZEF [12, 13].
Genscan uses a general three-periodic non-homogeneous fifth-order Markov model to predict complete gene structures, including exons, introns, promoter, and polyadenylation (polyA) signals in genomic sequences [10]. It differs from the majority of existing gene prediction algorithms in that it allows for partial genes and complete genes, as well as for multiple genes in a single sequence, on one or both DNA strands. GrailEXP is one of the most recent versions of the Grail family [11] and uses a neural network approach to combine information from several exon-prediction models; each designed to recognize a particular sequence property. GrailEXP predicts exons, genes, promoters, polyAs, CpG islands, EST similarities, and repetitive elements within a DNA sequence. MZEF uses quadratic discriminant analysis and is specified for internal coding exon prediction [12]. MZEF does not give other information with respect to gene structure.
There are reports of integration of gene predictions. For example, Pavlovic
et al. [18] used a Bayesian network to combine predictions of Fgenes CGG1
[19], Genie EST and Geneie [20], and HMMgene [21] in Drosophila gene prediction; Rogic et al. [22] combined predictions in pairs among Genscan, HMMgene, FGENES, GeneMark.hmm and Genie. These previous studies demonstrated promising improvements in overall prediction performance through the combination of various engines.
Our objective in this study is to demonstrate the advantage of MoE architecture and its application in integrating the strength of various gene prediction engines. In the following sections, we describe the algorithm, design of the integration system, and result of its application in integrating exon prediction.
2. Algorithm
JacobsandJordan [2] model the modular MoE architecture as a mixture model.
That is, the output of any expert is described in terms of a Gaussian conditional probability density, which is proportional to the probability of the desired output
d having been created by expert model i on input pattern x, f(d|x,i) = exp(2π)1 q/2
(
- ||12 d – yi||2)
(1)= g(2π)1 q/2 iexp
(
-12 ||d – yi||2)
(3) f(d|x) = gi f(d|x,i) i=1 i=1 K K = g(2π)1 q/2 iexp(
-12 ||d – yi||2)
(3) f(d|x) = gi f(d|x,i) i=1 i=1 K Kwhere yi is the actual model output and q is the dimensionality of the output. As
indicated above, a linear gating network is used to identify the relative significance of each expert, resulting in the overall modular MoE output being modeled additively,
where y is the overall output. Each expert output yi is a function of the input
vector x and is defined by the corresponding set of the weights wi for that expert
independently of the output dimension q. A single gate output probability gi is
assigned to each expert (Fig 1). Thus, (Eq. 1) and (Eq. 2) give an associative Gaussian mixture model,
where ||⋅|| is the Euclidean norm.
y = gi=1 iyi (2) K y = gi=1 iyi (2) K Expert d1 Expert d3 Expert d2 Gating Network d Input Vector x gd1 gd2 gd3 yd1 yd2 yd3 Output Vector y yd Expert a1 Expert a3 Expert a2 Gating Network a ga1 ga2 ya1 ya2 ya3 ya ga3 Expert d1 Expert d3 Expert d2 Gating Network d Input Vector x gd1 gd2 gd3 yd1 yd2 yd3 Output Vector y yd Expert a1 Expert a3 Expert a2 Gating Network a ga1 ga2 ya1 ya2 ya3 ya ga3
Fig. 1. Design of the integration system, a modular neural network. a denotes splicing acceptor site and d denotes the splicing donor site. The linear gating network a combines experts for the acceptor site and network d for the donor site.
5 gi = 1 i=1 K gi = 1 i=1 K
and 0 < gi < 1 for all i
l(w, a) = ln exp(ui) exp
(
-12 ||d – yi||2) -
ln exp(uj) (6) i=1K K
j=1
l(w, a) = ln exp(ui) exp
(
-12 ||d – yi||2) -
ln exp(uj) (6) i=1K K
j=1
The task of the learning algorithm is to identify the correct values for expert and gate weights (the free parameters) such that the error of the predefined
training dataset {x, d} is minimized. In this case, Jacobs and Jordan [2] employ
the principle of maximum likelihood. Specifically, the conditional density function (Eq. 3) represents a likelihood function, which can be used to choose the maximizing (best) set of parameters w and g such that d is modeled to a
sufficient degree of accuracy.
The significance of this algorithm is that the gate – as indicated by index ‘i’ – is tailoring the error for specific expert networks, thus performing a problem decomposition with respect to the output space. Naturally, this could be taken a stage further by decomposing the input space, where this would require either a
priori knowledge, or the insertion of a suitable clustering algorithm [1]. Here we
consider the case of divide-and-conquer applied to the output space alone i.e. the original MoE model [2].
2.1. Modular MoE gate
The above probabilistic requirement of the gate results in the following constraints,
which is satisfied by the softmax function,
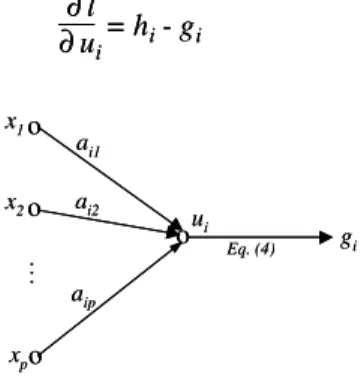
Moreover, the function defining the gate is in itself a neural network model, the simplest of which takes the form of a linear combination of the inputs (Fig. 2), or
ui = xTai (5)
where ai is a gate weight. Thus, the corresponding maximum likelihood cost
function for the unknown modular MoE parameters (w, a) is defined in terms of
log-likelihood as
where y1 ,…, yk are the unknown conditional mean vectors of the expert outputs;
and g1 ,…, gk are the optimized gate values providing the conditional a priori
probabilities that a corresponding expert generated target d. With considering
g
i=
(4) j=1 K exp(uj) exp(ui)g
i=
(4) j=1 K exp(uj) j=1 K exp(uj) exp(ui)the softmax function (Eq. 4), the log-likelihood cost (Eq. 6) allows a compact representation,
Using the process of gradient-based estimation, as popularized by the back-propagation learning algorithm for multi-layer perceptron neural networks [23],
the corresponding gate weight ai update expression is derived. From the term on
the right hand side of Eq. (6), the conditional a posteriori probability hi is
defined,
It represents a refined gate probability weight dependent on both input x and desired value d as opposed to the a priori probability gi, which is a function of
input x alone. Combining this with the differential of the second term in the right hand side of Eq. (6) provides
With respect to the linear gate model (Fig. 2) the remaining weight update rules follow from the ‘back-propagation’ of error terms as (c.f. gradient decent)
where η is the learning rate.
giexp(- || 12 d – yi||2) j=1 K gjexp(- || 12 d – yj||2)
h
i=
i = 1,2,…, k giexp(- || 12 d – yi||2) giexp(- || 12 d – yi||2) j=1 K gjexp(- || 12 d – yj||2) j=1 K gjexp(- || 12 d – yj||2)h
i=
i = 1,2,…, k l(w, a) = ln giexp(
-12 ||d – yi||2)
(7) i=1 K l(w, a) = ln giexp(
-12 ||d – yi||2)
(7) i=1 K ∆ai= η = η(hi- gi)x ∂l ∂ai ∆ai= η = η(hi- gi)x ∂l ∂ai o .. . o o o ai1 ai2 aip x1 x2 xp ui gi Eq. (4) o .. . o o o ai1 ai2 aip x1 x2 xp ui gi Eq. (4)Fig. 2. Signal flow of an output neuron of the gating network.
= hi- gi
∂ l
∂ ui= hi- gi
∂ l ∂ ui
7 2.2. Experts in the modular MoE
Derivation of the weight update for the expert networks follows a similar process. That is to say, we solve the derivation of log error with respect to weight change using the chain rule,
where
and in the case of a linear expert,
and thus,
Therefore, in both expert and gating networks, the general form of weight updates is
Weight change = (learning rate) x (local error)
x (input signal) (8)
3. Design And Implementation
In our integration system, each expert is a multilayer perceptron (MLP) [23]. Each MLP consists of an input layer, a hidden layer of nine neurons and an output layer of one neuron. A bias node with a value of -1 is added to the input layer and the hidden layer. Besides the bias node, the input layer is a vector of the nine attributes on each exon prediction:
(1) type of exon: initial, internal, terminal, or single,
(2) length of exon: number of base pairs contained in the exon, (3) prediction score by GrailEXP,
(4) probability of a correct prediction by Genscan, (5) splicing acceptor site prediction score by Genscan, (6) splicing donor site prediction score by Genscan, (7) probability of a correct prediction by MZEF, (8) splicing acceptor site prediction score by MZEF, (9) splicing donor site prediction score by MZEF.
The same input vector feeds to all the experts and the gating networks (Fig. 1). ∂l ∂yi = hi(d - yi) ∂l ∂yi = hi(d - yi)
∂y
i∂w
ij= x
j∂y
i∂w
ij= x
j∆
wij=η
=η
hi(d - yi)xj ∂l ∂wij∆
wij=η
=η
hi(d - yi)xj ∂l ∂wij = ∂l ∂wij ∂l ∂yi ∂yi∂wij = ∂l ∂wij ∂l ∂wij ∂l ∂yi ∂yi∂wij ∂l ∂yi ∂yi∂wijThe input vector is not necessarily complete. There are some missing attributes because all the engines do not necessarily predict the same exon. The values for unavailable attributes are set to zero. Thus, a forward pass through Eq. (5) results in no output and a zero gate cost contribution (Eq. 6), removing the effected expert from any weight update.
Since the prediction results are in different scales and/or units, we normalized the values. The training dataset is used to establish a zero mean unit standard deviation normalization, where the same mean and standard deviation are applied to testing dataset,
where j denotes attribute; i denotes the pattern number; ‘^’ denotes the estimated
mean; and σ is the estimated standard deviation. This normalization process is
necessary to ensure equality of all attributes in the input vector.
The integration output is a vector of two scores, one for each splicing site. The values of these scores are between 0 and 1 representing poor to excellent match. The higher score indicate a better likelihood of a prediction to be a true splicing site. The system is implemented in java with user and system interface implemented in HTML and Perl, respectively and available at http://www.cbr .nrc.ca/pany/integ.html. The output is in plain text, XML† and HTML file
format. 4. Data
A set of 59 human genomic DNA sequences was collected directly from the GenBank. The majority of these sequences are also available in the Exon–Intron Database at Harvard University [24]. Three of the sequences are multiple gene sequences. The sequence length ranged from 1822 to 191075 bp. All of these DNA sequences were deposited into the GenBank in 1997 or thereafter, and their exons have been verified experimentally.
A set of 845 exon predictions was collected by submitting 33 sequences to the three prediction engines and by combining the results from each of the three engines. Through careful examination of every prediction from this set and cross checking with the original GenBank entry, predictions that had unacceptable attribute values were removed from this dataset. Finally, a set of 575 predictions with various target values resulted from the above filtering and was used for training purposes.
The test dataset consisted of 26 genomic DNA sequences and a total of 580 exon predictions. This dataset did not have any sequence overlapping with the training dataset. One of the 26 sequences was a multiple gene sequence. The
† A DTD file is provided at http://www.cbr.nrc.ca/pany/integx.dtd.
xj’(i) =
xj(i) - xj
σj
9 length of these sequences ranged from 3,241 to 163,974 bp with an average of 20,316 bp. None of the predictions were filtered.
5. Measuring Prediction Accuracy
We adopted the measurement system of Burnet and Guigo [25] for prediction accuracy. Notation and derivation details of the terms are identical to the original description except for those specified below.
At the exon level, we use two additional terms, recovery rate (R) and partially predicted exon (PCa). Recovery rate is the proportion of predicted exons (exact or partial) over the total number of true exons on a sequence. A combination of recovery rate and missing exon rate (ME) is a unity. Thus,
R = 1 – ME
Partially predicted exon is the proportion of real exons that are partially predicted (only one of the splice sites predicted). This term is identical to the term PCa used in [26]. This is the recovery rate minus exon level sensitivity,
PCa = R – ESn
Our definition of Wrong Exon (WE) is different from that in [25]. In our definition, WE is the proportion of predicted exons without any overlapping with exact exons, thus it does not include partially correct exons; while in [25], WE includes partially correct exons. For the purpose of comparison, WE in [25] is our WE+PCa. As a consequence, our WE would tend to be smaller than or equal to that of [25]. When a program does not predict any exons in a sequence, 0 is assigned to both sensitivity (ESn) and specificity (ESp), and this sequence is not considered when calculating the average of these term values.
6. Results And Discussion
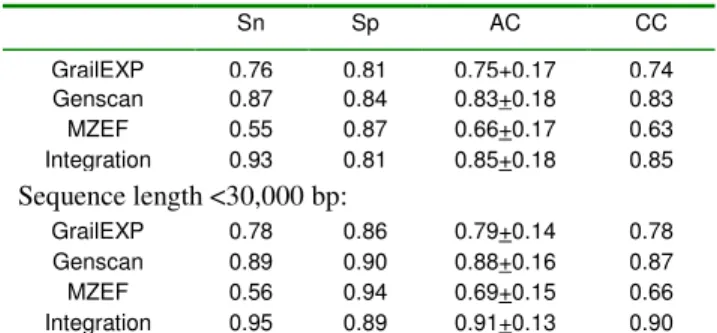
Tables 1 and 2 show the results of prediction accuracy measurements. At both nucleotide and exon levels, the integration system has significantly better sensitivity (p<0.5) than GrailEXP and MZEF and generally better performance than any of the participating engines. The integration system has higher value of the correlation coefficient (CC) and approximation correlation (AC) at the nucleotide level and lower missing exons level (ME) than those engines.
The specificity (Sp) of the integration system at the nucleotide level does not seem to be better than any of the participating engines (Table 1). At the exon level, the integration system appears to have a high value of wrong exon (WE) prediction (Table 2). By providing a filter that removes predictions with integration scores lower than or equal to a threshold, we are able to improve the specificity by sacrificing the sensitivity. With this property, users with different perspectives in the result can select their threshold of prediction. The system provides a quality indicator based on the integration scores, fair ( 0.0), good (one of the splicing site 0.75), excellent (sum of both splicing sites 1.5).
For the same prediction engine, the values in Tables 1 and 2 (top sections) appear smaller than those reported in [26]. This is attributable to the difference in length of sequences used in these two studies. The mean length of 195 sequences in [26] was 7,096 bp, while that of our 26 testing sequences was 20,316 bp. After removing 6 sequences that have length of over 30,000 bp, we were able to obtain a subset of 20 testing sequences with mean length of 7,978 bp. The results from this subset (Tables 1 and 2, bottom section) are close to that reported in [26]. This is attributable to the fact that longer sequences usually contain longer intron regions and tend to have higher number of misleading patterns that are similar to the splicing sites. As a result, all prediction engines perform better with shorter sequences.
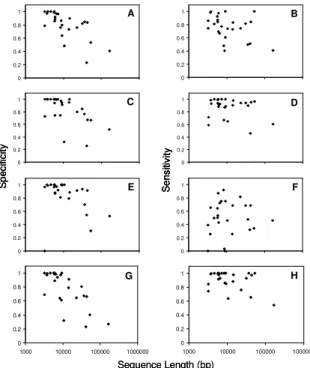
The sensitivity in the subset does not seem to improve as significantly as that of specificity after removing the 6 longer sequences, especially for the MZEF. Fig. 3 indicates that the sensitivity of MEZF does not change with
Table 2. Exon level accuracy measurements
ESn ESp (ESn+ESp)/2 ME WE PCa R GrailEXP 0.47 0.52 0.49+0.23 0.22 0.14 0.31 0.78 Genscan 0.68 0.70 0.69+0.26 0.13 0.13 0.19 0.87 MZEF 0.45 0.60 0.52+0.20 0.43 0.21 0.19 0.62 Integration 0.77 0.70 0.74+0.22 0.09 0.19 0.14 0.91 Sequence length <30,000 bp: GrailEXP 0.46 0.54 0.50+0.25 0.21 0.07 0.33 0.79 Genscan 0.67 0.75 0.71+0.26 0.13 0.06 0.19 0.87 MZEF 0.48 0.64 0.56+0.19 0.43 0.17 0.21 0.64 Integration 0.77 0.77 0.77+0.21 0.09 0.11 0.14 0.91
Note: ESn: Sensitivity, ESp: Specificity, ME: Missing Exons, WE: Wrong
Exons, PCa: Partially predicted exons, R: Recovery rate. (ESn+ESp)/2 is in mean+std (standard deviation).
Table 1. Nucleotide level accuracy measurements
Sn Sp AC CC GrailEXP 0.76 0.81 0.75+0.17 0.74 Genscan 0.87 0.84 0.83+0.18 0.83 MZEF 0.55 0.87 0.66+0.17 0.63 Integration 0.93 0.81 0.85+0.18 0.85 Sequence length <30,000 bp: GrailEXP 0.78 0.86 0.79+0.14 0.78 Genscan 0.89 0.90 0.88+0.16 0.87 MZEF 0.56 0.94 0.69+0.15 0.66 Integration 0.95 0.89 0.91+0.13 0.90
Note: Sn: Sensitivity, Sp: Specificity, AC: Approximate Correlation, CC:
11 regard to sequence length, while the specificity of all the prediction engines and the integration system are related to the sequence length.
The quality of prediction of the integration system is a function of that of each participating engine. It is therefore the prediction by the integration system reflects the combined effect of individual engines. For example, the seven exons in the ogg1 gene (GenBank ID = HSA131341) are not predicted by any of the three engines. In such circumstances, the integration system would not do any better. Nevertheless, exons predicted by more than one engine are more likely to be actual exons. Thus users can be more confidence in the prediction result, which is certainly demonstrated here. A higher correlation coefficient of the integration system indicates a more accurate result. By integrating the predictions from various engines, the recovery rate (R=1-ME) is significantly better than any of theparticipating engines alone.
Accurate identification of splicing sites is one of the most important issues in eukaryotic gene discovery. Our research indicates that Genscan is significantly better than GrailEXP and MZEF with regard to both sensitivity and specificity at the exon level. The overall recovery rates of the integration system are better
S en si tivity S pe ci fic ity 0 0.2 0.4 0.6 0.8 1 0 0.2 0.4 0.6 0.8 1 0 0.2 0.4 0.6 0.8 1 0 0.2 0.4 0.6 0.8 1 0 0.2 0.4 0.6 0.8 1 0 0.2 0.4 0.6 0.8 1 0 0.2 0.4 0.6 0.8 1 1000 10000 100000 1000000 0 0.2 0.4 0.6 0.8 1 1000 10000 100000 1000000 F H D B A C E G Sequence Length (bp) S en si tivity S pe ci fic ity 0 0.2 0.4 0.6 0.8 1 0 0.2 0.4 0.6 0.8 1 0 0.2 0.4 0.6 0.8 1 0 0.2 0.4 0.6 0.8 1 0 0.2 0.4 0.6 0.8 1 0 0.2 0.4 0.6 0.8 1 0 0.2 0.4 0.6 0.8 1 1000 10000 100000 1000000 0 0.2 0.4 0.6 0.8 1 1000 10000 100000 1000000 F H D B A C E G S en si tivity S pe ci fic ity 0 0.2 0.4 0.6 0.8 1 0 0.2 0.4 0.6 0.8 1 0 0.2 0.4 0.6 0.8 1 0 0.2 0.4 0.6 0.8 1 0 0.2 0.4 0.6 0.8 1 0 0.2 0.4 0.6 0.8 1 0 0.2 0.4 0.6 0.8 1 1000 10000 100000 1000000 0 0.2 0.4 0.6 0.8 1 1000 10000 100000 1000000 F H D B A C E G Sequence Length (bp)
Fig. 3. Specificity (Sp, left) and sensitivity (Sn, right) of participating engines and the integration system. A, B: GrailEXP; C, D: Genscan; E, F: MZEF; G, H: Integration
than any participating engine. Claverie [27] demonstrates that Genscan and MZEF are among the best gene prediction engines. However, in the current study, the sensitivity and specificity of MZEF does not appear as good as that of GrailEXP, and the recovery rate is very low. This is attributable to the fact that MZEF predicts only the internal exons. By incorporating the capability of predicting initial and terminal exons, MZEF could perform better.
In the input vector, GrailEXP is represented by one attribute, while the other two engines are represented by three attributes. It might therefore be argued that GrailEXP faces an initial disadvantage. However, when using a gradient based update rule, adaptation of the free parameters takes place in proportion to the cross- and auto-correlation between feature and target value. As there is no a
priori bias in favor of specific input features, all therefore appear equally
significant at initialization. Only during the assignment of credit through the weight update rule is significance to specific inputs assigned.
Our study indicates that the prediction of exons can be improved by integrating the results of several prediction engines. As a first attempt, our integration system architecture applies three experts of the same architecture (the multilayer perceptron). A diverse set of algorithms in experts can improve the prediction further. This merits further investigation.
Our motivation in this study is to integrate predictions of engines with various strengths. As for overall performance, there are several other prediction engines that are reported better than GrailEXP and MZEF (see [26]). For example HMMgene [14] and Genie [16] have comparable levels of performance to that of Genscan. FGENES [17] is another highly reputable engine in eukaryote exon prediction. However, their prediction features and algorithms are similar to Genscan, which was used in this study, and thus are not considered. However, inclusion of more such engines, in the integration system could improve the quality of integration and merits further study.
This integration of exon prediction by the three engines improved human exon prediction. Inclusion of other engines designed for other group of organisms would further improve the accuracy of predictions and facilitate broader application of the integration system.
Acknowledgments
We are thankful to Michael Shepherd, Malcolm Heywood and Andrei Turinsky, Fazel Famili, Qing-Yan Liu for the constructive discussion and critical comments. Paul Gordon and Sheldon Briand provided technical support. The Sensen laboratory is supported by Genome Canada, Genome Prairie, The Alberta Science and Research Authority, Western Economic Diversification, The Alberta Network for Proteomics Innovation, and the Canada Foundation for Innovation. This is publication NRC ***** of National Research Council of Canada
13 References
1. B. Tang, M. I. Heywood, and M. Shepherd, IEEE Int. Joint Conf. on Neural Networks pp. 227-232 (2002).
2. R.A. Jacobs and M. I. Jordan, IEEE Trans. Sys. Man, and Cybernetics 23, 337-345 (1993).
3. V. Paraskevopoulos, M. I. Heywood and C. R. Chatwin, International
Journal of Intelligent Control and Systems 3, 171-192 (1999). 4. A. S. Weigend, Applied Artificial Intelligence 10, 583-624 (1996).
5. V. Vapnik, The Nature of Statistical Learning Theory. Springer-Verlag, New York (1995).
6. T. J Lim, W. Y. Loh, and Y.S. Shih, Machine Learning 40, 203-228 (2000).
7. J. C. Venter et al., Science 291, 1304-1351 (2001).
8. International Human Genome Sequencing Consortium, Nature 409,
860-921 (2001).
9. M. Q. Zhang, Nature Review–Genetics 3, 698-710 (2002).
10. C. Burge and S. Karlin, J. Mol. Biol. 268, 78-94 (1997).
11. Y. Xu, and E. C. Uberbacher, J. Comput. Biol. 4, 425-338 (1997). 12. M. Q. Zhang, PNAS 94, 565-568 (1997).
13. M. Q. Zhang, Brief. Bioinfo. 1, 331-342 (2000).
14. A. Krogh, Proc. of 5th Int. Conf. on Intelligent Systems for Molecular
Biology, AAAI Press, Menlo Park, CA, pp. 179-186 (1997).
15. M. Borodovsky, and J. McIninch, Computers & Chemistry 17, 123-133. (1993)
16. D. Kulp, D. Haussler, M. G. Reese, and F. H. Eeckman, Proc. of 4th Int.
Conf. on Intelligent Systems for Molecular Biology, AAAI Press, Menlo
Park, CA, pp. 134-142 (1996).
17. V. V. Solovyev, A. A. Salamov, and C. B. Lawrence Proc. of 3rd Int. Conf.
On Intelligent Systems for Molecular Biology, AAAI Press, Cambridge,
England, pp. 367-375 (1995).
18. V. Pavlovic, A. Garg and F. Kasif, Bioinformatics 18, 19-27 (2002).
19. A. A. Salamov and V. V. Solovyev, Genome Research 10, 516-522 (2000).
20. M. Reese, D. Kulp, H. Tammana and D. Haussler, Genome Research 10,
529-538 (2000).
21. A. Krogh, Genome Research 10, 523-528 , (2000).
22. S. Rogic, F. B. F. Ouellette and A. K. Mackworth, Bioinformatics 18,
1034-1045 (2002).
23. B. Widrow and M. A. Lehr, Int. J. Intelligent Systems 8 453-507 (1993). 24. S. Saxonov, I. Daizadeh, A. Fedorov and W. Gilbert, EID: Nucleic Acids
Res. 28, 185-190 (2000).
25. M. Burset and R. Guigo, Genomics 34, 353-367 (1996).
26. S. Rogic, A. K. Mackworth, and F. B. F. Ouellette, Genome Research 11,
817-832 (2001).