HAL Id: hal-00932285
https://hal.archives-ouvertes.fr/hal-00932285
Submitted on 16 Jan 2014
HAL is a multi-disciplinary open access
archive for the deposit and dissemination of
sci-entific research documents, whether they are
pub-lished or not. The documents may come from
teaching and research institutions in France or
abroad, or from public or private research centers.
L’archive ouverte pluridisciplinaire HAL, est
destinée au dépôt et à la diffusion de documents
scientifiques de niveau recherche, publiés ou non,
émanant des établissements d’enseignement et de
recherche français ou étrangers, des laboratoires
publics ou privés.
Phoneme resistance during speech-in-speech
comprehension
Léo Varnet, Julien Meyer, Michel Hoen, Fanny Meunier
To cite this version:
Léo Varnet, Julien Meyer, Michel Hoen, Fanny Meunier. Phoneme resistance during speech-in-speech
comprehension. 13th Annual Conference of the International Speech Communication Association, Sep
2012, Portland, Oregon, United States. �hal-00932285�
Phoneme resistance during speech-in-speech comprehension
Léo Varnet
1,2, Julien Meyer
3,4, Michel Hoen
1,2, Fanny Meunier
1,2 1Lyon Neuroscience Research Centre (INSERM U1028, CNRS UMR5292), Lyon, France.
2
University Lyon 1, Lyon, France.
3
Área de Linguística, Museu Goeldi, Ministerio da Ciência e Tecnologia, Belém, Pará, Brasil
4
Sound Communication and environmental auditory Perception Research Group, Paris, France
[email protected], [email protected]
Abstract
This study investigates masking effects occurring during speech comprehension in the presence of concurrent speech signals. We examined the differential effects of 4- to 8-talker babble (natural speech) or babble-like noise (reversed speech) on word identification. We measured phoneme identification rates. Results showed that different types of linguistic information can interfere with speech recognition and that different resistances are observed for different phonemes depending on interfering noise.
Index Terms: Speech-in-speech; Energetic masking; Informational masking; Phoneme resistance.
1. Introduction
Most of the time in real-life listening situations, we have to deal with environmental noise or concurrent speech partly masking target speech signals, yet we are still able to decipher the information they contain. However different types of backgrounds have been shown to differently affect speech comprehension [1]. In the present paper we tested the effect of different backgrounds on a word identification task.
For speech target, two types of masking effects must be considered: energetic masking and informational masking [2]; [3]. Energetic masking occurs when speech and masker noises overlap, even partially, in time and frequency. Informational masking concerns the type of information carried by the two signals. Although there is not necessarily any physical overlap in the signals from target- and masker-sounds, competition between information carried by the two signals will compete during high-level processes [4], [5].
In the context of speech-in-speech comprehension, some energetic masking certainly does occur, although it has been shown to be responsible for only a relatively small part of the overall masking phenomenon which occurs in this listening situation [6]. Indeed during speech-in-speech comprehension informational masking plays a predominant role on the intelligibility of target speech signals. While informational masking has until now been considered as monolithic, it seems clear that in the particular case of speech, such a view is limited given the numerous types of linguistic information involved during comprehension (for example phonological information and lexical one).
In a previous paper [7] we examined the different effects of acoustic-phonetic and lexical content of 4- to 8-talker babble on word identification. Our results showed that the nature and amount of interfering linguistic information available from background babble varied with the decrease in spectro-temporal saturation caused by reducing the number of talkers in the
babble. This was associated with different types of linguistic competition for target-word identification, reaching the lexical masking effect when only 4 talkers constituted the background noise (see also [8]).
While in our previous work we focused on word identification performances, i.e. the proportion of reported words that corresponded to target words, in the present paper we analyzed performances of masked word identification at a phonemic level in order to test resistance of different French phonemes to different types of masking.
1.1. The present study
Our experiment studied the impact of different types of babble backgrounds during word identification on phonological information, with an increasing number of simultaneous talkers. To avoid unmasking effects mostly due to the processing of pitch information observed with babble sounds made of up to 3-talkers [3], we focused on situations with 4, 6 and 8 talkers where individual voice characteristics are less predominant. We contrasted situations where the babble was made of natural speech and therefore contained real words (natural speech) vs. situations in which only partial phonetic information was available (reversed speech) vs. situations in which no phonetic information was available (speech derived noise). As babble sounds, we used signals composed of 4, 6 and 8 simultaneous talkers (S4, S6 and S8). In order to dissociate the spectro-temporal saturation effect from potential linguistic masking effects, the same speech sounds were also presented reversed along their temporal axis (reversed babble sounds, later referred to as R4, R6, R8). Time reversal of speech signals has been claimed to be the most drastic degradation one can apply to speech [9]. However, not only does reversed speech ‘sound’ like speech, but partial phonetic information present in natural speech remain intelligible (like vowels or fricatives for example). Moreover, when different reversed speech streams are mixed together, the resulting babble sounds like normal speech babble and phonemes can be perceived, although it does not contain words. Reversed babble stimuli were thus considered in the experiment as an intermediate situation where speech sounds contained phonetic but no lexical information. To further obtain a reference measure of a pure energetic masking effect, we added one condition where speech was presented against a broadband noise background (later referred to as N). This noise was designed to have similar spectro-temporal characteristics as our most spectro-temporally saturated natural and reversed babble signals (i.e. S8 and R8). These 7 background noise types (S4, S6, S8, R4, R6, R8 and N) were all tested at 4 different SNRs of 3, 0, +3 and +6 dB, yielding a total of 28 main experimental conditions.
2. Experiment
2.1. Materials and Methods
2.1.1. Concurrent sounds:
Multitalker babble sounds, reversed babble sounds and associated broadband noiseThe babble signals were created with groups of 4, 6 and 8 talker voices. Each voice was first recorded separately in a sound-proof room, reading extracts from the French press. Individual recordings were modified according to the following protocol: (i) removal of silences and pauses of more than 1 s, (ii) suppression of sentences containing pronunciation errors, exaggerated prosody or proper nouns, (iii) noise reduction optimized for speech signals, (iv) intensity calibration in dB-A and normalization of each source at 80 dB-A and (v) final mixing of individual sources into cocktail party sound tracks. Reversed babble sounds were obtained by reversing the previously generated speech babble stimuli along their temporal dimension. We created a broadband noise with spectro-temporal characteristics comparable to those of our most saturated natural and reversed babble, i.e. the 8-talker babble (see [7] for details).
2.1.2. Target words
Two hundred and eighty-eight French mono-syllabic, tri-phonemic words were recorded in a sound-proof booth by a male native French speaker. Words were selected in a middle range of frequency of occurrence (ranging from 0.19 to 146.71 per million; mean = 20.96, SD = 21.37), according to the French database Lexique2 [10].
2.1.3. Stimuli and word lists
Stimuli consisted of the 288 single target-words mixed together with 4 s samples of background noise. Target words were always inserted 2.5 s from the start of the stimulus. Stimuli were composed by mixing one chunk of background noise, randomly selected from 40 chunks extracted from the original noise files, with one target word. Individual intensity levels for background noise and target-words were adjusted according to the global rms power of the original sounds to be mixed. As this resulted in some intensity modulation of the final stimuli and in order to avoid global intensity of stimuli to become predictive of the SNR, a final randomized intensity roving over a ±3 dB range in 1 dB steps was applied. Thirty-six different lists – one for each participant – were generated, each list containing every target word only once (288 stimuli). Across lists, all target words were presented against the 28 background conditions.
2.1.4. Participants and procedure
Thirty-six volunteers participated in the experiment, they were native French speakers, aged 18–32 years, with no known hearing or language disorders. Participants sat in a quiet room, facing a computer monitor. Stimuli were delivered diotically via headphones (Beyerdynamic DT 48, 200 X) at an individually adjusted comfortable sound level. The task for participants consisted in a single-word transcription, participants being asked to type the sounds they heard on a computer keyboard. Before testing phase, participants were given 12 practice items to accommodate to stimulus presentation mode and target’s voice. The experiment lasted on average 45 min.
2.2. Results
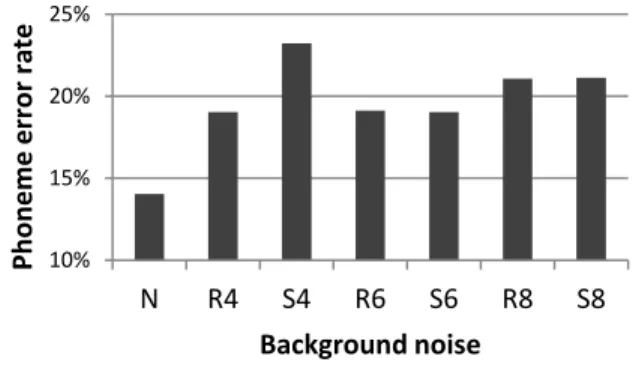
We analyzed the phonemic decomposition of the responded words. To assess the influence of each factor, the phoneme error rate was computed separately for each condition, each SNR, each position in the syllabic structure, and each type of phoneme (12 vowels: [a, ã, ə, e, ɛ, i, ɛ , ɔ, o, ɔ , y, u] and 18 consonants: [p, t, k, f, s, ʃ, b, d, g, v, z, ʒ, j, ʁ, l, m, n, ɲ]). Altogether, a total of 858 phonemes were heard by each of the 36 participants, yielding a total of 30 888 observations. Overall, we obtained a mean phoneme error rate of 20% across all conditions. As expected, the percentage of errors in phonemes decreased with SNR (7% at +6dB, 12% at +3dB, 21% at 0dB and 39% at -3dB, p<.001). Figure 1 shows performance scores for each type of background noise separately. The lowest phoneme error rate was observed in condition N (14%, all ps<.001). It appears that Speech and Reversed speech conditions lead to a similar decrease in performances between 6 talkers and 8 talkers (19% for S6 and R6 and 21% for S8 and R8). Conversely, for 4 talkers, a difference of 5.1% is observed in the percentage of incorrectly reported phonemes between these conditions (R4: 18.1%, S4: 23.2%, p<.001), suggesting that the information carried by the 4 talkers’ speech interfered more with target identification.
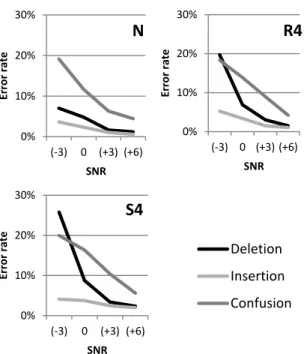
Figure 1. Phoneme error rates in all conditions To further investigate this difference, we dissociate errors in phoneme recognition by studying separately confusions (phonemes mistaken for one another), deletions (suppression of a phoneme in the syllabic structure of the responded word), and insertions (addition of a phoneme in the syllabic structure of the responded word). Confusions and insertions turned out to have similar evolutions with SNR whatever the type of background noise (see Figure 2): in all condition we observed a decrease in confusion rate from 20% at -3 dB to approximately 5% at 6 dB, while insertion rate stands below 5%. Conversely, our analysis revealed an important variation in deletion rate (p<.001) depending on the kind of noise: low (<7%) and quasi-constant in condition N, but on the contrary strongly correlated with SNR in condition S4, from 2% to 26%.
Additional evidences of this difference in S4 were found in distinguishing between errors occurring in vowels or in consonants. Overall the mean error rate was 9% in vowels, and 25.4% in consonants. We observed a lower error rate in vowels than in consonants for each kind of background noise (N: 4.3%, S4: 12.3%, S6: 8.7%, S8: 9.7%, R4: 10.4%, R6: 8.0%, R8: 9.8% for vowels, and N: 19.5%, S4: 29.2%, S6: 24.9%, S8: 27.5%, R4: 24%, R6: 25.4%, R8: 27.2% for consonants). The evolution of degradation in recognition performances with SNR confirmed that deletion dramatically increases with noise level in condition
10% 15% 20% 25%
N
R4
S4
R6
S6
R8
S8
Phoneme
er
ror
ra
te
Background noise
S4 but not in condition N. Confusion, deletion and insertion rates depend on the type of sound (p<.001), deletion rate reaching over 25% at -3 dB for consonants but less than 10% for vowels, in all seven conditions, whereas deletion rate is similar for vowels and consonants.
Figure 2. Percentage of deletion, insertion and confusion in function of RSB, in condition N, R4 and S4.
The main source of errors on consonants at any SNR was confusion, whereas on vowels, confusion and deletion rates are equivalent, except at -3dB where the major part of errors was due to an absence of answer (not in condition N). A more detailed observation of errors on consonants revealed that, in all conditions, deletion rates are equivalent on initial and final consonants, but confusion rates are considerably higher in the first case.
More precisely, when comparing recognition performances for the 17 most played consonants independently (Figure 3), specific distribution patterns are seen in condition N, S and R, with clear differences in scores for [f] (ranging from 66% (S6) to 48% (S8)), [b] (from 76% (N) to 53% (S4)), [g] (from 83% (N) to 64% (S8)) or [j] (from 96% (N) to 69% (S4)). The increasing difficulty in identification of phonemes indicated above is mostly due to variations in confusion rates with the type of background noise, deletion rates being constant over conditions. The sibilant consonants [ʃ], [Ʒ] and [s] were the best recognized in every condition, but the score of the consonant [z] depends on the type of background noise (81% for (R4) but 56% for (S4)), demonstrating that the sibilant frication has to be completed by phonetic power to be a critical factor for good identification. The consonants with the poorest recognition performances are not identical for all types of background noise (e.g. [f] and [v] for N, [b, d, v, z] for S4, and [d, v] for R4).Vowels with a sufficient number of occurrences have similar patterns of recognition for conditions S4, S6, S8, R4, R6 and R8, with a general percentage of not reported phonemes around 9%, whereas in the case of a broadband noise (N), percentage of not reported phonemes falls below 3% (see Figure 3).
A)
B)
Figure 3. Confusion rate and no answer rate per phoneme, in condition N (A) and in condition S4 (B)
In order to clarify the origin of confusions between phonemes, we displayed confusion matrix for consonants and vowels individually for each type of background noise (the two most contrasting conditions being reported on Figure 4). It appears that the most frequent inter-vowels confusions corresponded to the situations when [o] was mistaken for a [u], [u] was mistaken for a [y], and [y] was mistaken for a [o]. The most frequent inter-consonants confusion were obtained when [f] was mistaken for a [p], [p] was mistaken for a [b], [t] was mistaken for a [p], [v] was mistaken for a [b], and [n] was mistaken for a [m]. In general, we observed that confusion with a phoneme often conduces to misunderstanding a consonant in favor of [p] or [b], rather than other consonants of equal frequency of occurrence such as [t]. On another hand we can notice several differences between confusion matrixes: confusions with [b] and [p] are more frequent in condition (N) than in other types of background noise, where all confusions are more widely distributed over all consonants. 0% 10% 20% 30% (-3) 0 (+3) (+6) Error rate SNR
N
0% 10% 20% 30% (-3) 0 (+3) (+6) Error rate SNRR4
0% 10% 20% 30% (-3) 0 (+3) (+6) Error rate SNRS4
Deletion
Insertion
Confusion
0% 10% 20% 30% 40% Error rateConfusion
No answer
0% 20% 40% 60% Error rate 0% 10% 20% 30% 40% Error rate 0% 20% 40% 60%Er
ror
ra
te
Figure 4. Confusion matrix in condition N (up) and in condition R8 (down)
3. Discussion & Conclusion
In this experiment we tested phoneme identification performances in situations where the babble was made of natural speech vs. situations in which only partial phonetic information was available vs. situations in which no phonetic information was available. The babble sounds were composed of 4, 6 and 8 simultaneous talkers.
Results are coherent with those of a previous analysis performed at the word level: we observed more errors in babble sounds (natural or reversed) compared to broadband noise and also a monotonic decrease in speech comprehension rates with the increasing number of simultaneous talkers between 6 talkers and 8 talkers (for natural and reversed babbles). When only 4 talkers are present the pattern is different despite the fact that a signal analysis showed a monotonic increase in spectro-temporal saturation with an increasing number of simultaneous talkers, for both natural and reversed speech. This suggest that the rise of informal masking observed in R4 (that gave similar performances than R6) and even more in S4 corresponded to acoustic-phonetic masking (which is fairly similar in the
reversed and natural conditions) and higher level linguistic masking (only present in natural babble). Both effects depend on the number of talkers in the background babble.
Our results also showed that vowels are much more resistant than consonants and that errors on consonants were mostly confusions whereas deletion is also source of errors on vowels. Overall there were more confusions than deletions and quite rare insertions. Performed analyses clearly showed the different impact of background sounds on phoneme intelligibility. With few talkers, deletions appear as rare as insertions for higher SNRs, but increased at less favorable SNRs to reach confusion rate in R4 and even overtake it in S4. Also while some phonemes presented stable patterns over conditions as [v], it is not always the case, as for [z] reaching 50 % in S4 and only 20% in N. Results per phoneme revealed that while the less resistant consonants are [f] and [v] in N, they are [v] and [z] in S4. The more resistant consonants are similar in both background sounds (i.e. [s] and [ʃ]). For vowels the less resistant ones are [e] in N but [o] (followed by [e]) in S4 and the more resistant ones, [a], [i] and [u] in N and [a] only in S4.
These results showed that different types of linguistic information can interfere with speech recognition and that several resistances are observed for different phonemes depending on the interfering noise.
4. Acknowledgements
The authors would like to thank N. Grimault for the help on the cocktail original sounds, C. Grataloup for collecting the data and F. Pellegrino for running the signal analysis. This research was supported by the European Research Council (starting-grant SpiN Project, ERC n°209234).
5. References
[1] Bronkhorst, A., “The cocktail party phenomenon: a review of research on speech intelligibility in multiple-talker conditions”, Acustica, 86:117-128, 2000.
[2] Brungart, D. S., “Informational and energetic masking effects in the perception of two simultaneous talkers”, J. Acoust. Soc. Am, 109: 1101-1109, 2001.
[3] Brungart, D.S., Simpson, B.D., Ericson, M.A., Scott, K.R., “Informational and energetic masking effects in the perception of multiple simultaneous talkers” J. Acoust. Soc. Am., 110:2527– 2538, 2001.
[4] Dirks, D.D., Bower, D., “Masking effects of speech competing messages”, J. Speech Hear. Res., 12: 229-245, 1969.
[5] Festen, J. M., Plomp, R., “Effects of fluctuating noise and interfering speech on the speech-reception threshold for impaired and normal hearing” J. Acoust. Soc. Am., 88:1725-1736, 1990. [6] Brungart, D.S., Chang, P.S., Simpson, B.D., Wang, D., “Isolating
the energetic component of speech-on-speech masking with ideal time-frequency segregation”, J. Acoust. Soc. Am., 120:4007–4018, 2006.
[7] Hoen, M., Meunier, F., Grataloup, C.L., Pellegrino, F., Grimault, N., Perrin, F., Perrot, X., Collet, L., “Phonetic and lexical interferences in informational masking during speech-in-speech comprehension”, Speech Communication, 49(12):905-916, 2007. [8] Van Engen, K.J. and Bradlow A.R. “Sentence recognition in native
and foreign-language multi-talker background noise”, J.Acoust. Soc. Am. 121:519-526, 2007.
[9] Saberi, K. and Perrott, D. R., “Cognitive restoration of reversed speech”, Nature, 398:760, 1999.
[10] New, B., Pallier, C., Brysbaert, M., Ferrand, L., “Lexique 2: a new French lexical database”, Behav. Res. Meth. Instr. Comp., 36:516– 524, 2004. p t k f s ʃ b d g v z ʒ j ʁ l m n p t k f s ʃ b d g v z ʒ j ʁ l m n p t k f s ʃ b d g v z ʒ j ʁ l m n p t k f s ʃ b d g v z ʒ j ʁ l m n Answered P la y e d Answered P la y e d