Title Page
Title: Gray matter hypertrophy and thickening with obstructive sleep apnea in middle-aged and older adults
Authors’ name, degrees, and affiliations:
Andrée-Ann Baril, BSc1,2, Katia Gagnon, BSc1,3, Pauline Brayet, BSc1,3, Jacques Montplaisir,
MD, PhD1,2, Louis De Beaumont, PhD1,4, Julie Carrier, PhD1,5, Chantal Lafond, MD1, Francis L’Heureux1,6, Jean-François Gagnon, PhD1,3, Nadia Gosselin, PhD1,5
1. Center for Advanced Research in Sleep Medicine (CARSM), Hôpital du Sacré-Coeur de Montréal, Montreal, Quebec, Canada
2. Université de Montréal, Department of Psychiatry, Montreal, Quebec, Canada
3. Université du Québec à Montréal, Department of Psychology, Montreal, Quebec, Canada 4. Université de Montréal, Department of Surgery Montreal, Quebec, Canada
5. Université de Montréal, Department of Psychology, Montreal, Quebec, Canada 6. Université de Montréal, Department of Neurosciences, Montreal, Quebec, Canada
Corresponding author: Nadia Gosselin, PhD
Center for Advanced Research in Sleep Medicine, Hôpital du Sacré-Cœur de Montréal 5400 Gouin Blvd. West, Room E-0330, Montreal, Quebec, H4J 1C5, Canada
Tel.: 514-338-2222, ext. 7717; Fax: 514-338-3893; Email: nadia.gosselin@umontreal.ca
Author’s contributions: Ms. Baril contributed to the study’s conception and design and to data
acquisition, analysis, and interpretation; she drafted the paper and revised it following the author’s comments. Ms. Gagnon and Ms. Brayet contributed to the study’s design, to data acquisition and interpretation, and to critical revision of the work. Drs. De Beaumont, Montplaisir, Lafond, Carrier, and Gagnon contributed to the study’s conception and to data interpretation, and revised the work critically. Mr. L’Heureux contributed to data acquisition and analysis, and revised the work critically. Dr. Gosselin contributed to the study’s conception and design and to data interpretation; she also helped draft the paper and revised it critically. All authors approved the final version for publication and are accountable for all aspects of the work.
Sources of support: This research was supported by the Canadian Institutes of Health Research
(CIHR, MOP123294) and by the Fonds de Recherche du Québec – Santé (FRQ-S). The CIHR supported Ms. Baril with a doctoral scholarship and Dr. Gagnon with an Investigator Salary Award. The FRQ-S also supported Ms. Brayet with a doctoral scholarship in addition to Drs. Gosselin, De Beaumont, and Carrier with a Salary Award. Dr. Gagnon holds a Canada Research Chair in Cognitive Decline in Pathological Aging and Dr. Montplaisir holds a Canada Research Chair in Sleep Medicine.
Running head:Gray matter increases with obstructive sleep apnea
Descriptor number: 15.9. Sleep Disordered Breathing: Outcomes Total word count: 3500 words
Date: December 1st
At a Glance Commentary:
Scientific Knowledge on the Subject: Older individuals with obstructive sleep apnea are at risk
of presenting cognitive decline and dementia. While previous studies investigated cerebral gray matter structure in obstructive sleep apnea, inconsistencies exist regarding the presence of changes and their specific locations in the brain. Furthermore, there is a lack of understanding regarding gray matter integrity in the aging population with obstructive sleep apnea since very few studies specifically evaluated this age group.
What This Study Adds to the Field: This study assessed the relationship between intrinsic
markers of obstructive sleep apnea severity and multiple measures of cerebral gray matter
structure in a large sample of middle-aged and older individuals. We found that the main markers of obstructive sleep apnea severity are related to increased thickness and/or volume of the frontal, parietal, and cingulate regions of the cortex as well as the amygdala. These results suggest that obstructive sleep apnea in the aging and mostly presymptomatic population is associated with underlying cerebral adaptive/reactive mechanisms.
This article has an online data supplement, which is accessible from this issue's table of content online at www.atsjournals.org
Abstract
Rationale: Obstructive sleep apnea causes intermittent hypoxemia, hemodynamic fluctuations, and sleep fragmentation, all of which could damage cerebral gray matter that can be indirectly assessed with neuroimaging.
Objectives: To investigate whether markers of obstructive sleep apnea severity are associated
with gray matter changes among middle-aged and older individuals.
Methods: Seventy-one subjects (ages: 55 to 76; apnea–hypopnea index: 0.2 to 96.6 events/h)
were evaluated with magnetic resonance imaging. Two techniques were used: 1) voxel-based morphometry, which measures gray matter volume and concentration; 2) FreeSurfer automated segmentation, which estimates the volume of predefined cortical/subcortical regions and cortical thickness. Regression analyses were performed between gray matter characteristics and markers of obstructive sleep apnea severity (hypoxemia, respiratory disturbances, sleep fragmentation).
Measurements and Main Results: Subjects had few symptoms, i.e. sleepiness, depression,
anxiety and cognitive deficits. While no association was found with voxel-based morphometry, FreeSurfer revealed increased gray matter with obstructive sleep apnea. Higher levels of hypoxemia correlated with increased volume and thickness of the left lateral prefrontal cortex as well as increased thickness of the right frontal pole, the right lateral parietal lobules, and the left posterior cingulate cortex. Respiratory disturbances positively correlated with right amygdala volume while more severe sleep fragmentation was associated with increased thickness of the inferior frontal gyrus.
Conclusions: Gray matter hypertrophy and thickening were associated with hypoxemia,
middle-aged and older individuals may represent adaptive/reactive brain mechanisms attributed to a presymptomatic stage of obstructive sleep apnea.
Keywords: Sleep-Disordered Breathing, Aging, Neuroimaging, Hypoxemia, Cerebral Cortex.
Main text
Introduction
Repetitive airway collapses in obstructive sleep apnea (OSA) lead to chronic cycles of hypoxemia/reoxygenation and hypercapnia, hemodynamic fluctuations, and sleep fragmentation (1). According to animal models, these pathophysiological processes have consequences on the brain by provoking oxidative stress, cellular death and cellular morphological modifications (2-4). Consequently, OSA may lead to structural cerebral gray matter changes. Considering that OSA is particularly common in the aging population (1) and is a risk factor for accelerated cognitive decline (5) and dementia (6), the relation between gray matter integrity and OSA severity in the older population must be assessed to deepen our understanding of its contribution to neurodegeneration.
In OSA, gray matter volume has been investigated predominantly in middle-aged adults using voxel-based morphometry (VBM). A recent meta-analysis showed that OSA correlates with a smaller parahippocampal and fronto-temporal cortex (7). However, due to variations between studies (e.g. VBM pipeline, apnea-hypopnea index [AHI] thresholds), others argue that there is currently no clear evidence of gray matter atrophy (8).
Since the sole use of VBM resulted in inconsistencies, its combination with alternative morphometric techniques could lead to a clearer picture of gray matter integrity in OSA. Few studies used other analysis techniques and gray matter characteristics. Regional cortical thinning and reduced gray matter concentration were reported in middle-aged individuals with OSA (9, 10). Moreover, segmentation of predefined subcortical structures in OSA individuals showed gray matter atrophy (hippocampi, mammillary bodies, caudate nuclei) (11-13) but also
hypertrophy (hippocampi, putamen) (14, 15).
It is unclear whether OSA leads to altered structural gray matter integrity. This is especially true in the older population with OSA for whom gray matter integrity has not been assessed thoroughly. The present study focuses on late middle-aged and older individuals, and investigates the association between OSA severity and gray matter characteristics estimated with different analysis techniques: volume and concentration measured with VBM; and cortical thickness and cortical/subcortical volume assessed with FreeSurfer automated segmentation. Instead of groups based on an arbitrary criterion to define OSA, we used a regression approach on a large sample with varying levels of OSA severity. The novelty of the study resides in the fact that it combines multiple analysis techniques and gray matter characteristics in association with multiple markers of OSA severity (hypoxemia, respiratory disturbances, and sleep fragmentation).
We hypothesized that all markers of OSA severity, but more particularly hypoxemia, would be linked to reduced gray matter in regions known to be sensitive to pathological processes observed in OSA (e.g. hippocampus and surrounding structures, prefrontal cortex) (1). We also hypothesized that an alternative method to VBM, namely FreeSurfer automated segmentation, could be more sensitive to reveal how OSA affects specific brain regions. Preliminary results have been previously reported in abstract form (16).
Methods
An online supplement describes the protocol in detail. The study included 71 subjects who were either healthy controls or newly diagnosed and untreated individuals with OSA. Thirty-seven of them (52%) participated in a previous study on cerebral perfusion in OSA (17). Ten subjects were recruited from a clinic for suspected OSA while the remaining subjects were
recruited through newspapers advertisements. Exclusion criteria were neurological, pulmonary, and major psychiatric diseases; sleep disorders other than OSA; OSA treatment including continuous positive airway pressure; uncontrolled diabetes and hypertension; morbid obesity; and medication affecting cerebral functioning. The Ethics Committees (#2012-697 and #12-13-008) approved the research protocol and written consent was obtained from each subject.
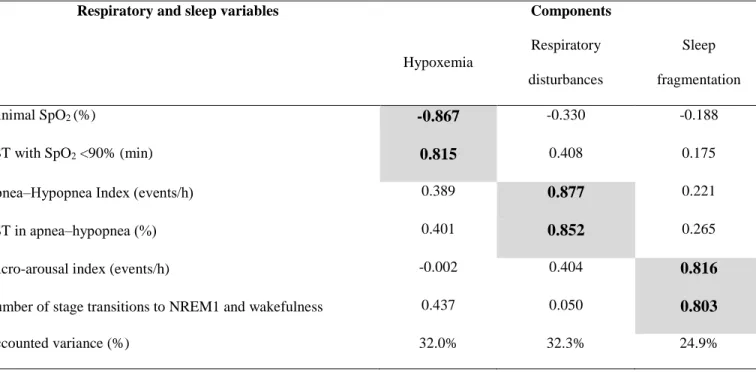
Subjects were evaluated with an all-night in-laboratory polysomnographic recording and 3-Tesla magnetic resonance imaging (MRI). Although the AHI is generally thought to represent OSA severity, its sole use has been challenged (18). Indeed, other variables related to oxygen saturation and sleep quality are also recognized as correlates of OSA severity. A principal component analysis was therefore used to extract independent markers of OSA severity, to reduce the number of statistical tests, and to prevent the multi-collinearity problem of highly correlated variables in a regression. Respiratory and sleep variables that strongly correlated with the AHI (p <0.001) were included in the principal component analysis. Although less-correlated variables could be of interest, they may not fully reflect OSA pathophysiology and are not as well suited for a principal component analysis. Resulting rotated and uncorrelated components represented hypoxemia, respiratory disturbances, and sleep fragmentation (see Table 1).
Figure 1 depicts the neuroimaging analysis techniques used, i.e., VBM and FreeSurfer automated segmentation. VBM was performed in accordance with published recommendations (8). T1-weighted MRI images were processed with the VBM8 toolbox (http://www.neuro.uni-jena.de/) within SPM8 (http://www.fil.ion.ucl.ac.uk/spm/software/spm8/). Default processing options were used to run the pipeline, including a spatial normalization that deformed every subject into a common space. The pipeline was run once with and once without modulation, which rescales images and transforms gray matter concentration into volume (19). A multiple regression design within SPM8 was performed between markers of OSA severity (hypoxemia,
respiratory disturbances, and sleep fragmentation) and both gray matter volume and concentration, adjusted for age, sex, body mass index, and intracranial volume. Level of significance was set at p <0.05, clusters corrected for multiple comparisons with topological false-discovery rate.
MRI images were also processed using FreeSurfer (http://surfer.nmr.mgh.harvard.edu/), which features the volumetric segmentation of subcortical structures (20) and the parcellation of the cortical surface (21) without a deforming spatial normalization. Cortical/subcortical volume and cortical thickness values from predefined brain regions were extracted for each subject. Hierarchical linear regressions for extracted FreeSurfer values were performed with age, sex, body mass index, and intracranial volume as covariates (Step 1) and with markers of OSA severity (hypoxemia, respiratory disturbances, and sleep fragmentation; Step 2). Level of significance was set at p <0.01 for R2 changes, i.e., the increase in variance explained by adding OSA variables to covariates, and p <0.01 for predicting markers of OSA severity.
Results
1. Clinical characteristics of the sample
Seventy-eight subjects were evaluated with an MRI. A neuroradiologist inspected the MRI images, which led to the exclusion of six subjects for major abnormalities such as silent infarcts or large arachnoid cysts. Another subject was excluded due to a processing problem, for a total of seven exclusions after the MRI.
The final sample was composed of 71 subjects ranging in age from 55 to 76 (mean age: 65.3 ± 5.6 years). Although the objective of the study was answered with a regression design
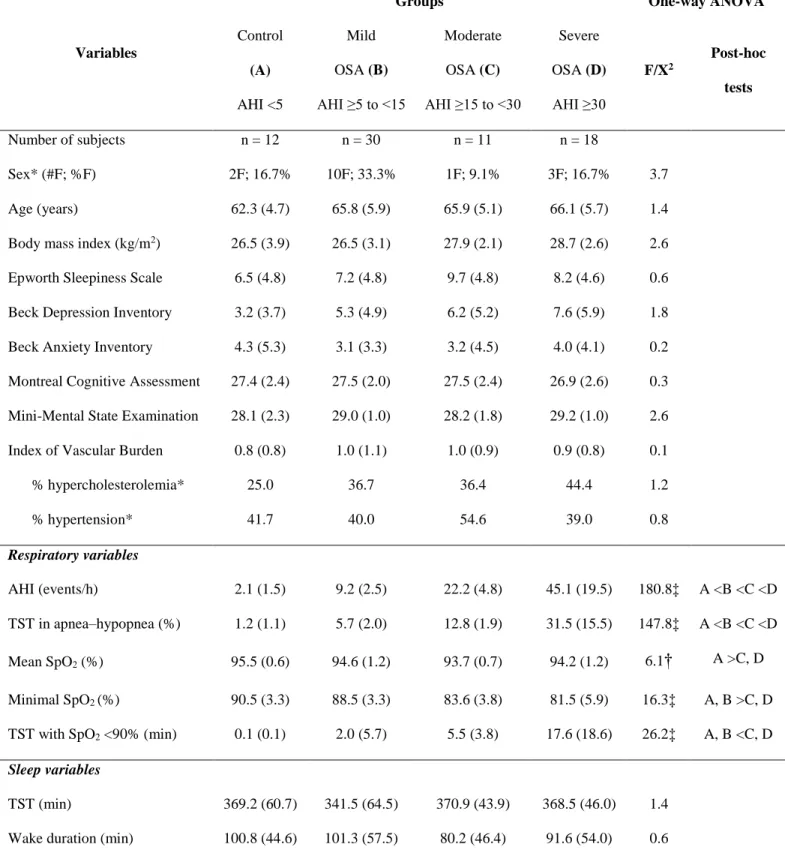
across the complete sample, subjects were divided into four groups based on their AHI and one-way ANOVAs were performed to better characterize our sample’ characteristics (see Table 2). Healthy control subjects (AHI <5) represented 17% of the sample, 42% were included in the mild OSA group (AHI between ≥5 and <15), 16% were included in the moderate OSA group (AHI between ≥15 and <30), and 25% were individuals considered to have severe OSA (AHI ≥30). The AHI varied from 0.2 to 96.6 events/h and 35% of the final sample had an OSA-related complaint and/or had suspected OSA before joining the study (e.g., snoring, daytime sleepiness, lack of energy, bed partner witnessing respiratory disturbances).
Groups were statistically comparable for the Epworth Sleepiness Scale, the Beck Depression and Anxiety Inventories, the Montreal Cognitive Assessment, the Mini-Mental State Examination, and the Index of Vascular Burden (see Table 2). Markers of OSA severity extracted with the principal component analysis (see Table 1) did not correlate with any of these questionnaires and tests. In fact, a minority of mild to severe OSA subjects had excessive daytime sleepiness (33% with Epworth Sleepiness ≥10), depressive symptoms (26% with Beck Depression Inventory II ≥10), anxiety symptoms (12% with Beck Anxiety Inventory ≥10) and cognitive deficits (16% with Montreal Cognitive Assessment <26). In summary, this suggests that our participants were not highly symptomatic in terms of sleepiness, mood, and global cognition, and that this symptomatology was not related to OSA severity. Moreover, a minority of OSA subjects was obese (25% with a body mass index ≥30 kg/m2) or had more than one cardiovascular risk factor and disease (31% with an Index of Vascular Burden >1).
2. Gray matter hypertrophy and thickening with OSA severity
VBM revealed no significant association between OSA severity and clusters of gray matter volume or concentration at a false-discovery rate corrected threshold (p <0.05).
revealed increases, but no decrease, in cortical thickness and volume associated with markers of OSA severity (see Table 3, Figure 2, and Figure E1 of the online supplement). The majority of significant models were of increased cortical thickness in relation to the level of hypoxemia. More severe hypoxemia was associated with increased thickness of the left rostral middle frontal gyrus, the right frontal pole, the right superior and inferior parietal lobules, and the left posterior cingulate cortex. Hypoxemia levels were also positively correlated with the volume of the left pars orbitalis portion of the inferior frontal gyrus. Moreover, higher levels of respiratory disturbances were associated with a hypertrophic right amygdala whereas an increased level of sleep fragmentation was correlated with a thicker pars triangularis region of the right inferior frontal gyrus.
3. Complementary results of gray matter hypertrophy and thickening with OSA severity
Interestingly, similar positive associations were observed at a trend level with FreeSurfer (R2 change between p <0.05 and p >0.01; predicting OSA components p <0.01; values between 0.24 and 0.40) for contralateral cortical regions in relation to hypoxemia levels (thickness of the right rostral middle frontal gyrus, left inferior parietal lobule, and right posterior cingulate cortex) as well as for subcortical regions in association with more respiratory disturbances (volume of the left amygdala, hippocampus, and thalamus).
To assess whether gray matter structure is associated with markers of OSA severity even in milder forms of OSA, analyses were conducted among control subjects and mild to moderate groups (AHI <30). With FreeSurfer, increased gray matter was found in relation to hypoxemia in several fronto-parietal regions and respiratory disturbances in left thalamus and precuneus (see online supplement).
Discussion
This study investigated the association between markers of OSA severity and gray matter integrity in untreated individuals aged 55 and over. We found that higher levels of hypoxemia during sleep were associated with increased volume and/or thickness of the prefrontal, parietal, and cingulate regions of the cortex. Moreover, a higher number of respiratory disturbances was associated with an enlarged amygdala whereas a more fragmented sleep was correlated to a thicker frontal cortex. Our hypothesis was only partially confirmed since we predicted that atrophied gray matter would be associated with increased OSA severity. The novelty of this study lies not only in its results, but also in the use of specific markers of OSA severity in relation with multiple cerebral gray matter characteristics.
1. Potential mechanisms underlying gray matter increases with OSA severity
It would be surprising that gray matter increases underlie better neuron viability or neurogenesis. Indeed, neurogenesis in the adult brain is less probable outside the hippocampus, the subventricular zone and the olfactory bulb (22). Gray matter hypertrophy and thickening may instead result from cerebral edema, a well-known effect of hypoxemia that can be observed after only 16 h in protocols imitating altitude in humans (23). Consistently, a diffusion MRI study in individuals with newly diagnosed OSA suggested the presence of vasogenic edema in subcortical structures (24). In addition to edema, hypoxia causes changes in cellular size or quantity with the potential to enlarged gray matter. In fact, studies on rodents subjected to intermittent hypoxia during their sleep (1 to 10 days and 5 weeks respectively) showed increased brain water content, branching of surviving neurons, as well as astroglial hyperplasia and/or hypertrophy (i.e., reactive gliosis) (3, 25). Increased gray matter in relation to hypoxemia levels could also be representative
of early neurodegeneration processes. Multiple animal models of hypoxic exposure (from few hours to several days) consistently showed increased -amyloid generation (1), a pathogenic mechanism of Alzheimer’s disease. -amyloid deposition in the absence of abnormal tau levels was recently reported to correlate with increased cortical thickness (26).
Overall, intermittent hypoxemia is probably a key mechanism leading to cerebral edema, cellular responses and early neurodegeneration in gray matter. This is consistent with our findings since most regions with increased gray matter were associated with hypoxemia levels. Similarly, hypoxemia strongly correlated with gray matter increases even when subjects with severe OSA were removed from the analysis, confirming that milder forms of OSA are also associated with gray matter changes in our sample. At the clinical level, it suggests that intermittent hypoxemia may be particularly important to consider when making decision for treatment, even in patients with AHI below 30.
In addition to the relationship between hypoxemia and gray matter characteristics, respiratory disturbances and sleep fragmentation were also associated with gray matter hypertrophy or thickening in the present study. Changes in breathing pattern due to obstructions and sleep fragmentation were shown to be both independently associated with blood pressure fluctuations (27, 28), which could lead to cerebral edema (29). Furthermore, experimental obstructive apneas and sleep fragmentation may distinctly provoke cellular responses through various mechanisms, such as cerebral oxidative stress (2, 4). However, the specific effects of respiratory disturbances and sleep fragmentation are less understood than the effects of intermittent hypoxemia.
2. Increases versus decreases of gray matter structure in OSA
OSA (7-13), gray matter hypertrophy has also been observed (14, 15, 30-32). The same pattern is shown with the effect of OSA treatment on gray matter. In one set of studies, treatment led to gray matter hypertrophy, suggesting a recovery from atrophic processes (33, 34), while others showed that OSA treatment reduced either regional gray matter or whole brain volume (31, 35), suggesting reversal of hypertrophic processes such as brain edema.
Increased gray matter may represent a presymptomatic stage of the OSA disease process where its severity is characterized by reactive and adaptive brain mechanisms, such as cerebral edema, reactive gliosis, neuronal branching, and increased -amyloid deposition. Later in the disease progression, gray matter atrophy could represent predominantly neuronal damage due to chronic OSA and lead to cognitive decline. Both adaptive and maladaptive effects on the brain have consistently been described for processes that follow cycles of airway obstructions and reoxygenation (36). Our sample had low levels of symptoms, namely sleepiness, mood and cognitive deficits, which reflect that most subjects were in a presymptomatic stage of OSA that may be characterized by more adaptive brain responses and thus, increased gray matter. Obviously, these hypotheses must be confirmed.
OSA duration might affect the balance between adaptive and maladaptive mechanisms, but it is generally unknown. In hypoxic rodent and human protocols that observed mechanisms that could underlie increased gray matter, exposure to hypoxia was relatively short (from a few hours to several days) (1, 3, 23, 25). Gray matter hypertrophy and thickening could therefore be present in an earlier stage of the disease, although duration of hypoxic exposure in rodent and human protocols is difficult to translate to OSA in a clinical setting.
Age could also determine whether atrophy or hypertrophy is observed in reaction to OSA. In fact, OSA in older adults is possibly different in terms of mechanisms, comorbidities, consequences, and symptoms compared to younger patients. Age is associated with partially
protective mechanisms against OSA, such as reduced production of oxidative stress following apneas (37) and decreased blood pressure and heart rate responses following arousals (38). Adaptive effects of hypoxia on the brain could lead to relative cerebrovascular protection and reduced mortality risk in subjects over age 50 with OSA compared to their younger counterparts (39). Therefore, a different response to OSA could occur with age and its severity may be correlated with increases in gray matter structure. Very few studies have specifically evaluated gray matter in subjects over age 50. These had very different designs and objectives, and thus, diverging results (40-42). Therefore, how OSA impacts the aging brain must be clarified.
3. Vulnerability of specific brain regions to OSA
In the present study, markers of OSA severity were associated with increased thickness or volume in the lateral prefrontal cortex, the parietal lobules, and posterior cingulate cortex as well as the amygdala. Interestingly, previous studies on OSA showed both increased and decreased gray matter volume and/or thickness in the same or adjacent regions as those reported in the present study (9, 11, 13-15, 30-32, 43, 44). Therefore, these regions may be especially vulnerable to OSA and be preferentially affected by both swelling and atrophic processes. It is also important to highlight that we found trends for association between OSA markers of severity and increased gray matter in contralateral brain regions. It would be interesting to follow this cohort in order to verify whether these trends will reach significance over time.
Hypoxemia and sleep fragmentation correlated with the structure of the lateral prefrontal cortex in our study. It has been suggested that the prefrontal cortex is vulnerable to both hypoxemia and sleep disruption in OSA (45). In addition, our results showed that hypoxemia was associated with core constituents of the default mode network, namely the parietal and posterior cingulate regions of the cortex. The metabolic activity of these highly connected regions
fluctuates together (46) and their elevated oxygen demand could make them more vulnerable to hypoxemia (47). Finally, we found that amygdala volume was linked to respiratory disturbances, which is consistent with its altered activity during a respiratory challenge in OSA subjects (48).
4. Utility of complementary gray matter analysis techniques and characteristics
While the most widely used technique for gray matter analysis is VBM, we observed no changes with this method, a result supported by previous studies on OSA (35, 49). VBM has limitations including misregistration and reduced accuracy of region location (19). This might be exacerbated by ventricular expansion caused by global atrophy in normal aging, in which processing errors could lead to false results in regions surrounding the ventricles. FreeSurfer automated segmentation may be more sensitive in detecting early changes in OSA than a voxel-based approach, since volume and thickness are computed by region without a prior spatial normalization. Instead, the brain is labeled and segmented in an automated manner similar to manual volumetry (20, 21), which probably represent more closely the real structure. However, FreeSurfer automated segmentation is time-consuming and depends on predefined atlases.
VBM and FreeSurfer segmentation show results on different scales. While VBM investigates the brain voxel by voxel (1.5 mm3), the predefined regions extracted with FreeSurfer are much larger. This suggests that increases in gray matter with OSA severity are subtle and diffuse across a given brain structure, which could have been missed in some previous VBM studies. In addition, more regions of increased thickness than volume were observed with FreeSurfer, a result that may also have been missed with VBM. Overall, FreeSurfer automated segmentation and its measurement of cortical thickness seems to be more sensitive to detect gray matter increases with OSA severity than VBM. However, our results must be replicated by further studies in the older population with OSA.
5. Strengths and limitations
Our large sample size of 71 subjects with an AHI varying from 0.2 to 96.6 events/h represent the entire spectrum of OSA severity, which allowed a regression approach. This eliminated the need for an arbitrary criterion to define the presence of the condition that is necessary for a between-group design, leading to inconsistencies between studies. A regression design also allowed us to investigate different markers of OSA severity. Moreover, the use of different analysis techniques and gray matter characteristics yielded a more complete evaluation of gray matter in OSA.
Nonetheless, the fact that most of our subjects were not severely hypoxic (see Table 2) and were mostly presymptomatic restricts the generalization of our results to other individuals with OSA. Although our strict exclusion criteria facilitate the interpretation of our findings by excluding many confounding conditions, they could limit the generalization of our results to individuals presenting OSA and comorbidities.
Although we included sex as a nuisance covariate, women with OSA may present more maladaptive than adaptive cerebral processes. In fact, compared to males with comparable OSA severity, females have impaired white matter integrity (50). Since we investigated only 16 females (23% of our sample), this could explain the difference between our results and the study by Celle et al. (40), which showed brainstem atrophy among mostly women (64%) in a similar age group.
6. Conclusions
Our study revealed that markers of OSA severity, i.e. hypoxemia, respiratory disturbances, and sleep fragmentation, are linked to increases in cortical thickness and gray matter volume that are more sensitively detected with a technique alternative to VBM, namely FreeSurfer automated
and thickening through local edema and reactive cellular responses. These structural changes in frontal, parietal, and cingulate regions of the cortex and in the amygdala may be possible in presymptomatic and/or older subjects with OSA, among whom more adaptive than maladaptive mechanisms may occur. Longitudinal investigations are needed to determine whether increased gray matter structure will later show atrophy and be associated with cognitive decline in order to deepen our understanding of the link between OSA and neurodegeneration in the aging population.
Acknowledgements
The authors wish to thank Hélène Blais, Caroline d’Aragon, Caroline Arbour, Christophe Bedetti, Jean Paquet, Dominique Petit, Joëlle Robert, Sarah-Hélène Julien, Maria Tuineag, Maxime Fortin, Marc-André D. Gareau, Erlan Sanchez, Danielle Gilbert, Carollyn Hurst, and André Cyr for their help with subject recruitment, data collection, and contribution to statistical analyses.
References
1. Daulatzai MA. Evidence of neurodegeneration in obstructive sleep apnea: Relationship between obstructive sleep apnea and cognitive dysfunction in the elderly. J Neurosci Res 2015; 93: 1778-1794.
2. Almendros I, Farre R, Planas AM, Torres M, Bonsignore MR, Navajas D, Montserrat JM. Tissue oxygenation in brain, muscle, and fat in a rat model of sleep apnea: differential effect of obstructive apneas and intermittent hypoxia. Sleep 2011; 34: 1127-1133. 3. Aviles-Reyes RX, Angelo MF, Villarreal A, Rios H, Lazarowski A, Ramos AJ. Intermittent
hypoxia during sleep induces reactive gliosis and limited neuronal death in rats: implications for sleep apnea. J Neurochem 2010; 112: 854-869.
4. Nair D, Dayyat EA, Zhang SX, Wang Y, Gozal D. Intermittent hypoxia-induced cognitive deficits are mediated by NADPH oxidase activity in a murine model of sleep apnea. PLoS
One 2011; 6: e19847.
5. Osorio RS, Gumb T, Pirraglia E, Varga AW, Lu SE, Lim J, Wohlleber ME, Ducca EL, Koushyk V, Glodzik L, Mosconi L, Ayappa I, Rapoport DM, de Leon MJ, Alzheimer's Disease Neuroimaging I. Sleep-disordered breathing advances cognitive decline in the elderly. Neurology 2015; 84: 1964-1971.
6. Chang WP, Liu ME, Chang WC, Yang AC, Ku YC, Pai JT, Huang HL, Tsai SJ. Sleep apnea and the risk of dementia: a population-based 5-year follow-up study in Taiwan. PLoS One 2013; 8: e78655.
7. Weng HH, Tsai YH, Chen CF, Lin YC, Yang CT, Tsai YH, Yang CY. Mapping gray matter reductions in obstructive sleep apnea: an activation likelihood estimation meta-analysis.
8. Celle S, Delon-Martin C, Roche F, Barthelemy JC, Pepin JL, Dojat M. Desperately seeking grey matter volume changes in sleep apnea: A methodological review of magnetic
resonance brain voxel-based morphometry studies. Sleep medicine reviews 2016; 25: 112-120.
9. Joo EY, Jeon S, Kim ST, Lee JM, Hong SB. Localized cortical thinning in patients with obstructive sleep apnea syndrome. Sleep 2013; 36: 1153-1162.
10. Joo EY, Tae WS, Lee MJ, Kang JW, Park HS, Lee JY, Suh M, Hong SB. Reduced brain gray matter concentration in patients with obstructive sleep apnea syndrome. Sleep 2010; 33: 235-241.
11. Dusak A, Ursavas A, Hakyemez B, Gokalp G, Taskapilioglu O, Parlak M. Correlation
between hippocampal volume and excessive daytime sleepiness in obstructive sleep apnea syndrome. Eur Rev Med Pharmacol Sci 2013; 17: 1198-1204.
12. Kumar R, Birrer BV, Macey PM, Woo MA, Gupta RK, Yan-Go FL, Harper RM. Reduced mammillary body volume in patients with obstructive sleep apnea. Neuroscience letters 2008; 438: 330-334.
13. Torelli F, Moscufo N, Garreffa G, Placidi F, Romigi A, Zannino S, Bozzali M, Fasano F, Giulietti G, Djonlagic I, Malhotra A, Marciani MG, Guttmann CR. Cognitive profile and brain morphological changes in obstructive sleep apnea. Neuroimage 2011; 54: 787-793. 14. Kumar R, Farahvar S, Ogren JA, Macey PM, Thompson PM, Woo MA, Yan-Go FL, Harper RM. Brain putamen volume changes in newly-diagnosed patients with obstructive sleep apnea. NeuroImage Clinical 2014; 4: 383-391.
15. Rosenzweig I, Kempton MJ, Crum WR, Glasser M, Milosevic M, Beniczky S, Corfield DR, Williams SC, Morrell MJ. Hippocampal hypertrophy and sleep apnea: a role for the
16. Baril AA, Gagnon K, Brayet P, Montplaisir J, de Beaumont L, Carrier J, Lafond C, L'Heureux F, Gagnon JF, Gosselin N. Increased gray matter volume and cortical thickness with markers of obstructive sleep apnea severity in middle-aged and older adults [abstract]. J Sleep Res 2016; 25: 259.
17. Baril AA, Gagnon K, Arbour C, Soucy JP, Montplaisir J, Gagnon JF, Gosselin N. Regional Cerebral Blood Flow during Wakeful Rest in Older Subjects with Mild to Severe Obstructive Sleep Apnea. Sleep 2015; 38: 1439-1449.
18. Asghari A, Mohammadi F. Is Apnea-Hypopnea Index a proper measure for Obstructive Sleep Apnea severity? Med J Islam Repub Iran 2013; 27: 161-162.
19. Mechelli A, Price CJ, Friston KJ, Ashburner J. Voxel-based morphometry of the human brain: Methods and applications. Curr Med Imaging Rev 2005; 1: 105-113.
20. Fischl B, Salat DH, Busa E, Albert M, Dieterich M, Haselgrove C, van der Kouwe A, Killiany R, Kennedy D, Klaveness S, Montillo A, Makris N, Rosen B, Dale AM. Whole brain segmentation: automated labeling of neuroanatomical structures in the human brain.
Neuron 2002; 33: 341-355.
21. Fischl B, van der Kouwe A, Destrieux C, Halgren E, Segonne F, Salat DH, Busa E, Seidman LJ, Goldstein J, Kennedy D, Caviness V, Makris N, Rosen B, Dale AM. Automatically parcellating the human cerebral cortex. Cereb Cortex 2004; 14: 11-22.
22. Riddle DR, Lichtenwalner RJ. Neurogenesis in the Adult and Aging Brain. In: Riddle DR, editor. Brain Aging: Models, Methods, and Mechanisms. Boca Raton (FL); 2007. 23. Kallenberg K, Bailey DM, Christ S, Mohr A, Roukens R, Menold E, Steiner T, Bartsch P,
Knauth M. Magnetic resonance imaging evidence of cytotoxic cerebral edema in acute mountain sickness. J Cereb Blood Flow Metab 2007; 27: 1064-1071.
24. Emin Akkoyunlu M, Kart L, Kilicarslan R, Bayram M, Aralasmak A, Sharifov R, Alkan A. Brain diffusion changes in obstructive sleep apnoea syndrome. Respiration; international
review of thoracic diseases 2013; 86: 414-420.
25. Baronio D, Martinez D, Fiori CZ, Bambini-Junior V, Forgiarini LF, Pase da Rosa D, Kim LJ, Cerski MR. Altered aquaporins in the brains of mice submitted to intermittent hypoxia model of sleep apnea. Respir Physiol Neurobiol 2013; 185: 217-221.
26. Fortea J, Vilaplana E, Alcolea D, Carmona-Iragui M, Sanchez-Saudinos MB, Sala I, Anton-Aguirre S, Gonzalez S, Medrano S, Pegueroles J, Morenas E, Clarimon J, Blesa R, Lleo A, Alzheimer's Disease Neuroimaging I. Cerebrospinal fluid beta-amyloid and phospho-tau biomarker interactions affecting brain structure in preclinical Alzheimer disease. Ann
Neurol 2014; 76: 223-230.
27. Chouchou F, Pichot V, Pepin JL, Tamisier R, Celle S, Maudoux D, Garcin A, Levy P, Barthelemy JC, Roche F, Group PS. Sympathetic overactivity due to sleep fragmentation is associated with elevated diurnal systolic blood pressure in healthy elderly subjects: the PROOF-SYNAPSE study. Eur Heart J 2013; 34: 2122-2131, 2131a.
28. Orban M, Bruce CJ, Pressman GS, Leinveber P, Romero-Corral A, Korinek J, Konecny T, Villarraga HR, Kara T, Caples SM, Somers VK. Dynamic changes of left ventricular performance and left atrial volume induced by the mueller maneuver in healthy young adults and implications for obstructive sleep apnea, atrial fibrillation, and heart failure.
Am J Cardiol 2008; 102: 1557-1561.
29. Skalidi SJ, Manios ED, Stamatelopoulos KS, Barlas G, Michas F, Toumanidis ST, Vemmos KN, Zakopoulos NA. Brain edema formation is associated with the time rate of blood pressure variation in acute stroke patients. Blood Press Monit 2013; 18: 203-207.
30. Fatouleh RH, Hammam E, Lundblad LC, Macey PM, McKenzie DK, Henderson LA,
Macefield VG. Functional and structural changes in the brain associated with the increase in muscle sympathetic nerve activity in obstructive sleep apnoea. NeuroImage Clinical 2014; 6: 275-283.
31. Lin WC, Huang CC, Chen HL, Chou KH, Chen PC, Tsai NW, Chen MH, Friedman M, Lin HC, Lu CH. Longitudinal brain structural alterations and systemic inflammation in obstructive sleep apnea before and after surgical treatment. J Transl Med 2016; 14: 139. 32. Lundblad LC, Fatouleh RH, Hammam E, McKenzie DK, Macefield VG, Henderson LA.
Brainstem changes associated with increased muscle sympathetic drive in obstructive sleep apnoea. Neuroimage 2014; 103: 258-266.
33. Rosenzweig I, Glasser M, Crum WR, Kempton MJ, Milosevic M, McMillan A, Leschziner GD, Kumari V, Goadsby P, Simonds AK, Williams SC, Morrell MJ. Changes in Neurocognitive Architecture in Patients with Obstructive Sleep Apnea Treated with Continuous Positive Airway Pressure. EBioMedicine 2016; 7: 221-229.
34. Canessa N, Castronovo V, Cappa SF, Aloia MS, Marelli S, Falini A, Alemanno F, Ferini-Strambi L. Obstructive sleep apnea: brain structural changes and neurocognitive function before and after treatment. Am J Respir Crit Care Med 2011; 183: 1419-1426.
35. O'Donoghue FJ, Briellmann RS, Rochford PD, Abbott DF, Pell GS, Chan CH, Tarquinio N, Jackson GD, Pierce RJ. Cerebral structural changes in severe obstructive sleep apnea. Am
J Respir Crit Care Med 2005; 171: 1185-1190.
36. Rosenzweig I, Glasser M, Polsek D, Leschziner GD, Williams SC, Morrell MJ. Sleep apnoea and the brain: a complex relationship. Lancet Respir Med 2015; 3: 404-414.
37. Dalmases M, Torres M, Marquez-Kisinousky L, Almendros I, Planas AM, Embid C, Martinez-Garcia MA, Navajas D, Farre R, Montserrat JM. Brain tissue hypoxia and
oxidative stress induced by obstructive apneas is different in young and aged rats. Sleep 2014; 37: 1249-1256.
38. Goff EA, O'Driscoll DM, Simonds AK, Trinder J, Morrell MJ. The cardiovascular response to arousal from sleep decreases with age in healthy adults. Sleep 2008; 31: 1009-1017. 39. Lavie L, Lavie P. Ischemic preconditioning as a possible explanation for the age decline
relative mortality in sleep apnea. Med Hypotheses 2006; 66: 1069-1073.
40. Celle S, Peyron R, Faillenot I, Pichot V, Alabdullah M, Gaspoz JM, Laurent B, Barthelemy JC, Roche F. Undiagnosed sleep-related breathing disorders are associated with focal brainstem atrophy in the elderly. Hum Brain Mapp 2009; 30: 2090-2097.
41. Dalmases M, Sole-Padulles C, Torres M, Embid C, Nunez MD, Martinez-Garcia MA, Farre R, Bargallo N, Bartres-Faz D, Montserrat JM. Effect of CPAP on Cognition, Brain Function, and Structure Among Elderly Patients With OSA: A Randomized Pilot Study.
Chest 2015; 148: 1214-1223.
42. Sforza E, Celle S, Saint-Martin M, Barthelemy JC, Roche F. Hippocampus volume and subjective sleepiness in older people with sleep-disordered breathing: a preliminary report. J Sleep Res 2016; 25: 190-193.
43. Macey PM, Henderson LA, Macey KE, Alger JR, Frysinger RC, Woo MA, Harper RK, Yan-Go FL, Harper RM. Brain morphology associated with obstructive sleep apnea. Am J
Respir Crit Care Med 2002; 166: 1382-1387.
44. Zhang Q, Wang D, Qin W, Li Q, Chen B, Zhang Y, Yu C. Altered resting-state brain activity in obstructive sleep apnea. Sleep 2013; 36: 651-659B.
45. Beebe DW, Gozal D. Obstructive sleep apnea and the prefrontal cortex: towards a
46. Passow S, Specht K, Adamsen TC, Biermann M, Brekke N, Craven AR, Ersland L, Gruner R, Kleven-Madsen N, Kvernenes OH, Schwarzlmuller T, Olesen R, Hugdahl K. A close link between metabolic activity and functional connectivity in the resting human brain [abstract]. EJNMMI Phys 2015; 2: A78.
47. Raichle ME, MacLeod AM, Snyder AZ, Powers WJ, Gusnard DA, Shulman GL. A default mode of brain function. Proc Natl Acad Sci U S A 2001; 98: 676-682.
48. Harper RM, Macey PM, Henderson LA, Woo MA, Macey KE, Frysinger RC, Alger JR, Nguyen KP, Yan-Go FL. fMRI responses to cold pressor challenges in control and obstructive sleep apnea subjects. J Appl Physiol (1985) 2003; 94: 1583-1595. 49. Innes CR, Kelly PT, Hlavac M, Melzer TR, Jones RD. Decreased Regional Cerebral
Perfusion in Moderate-Severe Obstructive Sleep Apnoea during Wakefulness. Sleep 2015; 38: 699-706.
50. Macey PM, Kumar R, Yan-Go FL, Woo MA, Harper RM. Sex differences in white matter alterations accompanying obstructive sleep apnea. Sleep 2012; 35: 1603-1613.
Figure Legends
Figure 1. Processing steps for estimating gray matter characteristics using VBM (A) and FreeSurfer (B). T1-weighted MRI images were used for both VBM and FreeSurfer analyses. In
order to conduct VBM analyses (A), images were first segmented and normalized into a common space. A non-linear modulation was performed to obtain volume and final volume and concentration images were smoothed. In summary, the VBM processing pipeline segments and deforms gray matter to allow inter-subject comparisons for both gray matter concentration and
registration was performed. The brain was segmented according to voxel intensities and a probabilistic atlas to extract subcortical volumes. White- and gray matter boundaries were traced and the cortex was parcelled and labeled based on folding pattern and a probabilistic atlas. Thus, FreeSurfer outputs are undeformed cortical/subcortical volume as well as cortical thickness of regions predefined by built-in atlases. Overall, both analysis techniques work differently to estimate gray matter characteristics: with VBM, the brain was deformed and gray matter was compare at each voxel. With FreeSurfer automated segmentation, gray matter values are averaged over regions labeled in the undeformed brain according to built-in atlases. VBM images and FreeSurfer extracted values correspond to final processed variables used in multiple regression analyses with markers of OSA severity. FWHM, full-width half maximum; MRI, magnetic resonance imaging; VBM, voxel-based morphometry; OSA, obstructive sleep apnea.
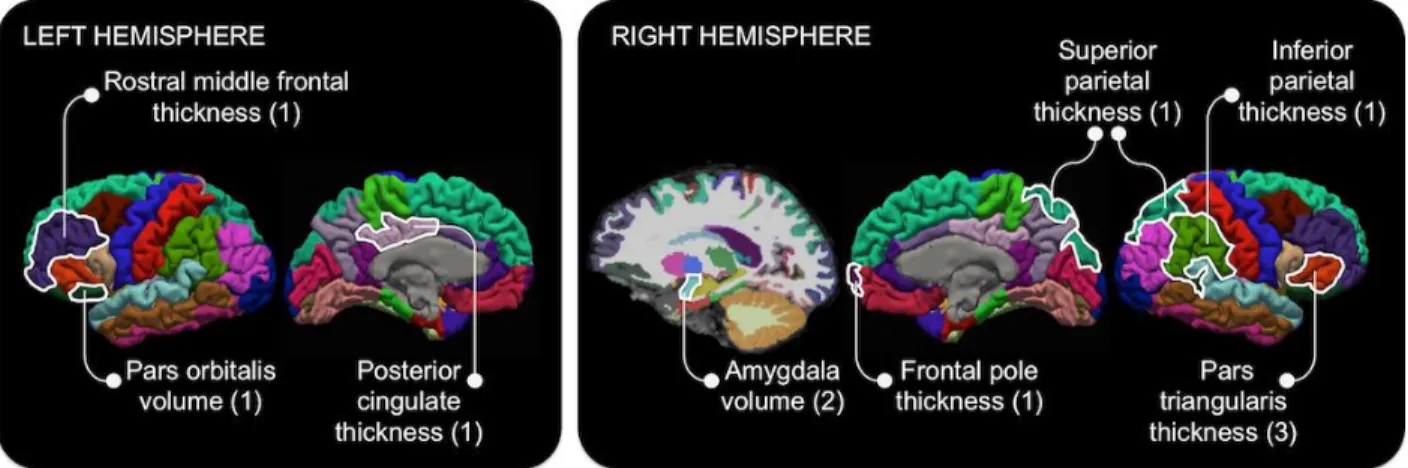
Figure 2. Locations of increased gray matter estimated with FreeSurfer automated segmentation in association with markers of OSA severity. Hypoxemia [1] was positively
correlated with the volume of the left pars orbitalis of the inferior frontal gyrus and the thickness of the left rostral middle frontal gyrus, the left posterior cingulate cortex, and the right frontal pole, as well as the right superior and inferior parietal lobules. Moreover, higher levels of
respiratory disturbances [2] were associated with a larger right amygdala while more severe sleep fragmentation [3] was correlated with an increased thickness of the right pars triangularis of the inferior frontal gyrus. Regression analyses included age, sex, body mass index, and intracranial volume as nuisance covariates. OSA, obstructive sleep apnea.
Footnotes
Footnotes for Table 1.
Bold variables show how variable loads on each rotated component. Loadings >0.5 were considered to be variables that contribute the most to the component. OSA, obstructive sleep apnea; SpO2, oxygen saturation; TST, total sleep time; NREM1, non-rapid eye movement sleep
stage 1.
Footnotes for Table 2.
Results are presented as mean (standard deviation). OSA, obstructive sleep apnea; AHI, apnea– hypopnea index; F, females; TST, total sleep time; SpO2, oxygen saturation; NREM1, non-rapid
eye movement sleep stage 1. * X2 tests were performed between groups; † p <0.05; ‡ p <0.001.
Footnotes for Table 3.
Bold variables show the predicting OSA component for each region of increased gray matter. OSA, obstructive sleep apnea; BMI, body mass index; ICV, intracranial volume; ΔR2; R2 change; R, right; L, left. *p <0.01; †p <0.005.
Tables
Table 1. Markers of OSA severity obtained with a principal component analysis of respiratory
and sleep variables.
Respiratory and sleep variables Components
Hypoxemia Respiratory disturbances Sleep fragmentation Minimal SpO2 (%) -0.867 -0.330 -0.188
TST with SpO2 <90% (min) 0.815 0.408 0.175
Apnea‒Hypopnea Index (events/h) 0.389 0.877 0.221
TST in apnea‒hypopnea (%) 0.401 0.852 0.265
Micro-arousal index (events/h) -0.002 0.404 0.816
Number of stage transitions to NREM1 and wakefulness 0.437 0.050 0.803
Table 2. Clinical and polysomnographic characteristics of healthy control, mild, moderate and
severe OSA groups.
Variables
Groups One-way ANOVA
Control (A) AHI <5 Mild OSA (B) AHI ≥5 to <15 Moderate OSA (C) AHI ≥15 to <30 Severe OSA (D) AHI ≥30 F/X2 Post-hoc tests Number of subjects n = 12 n = 30 n = 11 n = 18 Sex* (#F; %F) 2F; 16.7% 10F; 33.3% 1F; 9.1% 3F; 16.7% 3.7 Age (years) 62.3 (4.7) 65.8 (5.9) 65.9 (5.1) 66.1 (5.7) 1.4
Body mass index (kg/m2) 26.5 (3.9) 26.5 (3.1) 27.9 (2.1) 28.7 (2.6) 2.6
Epworth Sleepiness Scale 6.5 (4.8) 7.2 (4.8) 9.7 (4.8) 8.2 (4.6) 0.6
Beck Depression Inventory 3.2 (3.7) 5.3 (4.9) 6.2 (5.2) 7.6 (5.9) 1.8
Beck Anxiety Inventory 4.3 (5.3) 3.1 (3.3) 3.2 (4.5) 4.0 (4.1) 0.2
Montreal Cognitive Assessment 27.4 (2.4) 27.5 (2.0) 27.5 (2.4) 26.9 (2.6) 0.3
Mini-Mental State Examination 28.1 (2.3) 29.0 (1.0) 28.2 (1.8) 29.2 (1.0) 2.6
Index of Vascular Burden 0.8 (0.8) 1.0 (1.1) 1.0 (0.9) 0.9 (0.8) 0.1
% hypercholesterolemia* 25.0 36.7 36.4 44.4 1.2 % hypertension* 41.7 40.0 54.6 39.0 0.8 Respiratory variables AHI (events/h) 2.1 (1.5) 9.2 (2.5) 22.2 (4.8) 45.1 (19.5) 180.8‡ A <B <C <D TST in apnea–hypopnea (%) 1.2 (1.1) 5.7 (2.0) 12.8 (1.9) 31.5 (15.5) 147.8‡ A <B <C <D Mean SpO2 (%) 95.5 (0.6) 94.6 (1.2) 93.7 (0.7) 94.2 (1.2) 6.1† A >C, D Minimal SpO2 (%) 90.5 (3.3) 88.5 (3.3) 83.6 (3.8) 81.5 (5.9) 16.3‡ A, B >C, D
TST with SpO2 <90% (min) 0.1 (0.1) 2.0 (5.7) 5.5 (3.8) 17.6 (18.6) 26.2‡ A, B <C, D
Sleep variables
TST (min) 369.2 (60.7) 341.5 (64.5) 370.9 (43.9) 368.5 (46.0) 1.4
Sleep efficiency (%) 78.5 (9.0) 77.2 (12.6) 82.6 (9.1) 80.6 (10.0) 0.8
Micro-arousal index (events/h) 12.0 (3.9) 14.3 (6.1) 14.3 (5.7) 25.2 (11.2) 8.8‡ A, B, C <D
# of stage transitions to NREM1 and wakefulness
Table 3. Significant hierarchical linear regressions between markers of OSA severity and regions
of increased gray matter volume and thickness segmented automatically with FreeSurfer.
Brain regions
Step 1: Nuisance covariates
Age Sex BMI ICV
Step 2: OSA severity Hypoxemia Respiratory disturbances Sleep fragmentation Subcortical volume R amygdala R2 31.9%† 47.9%† ΔR2 16.0%† -0.07 0.01 0.05 0.52† -0.06 0.39† 0.16 Cortical volume L pars orbitalis (inferior frontal) R2 11.8% 30.0%† ΔR2 18.3%† -0.03 0.05 -0.08 0.30 0.44† -0.02 -0.12 Cortical thickness L rostral middle frontal gyrus R2 8.9% 29.4%† ΔR2 20.5%† -0.24 -0.02 0.11 -0.23 0.47† 0.13 0.02 R frontal pole R2 0.0% 19.1% ΔR2 18.8%† 0.00 -0.00 0.03 -0.06 0.45† 0.11 0.03 R pars triangularis (inferior frontal) R2 6.5% 22.9% ΔR2 16.5%* -0.16 0.11 0.18 -0.15 0.23 0.17 0.32* R superior parietal lobule R2 7.7% 24.3% ΔR2 16.7%* -0.11 0.03 0.22 0.04 0.40† 0.17 0.09 R inferior R2 3.8% 20.8%
parietal lobule ΔR2 17.0%* -0.17 0.00 0.09 -0.08 0.43† 0.13 -0.08 L posterior cingulate cortex R2 5.9% 23.7% ΔR2 17.8%† -0.08 -0.18 0.15 -0.03 0.36† 0.29 0.08