HAL Id: hal-01522067
https://hal-enac.archives-ouvertes.fr/hal-01522067
Submitted on 12 May 2017
HAL is a multi-disciplinary open access
archive for the deposit and dissemination of
sci-entific research documents, whether they are
pub-lished or not. The documents may come from
teaching and research institutions in France or
abroad, or from public or private research centers.
L’archive ouverte pluridisciplinaire HAL, est
destinée au dépôt et à la diffusion de documents
scientifiques de niveau recherche, publiés ou non,
émanant des établissements d’enseignement et de
recherche français ou étrangers, des laboratoires
publics ou privés.
Cognitive Maps Exploration trough Kernel Density
Estimation
Antoine Lhuillier, Christophe Hurter, Hélène Amieva, Emmanuel J Barbeau,
Christophe Jouffrais
To cite this version:
Antoine Lhuillier, Christophe Hurter, Hélène Amieva, Emmanuel J Barbeau, Christophe Jouffrais.
Cognitive Maps Exploration trough Kernel Density Estimation. IEEE VIS Workshop Visualizing
Electronic Health Record Data (EHRVis 2014), University of Maryland; Vienna University of
Tech-nology, Nov 2014, Paris, France. �hal-01522067�
Cognitive Maps Exploration trough Kernel Density Estimation
A. Lhuillier, C. Hurter, H. Amieva, E. Barbeau, C. Jouffrais
Abstract—Curently approximately 860,000 people are affected by Alzheimer's disease in France. This is why the study of Alzheimer’s disease has been identified as a major societal challenge. In the PAQUID cohort study, subjects performed a lexical evocation task by saying the maximum number of city names within 3 minutes. This task is directly related to the concept of cognitive map. The analysis of the list created by this task provides a unique opportunity to study the spatial mental representation of geographical space for elderly people before and after developing the dementia. We visualized graphs of this list by connecting cited city with a line. Since these graphs become cluttered with numerous lines, we applied the KDEEB bundling technique. We then compared graphs representing different periods before and after dementia. Our first results show that graph complexity is related to aging, as well as the clinical status of the subject. The ultimate goal of the project is to develop techniques and tools to study the cognitive maps of elderly subjects in the years preceding Alzheimer's disease. The tools that will be develloped shall rely on image based technique (e.g. bundling) and help to better detect and understand the evolution of Alzheimer's disease.
Index Terms—Large Data Visualization,Bundling, Cognitive map, PAQUID, Alzheimer disease
IN TR O DU C TI O N
In this position paper, we will report a new usage of edge bundling technique with the Memory project. This project will begin in September 2014 and will involve neuroscientists and computer graphics experts collaborating.
According to a ministerial review of 2004, approximately 860,000 people are affected by Alzheimer’s disease in France. This estimation will possibly reach 1.3 million in 2020 and 2.1 million in 2040. This is why the study of Alzheimer’s disease has been identified as a major society challenge. In the PAQUID cohort study, 3777 elderly people performed a lexical evocation task by saying the maximum number of city names within 3 minutes. They were longitudinally followed during a 22 year period and some of them developed Alzheimer’s disease (AD). The PAQUID project also contains many other Electronic Health Record (EHR) and has been used to extract relevant information [3] [7] [1] regarding personal health.
The results of the PAQUID project are an excellent occasion for studying both the effects of aging on the human brain through the cognitive map of each person, with a transversal study, and modification during the progression in Alzheimer’s dementia, longitudinal study. However, the lack of available visualization tools for medical doctors has not allowed them to yet fully analyze the PAQUID results.
1 CO G NI T IV E MAPS EXP L O R AT I ON
1.1 Cognitive Maps
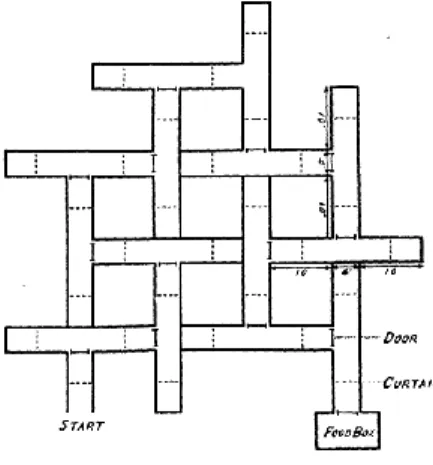
The concept of cognitive map was introduced in 1948 by Edward Tolman in his article “Cognitive maps in rats and men” and echoed by O’Keefe and Nadel in their book “the hippocampus as a cognitive map” published in 1978. Tolman’s [8] suggested that a rat placed in a labyrinth in order to find his food (Figure 1) build a mental representation of this labyrinth rather than answering to a flow of internal and external stimuli. This mental representation allows new
and complex behavior [8] (for example changing route when the usual one is blocked).
A cognitive map is then considered, among other things, as a sort of matrix in which the episodes of life can be recorded to be then accessed when needed by mental processes [4]. What’s interesting is that according to the authors, hippocampic lesions distort spatial “imaging” [5].
Formally, cognitive mapping is “the capacity of a subject to reorganize spatial information in order to develop cognitive representation of the environment beyond its field of perception”. It allows to mentally co-localizing several points in an organized and coherent configuration. It is an allocentric (or exocentric, depending on the authors) representation of space, i.e. independent from the subject position or point of view. To build a cognitive map, one may need to create a subjective representation of space with a frame of reference, as well as a processing task. Historically and as opposed as the behaviorist point of view, cognitive map is the ultimate mental representation of space.
The PAQUID data is a reservoir to visualize and analyze verbal renderings of individual cognitive maps, as well as their evolution in time and during Alzheimer’s disease.
1.2 PAQUID Electronic Health Record database
The PAQUID project is a population cohort study in which 3777 people aged 65 or more are involved. This study aims to evaluate the medical, cognitive and functional levels of those people through their lifetime; the study has been ongoing for the past 22 years. During those years, some of the subjects have developed Alzheimer’s
A. Lhuillier and C. Hurter are with LII-ENAC/University of Toulouse, France. E-mail: antoine.lhuillier@gmail.com, christophe.hurter@enac.fr
E. Bardeau is with CNRS and CERCO, France. emmanuel.barbeau@cerco.ups-tlse.fr
C. Jouffrais is with IRIT-UMR5505, CNRS & Univ Toulouse, France. E-mail: Christophe.Jouffrais@irit.fr
H. Amieva is with CNRS, France. E-mail: Helene.Amieva@isped.u-bordeaux2.fr.
Proc. of IEEE VIS 2014 Workshop on Visualization of Electronic Health Records. Copyright retained by the authors.
dementia as confirmed by clinical tests with psychologists and a physicians.
During this study, patients have been subjected to a variety of task such as a verbal fluency exercise. This exercise consists of naming a maximum of France cities that they can in 3 minutes. This task was repeated during each check-up in the cohort, between 18 months and 3 years.
The gathered data allowed us to understand how subjects apprehend geographical space trough city names. It is a particular type of cognitive maps based on both the subject living history (autobiographic memory), semantic knowledge (the geographical shape of France and the localization of known French cities), memory capacities, and capacity to elaborate appropriate strategies to collect and organize this knowledge in a restricted time.
The qualitative study of this fluency test gives us the occasion to comprehend cognitive maps of geographical space in a large cohort. A great variety of information can be analyzed such as:
• City population
• Cognitive maps size in terms of geographical perimeter • The center of the cognitive map
• The order in which people name the cities
2 INVE S TI G AT I O NS
With the PAQUID data, those different aspects of cognitive maps can be studied longitudinally during the aging process of the subjects. Even more interestingly, we can assess the cognitive maps of subjects before and after the onset of AD. As Alzheimer’s disease affects first the hippocampic regions of the brain in which cognitive map takes a huge place, studying the evolution of those maps through the aging process of a patient with Alzheimer’s disease is a great opportunity to improve the scientific community’s understanding of the disease.
1Indeed, we only visualize a graphical visualization of the verbal
report of the subjects, which indirectly illustrate how cognitive maps are structured.
2.1 Using KDEEB for Time Exploration
The results of the fluency tests done in the PAQUID project were reported on paper. Then, the first step of our work was to produce Electronic Data of those results. In the current paper; only 50 patients datasets where digitalized. Although data digitalization is not our primary goal, we here report difficulties observed during the digitalization because of the use of natural language by the subjects. For instance, in France multiple cities have similar or either identical names. In the data used in the current paper, such city names were not used during the digitalization process in order to avoid biases in visualization. However, we are aware of the work to be done in order to decrease bias induced by the use of natural language.
Once the Electronic Health Records of the PAQUID results were digitalized, we were able to visualize graphs of cognitive maps1 with
raw EHR-sets (Electronic Health Records) by connecting all the cited cities with a line. To do this, we took 12 subjects, 6 dement and 6 non-dement, and plotted the named cities in a graph corresponding to their geographical position. In order to compare the graphs from dement and non-dement people, two graphs were created; 1 from the dement subjects and 1 from the non-dement ones. Since these graphs quickly become cluttered with numerous lines, we applied the Kernel density estimation for edge bundling [1] (KDEEB); a technique suited to visualize each individual graph. The bundling is created by hard-fixing the different nodes, each node representing a city, and then bundling the graph. As this bundling technique produces images that are easier to understand and help the user to better emphasize the graph structure; a first analysis was possible. To further exploit the data, especially in its longitudinal aspect, we also compared the graphs produced at different time periods (Figure 2). We applied a smoothing bundling technique [2] [3] (time-based dynamic versions of KDEEB). The bundling technique produces a simplified graph of cognitive maps. With this visualization method, it is possible to characterize and analyze emergent patterns. Indeed, the first aim in implementing KDEEB technique was to try to visualize patterns in the graphs. And
Figure 2 - Visualization of cited cities over time by 12 subjects. We notice a significant simplification of the network for dement subjects
using those patterns we aim to look for a way to characterize subject’s cognitive maps.
2.2 Initial Results
The first patterns observed after bundling showed us the following: First, bundling patterns can be analyzed through the aging process regardless of the clinical status of the patient, dement or not. One can notice that the number of nodes gets smaller with aging. As expected, the decrease in nodes number results in simplified bundled graphs. The simplification of bundled graphs over time most likely illustrate the deterioration of individual cognitive maps over the aging process. Second, the bundling results allow to compare graphs for dementia and non-dementia subjects. By comparing those two groups of graphs we noticed that pre-dement bundled graphs tend to be more complex than others. Indeed, the bundled patterns of pre-dement patients are much more intricate than patterns from subjects that will not be dement, i.e. Figure 2 – 2001 comparison. However, when the Alzheimer’s disease is getting worse, the number of nodes in the graph decreases and the bundled patterns gets simpler. Although all the graphs, regardless of the clinical status, simplify over the years, those from dement people simplify way faster, i.e. Figure 2 – 2006/2012 comparison). Thus, we can infer the existence of a link between the bundled graph complexity (and hence individual cognitive maps) and dementia induced by the disease. Such link as yet to be further quantified.
3 PER SPE C T IVES
The objective of this project is to develop techniques and tools to study the evolution of cognitive maps of elderly subjects in the years before and after Alzheimer's disease. The tools that we intend to develop will rely on image based technique (e.g. KDEEB bundling) and may help medical doctors better understand the evolution of cognitive maps in relation to aging and AD. Hence, they will hopefully provide clinicians with tools to earlier detect AD.
In this project, three scientific communities will collaborate: InfoVis (using new visualization techniques for analyzing large amount of time based databases), HCI (design and evaluation of software to assist physicians and neurologists), and cognitive science (study of spatial cognition on healthy and pathological subjects) research communities.
Our first results show that bundling techniques provide a way to illustrate the link between the visualization of verbal reports of city names and aging. The visualization may also help to detect and follow
the evolution of AD. In future work, we will look for further visualization methods to better characterize and quantify this link. E.g. curve analysis or node density comparisons. In addition, the generalization of the results will be possible by using the cross-sectional aspect of the PAQUID cohort study, using statistical and qualitative methods.
Finally, studying human cognition with InfoVis methods will hopefully be fruitful for developing interactive tools for the cognitive science and clinical research communities. The application of InfoVis and HMI research could provide fundamental and clinical brain research with a better understanding of the aging process as well as Alzheimer’s disease.
RE FE RE NC ES
[1] Hurter, Christophe, Ozan Ersoy, and Alexandru Telea. "Graph bundling by kernel density estimation." Computer Graphics Forum. Vol. 31. No. 3pt1. Blackwell Publishing Ltd, 2012.
[2] Hurter, Christophe, et al. "Bundled visualization of dynamic graph and trail data." (2007): 1-1.
[3] Hurter, Christophe, Ozan Ersoy, and Alexandru Telea. "Smooth bundling of large streaming and sequence graphs." Visualization Symposium (PacificVis), 2013 IEEE Pacific. IEEE, 2013.
[4] O'keefe, John, and Lynn Nadel. The hippocampus as a cognitive map. Vol. 3. Oxford: Clarendon Press, 1978. p390, chap 14.
[5] O'keefe, John, and Lynn Nadel. The hippocampus as a cognitive map. Vol. 3. Oxford: Clarendon Press, 1978. p419, chap 15.
[6] Rondeau, Virginie, et al. "Aluminum and silica in drinking water and the risk of Alzheimer's disease or cognitive decline: findings from 15-year follow-up of the PAQUID cohort." American journal of epidemiology 169.4 (2009): 489-496.
[7] Tessier, J. F., et al. "Dyspnea and 8-year mortality among elderly men and women: the PAQUID cohort study." European journal of epidemiology 17.3 (2001): 223-229.
[8] Tolman, Edward C. "Cognitive maps in rats and men." Psychological review 55.4 (1948): 189.
[9] Nejjari, C., et al. "Epidemiologic aspects of respiratory aging: contribution of the PAQUID survey." Revue d'epidemiologie et de sante publique 45.5 (1997): 417-428.