HAL Id: hal-02988377
https://hal.archives-ouvertes.fr/hal-02988377
Preprint submitted on 4 Nov 2020
HAL is a multi-disciplinary open access
archive for the deposit and dissemination of
sci-entific research documents, whether they are
pub-lished or not. The documents may come from
teaching and research institutions in France or
abroad, or from public or private research centers.
L’archive ouverte pluridisciplinaire HAL, est
destinée au dépôt et à la diffusion de documents
scientifiques de niveau recherche, publiés ou non,
émanant des établissements d’enseignement et de
recherche français ou étrangers, des laboratoires
publics ou privés.
The allocation of resources of national development
banks: Does it fit development goals?
Laurent Wagner
To cite this version:
Laurent Wagner. The allocation of resources of national development banks: Does it fit development
goals?. 2020. �hal-02988377�
fondation pour les études et recherches sur le développement international
ATION REC ONNUE D ’UTILITÉ PUBLIQUE . T EN ŒUVRE A VEC L ’IDDRI L ’INITIA TIVE POUR LE DÉ VEL OPPEMENT ET LA GOUVERNANCE MONDIALE (IDGM).
OORDONNE LE LABEX IDGM+ QUI L
’ASSOCIE A U CERDI E T À L ’IDDRI. TTE PUBLIC ATION A BÉNÉFICIÉ D ’UNE AIDE DE L ’É TA T FR ANC AIS GÉRÉE P AR L ’ANR A U TITRE DU PR OGR A MME «INVESTISSEMENT S D ’A VENIR»
TANT LA RÉFÉRENCE «ANR-10-LABX
-14-01».
Abstract
Public financial institutions and National Development Banks (NDBs) in particular are
well suited to fill financing gaps in un- or under- served markets. By virtue of their
developmental mandate, and local expertise, NDBs are able to operate and invest in
the most vulnerable regions where the risk is often too great for a majority of private
actors. This study intends to reflect on NDBs mandates in this context by shedding
light on the significant role they can play to address scarcity of financing in vulnerable
areas within developing countries.
… /…
Keywords: Development Banks, Ressource allocation, Public loans. JEL: G21, H81, O16.
Acknowledgments: This research project is part of the International Research Initiative on Public Development Banks and Development Finance
Institutions. The author is thankful to Lisa Chauvet, Sampawende Jules Armand Tapsoba, Patrick Guillaumont, Sylviane Guillaumont Jeanneney, Florian Léon and Mariana Vijil for their useful comments and suggestions.
The allocation of resources of
national development banks:
Does it fit development goals?
Laurent Wagner
Laurent Wagner, Research Officer, FERDI. Email : laurent.wagner@ferdi.fr
Paper prepared for the 14th AFD International Research Conference on development.
De
velop
ment P
oli
cie
s
Wo
rking
273
Paper
October 2020
“Sur quoi la fondera-t-il l’économie du monde qu’il veut
gouverner? Sera-ce sur le caprice de chaque particulier? Quelle
confusion! Sera-ce sur la justice? Il l’ignore.”
The allocation of resources of national development banks: Does it fit development goals?
Laurent Wagner, Fondation pour les Etudes et Recherches sur le Développement International (Ferdi), Clermont-Ferrand, France Abstract Public financial
institutions and National Development Banks (NDBs) in particular are well suited to fill financing gaps in un- or under- served markets. By virtue of their developmental mandate, and local expertise, NDBs are able to operate and invest in the most vulnerable regions where the risk is often too great for a majority of private actors. This study intends to reflect on NDBs
mandates in this context by shedding light on the significant role they can play to address scarcity of financing in vulnerable areas within developing countries. Using firm-level data for 127 countries over 2006-2018, we find that on average, there is no significant difference in terms of productivity levels between firms accessing private versus public finance. NDBs tend to provide more finance in less developed localities relative to private commercial banks. Our results show therefore that public banks support more firms in less developed localities, without necessarily selecting less productive firms. Instead, they seem to be able to manage more
risks related to the local context that fall outside of the direct control of the firm but that might affect their future portfolio performance. Evidence also supports the emerging consensus that public banks play a countercyclical role by strengthening their credit offer during bad times.
Keywords
Development Banks, Ressource allocation, Public loans.
Acknowledgements
This research project is part of the International Research Initiative on Public Development Banks and Development Finance Institutions. The author is thankful to Lisa Chauvet, Sampawende Jules Armand Tapsoba, Patrick Guillaumont, Sylviane Guillaumont Jeanneney, Florian Léon and Mariana Vijil for their useful comments and suggestions. The views expressed herein reflect those of the authors and do not reflect the official position of AFD or other institutions involved in the study.
JEL Classification G21, H81, O16 Original version English Résumé Les institutions financières publiques et les banques nationales de développement (BND), en particulier, sont bien adaptées pour combler les déficits de financement sur les marchés non desservis ou sous-desservis. En vertu de leur mandat de
développement et de leur
expertise locale, les BND sont en mesure d'opérer et d'investir dans les régions les plus
vulnérables où le risque est souvent trop important pour une majorité
d'acteurs privés. Cette étude vise stimuler la réflexion quant aux mandats des BND dans ce contexte en mettant en lumière le rôle important qu'elles peuvent jouer pour remédier au manque de financement dans les zones vulnérables des pays en développement. En utilisant des données au niveau des entreprises pour 127 pays sur la période 2006-2018, nous constatons qu'en moyenne, il n'y a pas de différence significative en termes de niveaux de productivité entre les entreprises accédant à des
financements privés et celles accédant à des financements publics. Les BDN ont tendance à fournir davantage de financements dans les localités moins développées par rapport aux banques commerciales privées. Nos résultats montrent donc que les banques publiques soutiennent davantage d'entreprises dans les localités moins
développées, sans nécessairement sélectionner les entreprises les moins productives. Au contraire, elles semblent être capables de gérer
davantage de risques liés au contexte local qui échappent au contrôle direct de l'entreprise mais qui pourraient affecter la performance future de leur
portefeuille. Les faits confirment également le consensus naissant selon lequel les banques publiques jouent un rôle anticyclique en renforçant leur offre de crédit en période de crise.
Introduction: Unequal
devel-opment threatens the
achievement of the
Sustaina-ble Development Goals
Sustainable development largely
depends on the ability of
developing economies to generate
two growth dividends. First,
poverty alleviation and the
emergence of a middle class
willing to contribute to the
provision of public goods and thus
with a vested interest in
stability and economic and
political freedoms. Second, the creation of enough jobs to absorb the age groups entering the labor
market each year. Failure in
either of these areas,
particularly the second, would
likely undermine any progress
made. If personal incomes are to continue to rise, this demands an increase in labor productivity, which for the most part implies making production more capital-intensive. However, investment is still too low in many areas of the world which reflects the many constraints weighing on businesses
including governance and
infrastructure. Many of these
constraints are cross-cutting as they affect all sectors, be it agriculture, industry or services. Inadequate energy and transport infrastructure, as well as a lack
of a regulatory framework or
sufficient access to credit, are some of the main obstacles. This
means that easing these
constraints notably in the poorest
areas is a prerequisite to
pursuing the gains achieved in
individual incomes, poverty
reduction and equal development. Existing sources of finance such as foreign aid are insufficient to
meet the world’s development
aspirations, so more-effective
instruments are needed to mobilize private sector capital. Public Banks and National Development Banks (NDBs) in particular should
be well suited to detect un- or under- served markets and fill financing gaps. By virtue of their
development mandates, local
expertise and relays, NDBs are able to operate and invest in the most vulnerable regions where the risk is often too great for a majority of private actors. In vulnerable areas, NDBs can provide
means to overcome first-mover
disincentives and obstacles to risk-sharing while also playing a
useful catalytic role in
developing financial products and
services. They can propel
structural change by supporting startups, innovation and economic infrastructure. They can further ecological, social and regional
development, promote financial
sector development, as well as foster stability and peace. In many well documented instances
they successfully mitigated
macroeconomic crises by providing countercyclical finance. NDBs have a very wide range of financial
instruments at their disposal
(Griffith-Jones and Ocampo, 2008; Bertay et al., 2015; Brei and Schclarek, 2013, 2018). They offer
custom-made long-term finance,
mobilize private funds and provide expert advice. By adjusting the
financing terms to their
particular needs, NDBs ensure that
poorer recipients get higher
concessional funding. By providing credit guarantees, they address
market failures related to
property rights insecurity and weak judicial system that prevent access to collateralized finance. The Addis Agenda notes the role
that well-functioning national
development banks can play in financing sustainable development,
with a countercyclical role,
especially during crises.
calls on national banks to expand their contributions in relevant areas. However, the ups and downs of development banks over time
illustrate well the need for
assessing their development and financial performance to make them an effective tool for economic development (IDB, 2019).
The geographic allocation of
public banks' resources reflects a significant part of their current development mandate and strategy, differing from a simple nonbinding declaration of alignment with the SDGs and more particularly with SDG 1 and 13, related respectively to poverty and climate change.
Recent research (Chuhan-Pole,
2014; Cadot et al., 2015), clearly
suggests that increases in
manufacturing value-added have a particularly powerful effect on poverty reduction. What is needed to achieve this “inclusive”, and
thus politically stabilizing
growth is a structural change
centered on expanding the
manufacturing sector and now the services sector, which is becoming pivotal for integrating a country into value chains. This will not
only help to absorb surplus
agricultural labor but also lessen
the continent’s dependence on
natural resources. By providing access to finance to productive firms in lagging regions, NDB can be powerful instruments to achieve this goal. Furthermore, regarding SDG13, significant investments are
needed to support the global
transition to a climate resilient global economy. However, climate-change adaptation is costly for firms. The private sector might be willing to adapt the production function to take into account climate shocks, but doing business
constraints, including those
affecting access to finance,
increase the risk-return of such
investments. Public funds are
essential for unlocking needed climate finance by taking on such risks that the private financial institutions might not be willing to bear. NDBs play a dual role in this context, both complementing
and catalyzing private sector
players (Trabacchi, 2015).
However, the objectives of public
development banks are not
"revealed" only by the geographic allocation of their operations, they are also revealed through the
stabilizing effects of their
operations on economic and social targets.
Our analysis sheds light on the significant role they can play to address scarcity of financing in
vulnerable areas that may
otherwise lead to lack of progress toward the SDGs. By using firm level data with a broad country
and sector coverage and by
analyzing the business model of public banks from the demand side rather than the supply side, we are able to shed lights on the
strength of the development
mandate of public banks while
taking into account the
characteristics of firms accessing
public loans versus those
receiving it from private
commercial financial institutions. Our result show that public banks support firm in low productivity
areas where workers are less
educated, overall helping
convergence between regions. This significant penetration of public banks in less developed areas doesn’t seem to come with the underlying cost of systematically financing lower productivity firms
relative to private financial
institutions. Evidence also
supports the emerging consensus
that public banks play a
countercyclical role by
strengthening their credit offer during bad times.
I - Development mandates of
NDBs vs portfolio
perfor-mance: What does the
litera-ture say?
There are two types of market failures that are usually invoked to justify the existence of development banks: i) market failures constraining the supply of credit, such as those originating in the borrower’s inability to meet its financial goals (time inconsistency) and the corresponding need for elaborate contract enforcement and collateral guarantees, especially in the face of information asymmetries and the resulting problems of moral hazard and adverse selection; and ii) positive externalities to certain investments that may render socially profitable projects unattractive from the point of view of individual investors.
From the post-world war two era to the beginning of the structural adjustment period, development banks were regarded as the centerpiece of a development strategy even if they were often providing mixed results. Development banks are financial tools to advance industrial development policies. They are predicated on the existence of market failures that public policy can address with financial instruments. Hence, while driving key structural changes, NDBs were implementing in many instances questionable lending practices, uncontrolled losses, or “white elephants” investment programs raising questions regarding the cost/benefit ratio of their business models.
In the 1980s, the role of state-led economic development was reassessed and with it several waves of bank privatization which greatly reduced the presence of the state in the financial system. One of the main positions defining the so-called Washington consensus was that government failures are more costly than market failures and state ownership of banks, stunted, rather than promoted, financial and economic development.
A lost decade of economic development led to the failure of the Washington Consensus as a development strategy and with it a renewed interest for a stronger role of state-owned banks notably to counteract the contraction of the financial system as illustrated by the global financial crisis in 2008. There has been an expansion of the role of state-owned banks to counteract the contraction of the credit supply. The lack of clarity concerning the role of development banks to face the challenges of the developing world require to reassess their role, objective and instruments allowing to redesign their operation in order to avoid the mistakes of the past and notably risks associated with misallocated resources to the benefit of connected firms and “white elephants”, too often leading to fiscally costly financial bailouts.
As a consequence, many countries decided to constrain the activities of their development banks by imposing restrictive mandates and tight financial targets. According to the World Bank (2017), 49% of NDBs have a narrow policy mandate. The objective was to induce these institutions to address market failures with limited waste and risk. However, the cost of being financially safe might come at the expense of a less significant development focus and impact, a crowding-out of the private banking sector and an overall lack of relevance. Over the last 15 years the call to design efficient development banks that have means to address market failures while remaining financially sound and limiting negative externalities has highlighted the important challenge remaining in the reform agenda (IDB, 2019).
Looking at past experiences, there is today an overwhelming amount of consistent literature suggesting that historically state ownership of banks lowers bank performance, with negative consequences for economic growth (La Porta et al., 2002; Caprio and Martinez Peria, 2002 ; Dinc, 2005; Micco et al., 2007 ; Cornett et al., 2010 among others). In contrast, the literature examining the lending behavior of state banks during business cycles suggest that state banks can play a useful role in stabilizing credit over the business cycle as well as during periods of financial instability (Griffith-Jones and Ocampo, 2008; Bertay et al., 2015; Brei and Schclarek, 2013, 2018 among others). The objective of state-owned banks is not only to maximize profits given risks, but also to stabilize and promote the recovery of the economy. Thus, given that their objective functions differ, public banks are more willing to take on more risks and expand lending during a crisis period than private banks.
However, according to available evidence, the track record of state banks in credit allocation remains quite poor, questioning the wisdom of using state banks as a development as well as a short term countercyclical tool and the question of how to combine development results with portfolio performance remains to be answered.
II - The enterprise surveys
and what they tell us about
NDBs loan activities.
In order to shed light on the rule governing credit allocation by NDBs and assessing its effectiveness, there are three main sources of data available. First, macro-level bank datasets, such as the Bureau van Dijk’s Bankscope, provides information on statements of banks and their ownership structure for a large selection of both private and public banks. Such data provide insights regarding credit supply. Second, bank-level data as provided by selected institutions might illustrate their strategy in greater details, notably providing a breakdown of the sectoral and geographic allocation of credit and other instruments, but providing limited information on its clients. Such data could be accessed directly or through bank surveys. Third, from the demand side of credit, firm-level data obtained either from government agencies or through survey could be used to infer the characteristics of NDBs’ lending practices while providing deep insights on the characteristics of their clients.
Each kind of available data presents advantages and drawbacks allowing or preventing specific type of analysis. For example, the Bankscope database was successfully used by various authors (Bertay et al. 2015; Brei and Schclarek, 2018 among others) to assess to counter-cyclical nature of NDBs’ credit allocation. However it doesn’t provide any information on who the clients of those NDBs are, making it impossible to address the nature of the development mandates of those institutions. Furthermore, the coverage of the database is limited when it comes to developing economies, notably
Sub-Saharan Africa. The second source while providing a deeper
understanding of NDB’s business models might provide limited information making it difficult to infer wide ranging implications or to go beyond simple correlations. Finally, the third source while potentially addressing previous shortcomings may lack precision when it comes to specific bank characteristics.
This study is an attempt to address those caveats by combining the second and third sources of data to finely analysis the trade-off between
development mandates, financial performance and counter-cyclical roles of NDBs over the largest sample of developing countries possible.
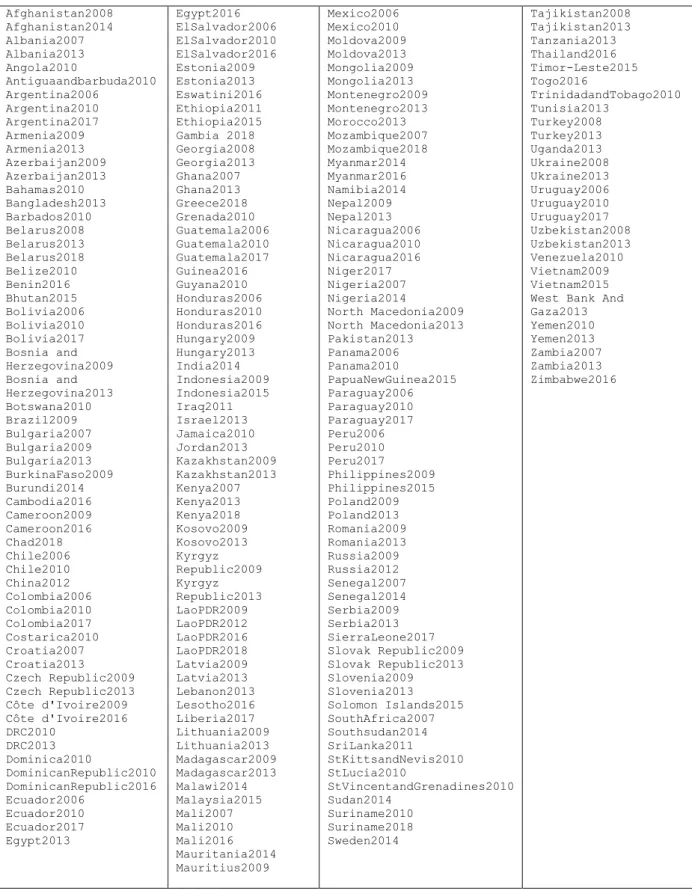
In a first step, we rely on the World Bank Enterprise Survey (WBES) data to analyze the credit allocation rules of public credit institutions by looking at demand-side characteristics. Over the period 2006-2018, the World Bank surveyed 102,930 representative firms in 127 developing
countries1 from which 37,488 reported to have gotten a loan from a financial
institution. The enterprise surveys then allow to differentiate between three different type of financial institution from which those individual credits or loans were last granted: i) Private commercial banks, ii) State-owned banks or government agencies, iii) Non-bank financial institutions. This particular breakdown allows us to compare the characteristics of the clients of each type of institution on average and across regions within countries. It also implies that we adopt the broadest definition of a NDB as national development finance institutions, i.e any type of financial institution that a national government fully or partially owns or controls providing loans or credits directly to firms irrespective of their particular development mandate or of the fact that they are taking deposits
or not2. Furthermore, even if the range of financial instruments and
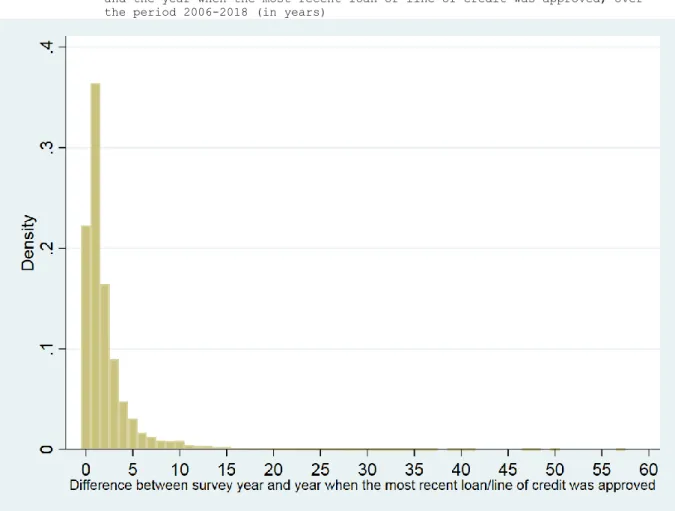
services provided by public financial institutions goes beyond retail lending to firms, the analysis of WBES still allows us to lift the veil on the dynamic behind this significant part of their activity. Similarly, the WBES dataset only convers manufacturing and services and doesn’t include agriculture but only agro-industries. Activities of NDBs with a specific mandate aimed at agricultural development won’t be taken into account in the analysis. Finally, the WBES provide information relative to the last loan or line of credit obtained by each firms. It doesn’t constitute a complete overview of each firm’s credit history but rather offer a snapshot of the current state of the credit market. Hence, there might be a significant time gap between the year when the credit was last obtained and the survey year which could make the data harder to interpret. However, according the figure A1 in appendix, when this information is available, 92% of the loans or credit lines were obtained in the five years preceding the survey.
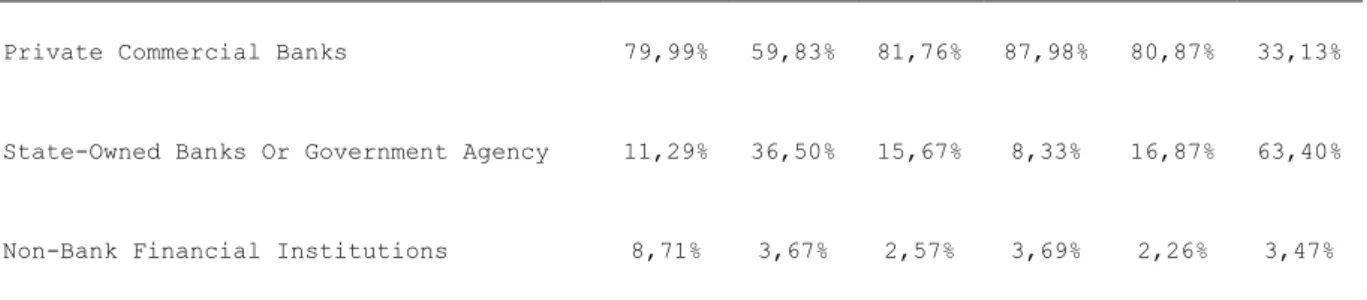
According to the WBES, the share of credit or loan offered by state-own financial institutions in total credit is heterogeneous across regions, ranging from 8% in Latin America to 63% in the South Asia region. Public banks are more prevalent in South Asia than elsewhere. Over 40 percent of South Asia’s banking assets are owned by the public sector, the largest share among global regions and more than twice the level of East Asia (excluding China). The share of bank assets owned by public banks is highest in India (62 percent) and Bhutan (56 percent) followed by Sri Lanka and the Maldives (somewhat over 40 percent), according to the World Bank (2020). It appears that documented regional characteristics are well reflected by the WBES data.
1 See Table A1 in appendix for the list of countries and years included in the
sample.
2 For some countries, state-owned investment funds offering loans and credit lines
Table 1: Percentage of firms by type of financial institution that granted the line of credit or loan by regions, 2006-2018.
Regions
Percentage of firms AFR EAP ECA LAC MNA SAR
Type Of Financial Institution That Granted The Line Of Credit Or Loan
Private Commercial Banks 79,99% 59,83% 81,76% 87,98% 80,87% 33,13%
State-Owned Banks Or Government Agency 11,29% 36,50% 15,67% 8,33% 16,87% 63,40%
Non-Bank Financial Institutions 8,71% 3,67% 2,57% 3,69% 2,26% 3,47%
More interestingly, firms accessing public loans or credit are not very different from other firms, notably when considering factors usually associated with being credit constrained such as size or age. However, business models of public financial institutions appear heterogeneous across regions, notably compared to private banking, reflecting a risker approach oriented towards relatively less productive firms. According to table 2, there are very few differences in the distribution of the size of the firm between private commercial and state-owned banks and around 70% of total credits or loans are directed towards small and medium size enterprises (SMEs). Alternatively, non-bank financial institutions, notably through microfinance, are significantly more involved with small firms which could also reveal a significant role played by public bank through guarantees and wholesale lending channeled through institutions offering micro-credit.
Table 2: Percentage of firms by type of financial institution that granted the line of credit or loan and size, 2006-2018.
Type Of Financial Institution That Granted The Line Of Credit Or Loan Private Commercial Banks State-Owned Banks Or Government Agency Non-Bank Financial Institutions
Small, Medium, And Large Firm
Categories Based On No. Of Employees
Small(<20) 30,73% 29,08% 57,40%
Medium(20-99) 39,06% 40,51% 29,82%
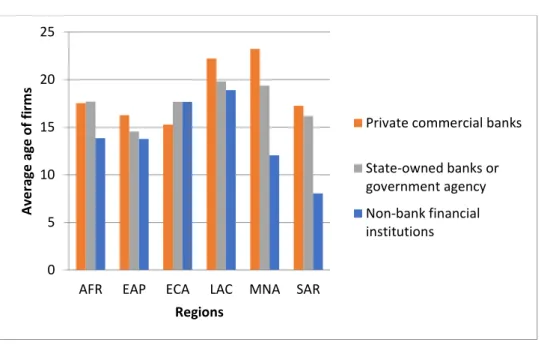
In most regions, firms accessing public loans or credits are younger according to figure1. Differences with the average age of firms getting credit from a private commercial bank are particularly significant in Latin America, the Middle East and North Africa region. Alternatively, there doesn’t seem to be any age difference between firms in Sub-Saharan Africa.
Figure 1: Average age of firms by type of financial institution that grant-ed the line of crgrant-edit or loan and size by region, 2006-2018.
Source: author’s calculations from the WBES
The next two figures are of particular importance with respect to the business model of public banks compared to private ones. On average, differences according to alternative firm productivity measures are not significant between private and public banks. When considering firms’ total annual sales to workers ratio as displayed in figure 2, it appears that labor productivity level of manufacturing and services firms isn’t a factor explaining why a particular firm would get a loan from a public bank rather than a private one. In four out of the six World Bank regions, productivity is higher for firms that got a public loan.
0 5 10 15 20 25
AFR EAP ECA LAC MNA SAR
A ve rag e ag e o f fi rm s Regions
Private commercial banks State-owned banks or government agency Non-bank financial institutions
Figure 2: Average sales per worker in constant US$ by type of financial in-stitution that granted the line of credit or loan and size by region, 2006-2018.
Source: author’s calculations from the WBES
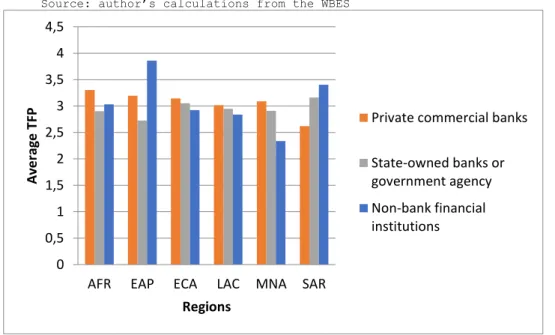
Alternatively, when considering a more precise measure of productivity, namely estimated total factor productivity, i.e the portion of output that is not explained by the amount of inputs utilized, for manufacturing firms in figure 3, in most cases average productivity levels are lower for firms getting a public loan. It implies that public banks seem to be ready to take more risk when approving loan applications. However, it doesn’t necessary imply that those firms will remain less performing after getting the loan.
Figure 3: Average TFP by type of financial institution that granted the line of credit or loan and size by region, 2006-2018.
Source: author’s calculations from the WBES
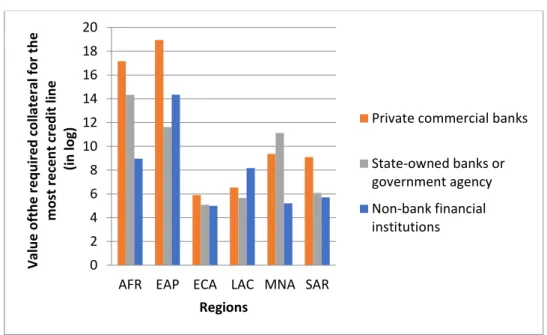
Figure 4 strengthens this view by showing that public banks require on average lower values of collateral in most regions. This seems to imply
0 2 4 6 8 10 12 14 16 18
AFR EAP ECA LAC MNA SAR
A ve rag e sal e s p e r wo rke r (i n log) Regions
Private commercial banks State-owned banks or government agency Non-bank financial institutions 0 0,5 1 1,5 2 2,5 3 3,5 4 4,5
AFR EAP ECA LAC MNA SAR
A ve rag e TFP Regions
Private commercial banks State-owned banks or government agency Non-bank financial institutions
that public bank are approving loans to firms that would have not been able to access one from a private bank as they don’t own enough collateral to back the loan.
Figure 4: Average value of the required collateral for the last credit line (in logarithm) by type of financial institution that granted the line of credit or loan and size by region, 2006-2018.
Source: author’s calculations from the WBES
This riskier positioning on the credit market implies that contrary to private banks, public banks are balancing profitability with their development mandate. The well-documented significant difference in non-performing loans ratio between public and private banks could be a consequence of that fact. Public banks have to develop mechanisms to identify projects that are too risky for commercial banks but that don’t necessary imply an unsustainable risk of default and that are socially beneficial according to a set of targets some of which could be related to the SDGs. The following analysis aims at shedding light in more details on the characteristics of their business models and notably their alignment with SDG targets.
III - Access to NDBs
financ-ing: Revealing selectivity
3.1 Methodology and estimating equation
In order to reveal the business model of public banks through the characteristics of firms that have access to their retail credits or loans, we rely on a Heckman maximum-likelihood probit model with sample selection. This specific model allows us to capture factors influencing the probability of getting a public loan compared to a loan from a private bank or a non-bank financial institution conditional on the probability of having accessed a loan in the first place. Hence the factors highlighted in the results rather than explaining factors influencing overall access to credit show the particularities of the credit allocation of public banks.
0 2 4 6 8 10 12 14 16 18 20
AFR EAP ECA LAC MNA SAR
Val u e o fth e r e q u ir e d c o llate ral for t h e m o st re ce n t cr e d it lin e (i n log) Regions
Private commercial banks State-owned banks or government agency Non-bank financial institutions
The estimating equation is as follows:
P (Public loan=1 / Loan=1) = a.W + b.X + c.Y + d.Z + ε (1)
with W a vector of firm characteristics, X a vector a regional characteristics, Y a vector of country-level characteristics and Z a vector of dummy variables.
And P (Loan=1)= a.W + b.Y + c.Z + ε (2)
is the first step sample selection equation.
The vector W of firm-level characteristics is composed of a variable reflecting firms’ labor productivity (sales per worker, in log). We also control for the age of the firm as well as the size of the firm reflected by the total number of full time employees, adjusted for temporary workers. This set of three characteristics, i.e productivity, age, and size are traditional factors explaining access to credit. As public bank are more likely to provide financing for State-owned enterprises (SOEs), we also control for the firms’ percentage of capital owned by the government or the State. Similarly, we control for the firms’ percentage of capital owned by private foreign individuals, companies or organizations reflecting foreign direct investment. We also control for the exporter status of each firm. Exporting firms are usually more productive and established and should have easier access to credit. They also might often require export credits. We also control for the fact that some firms might not have enough collateral to get a loan by introducing a dummy variable indicating if the firm owns the land it is operating on. Two additional variables at the firm level are included. The first one acts as a proxy for the level of innovation of the firm through a dummy variable that is equal to one if the firm has introduced new products or services in its market over the last three years. The second one reflects the dynamic of the firm and corresponds to the growth rate of the labor productivity over the last two years preceding the survey.
The vector Y of country-level characteristics is composed of four distinct variables. First, the logarithm of GDP per capita reflects both the country development level but also act as a proxy for the development of the financial sector. Second, we use the design of the WBES and notably the random nature of the selection of countries to be surveyed each year to assess the pro or countercyclical nature of the credit supply of public banks. Everything equals, if the survey period for some individual countries correspond to a slowdown of the GDP growth rate compared to the average growth rate the probability of getting a public loan compared to a private loan should be higher3. To account for that fact the crisis dummy
variable is built as follows:
Crisis dummy = 1; if ΔGDPt-1 < average ΔGDP over 2006-2018; with GDP, the per capita GDP growth in constant US$.
3 Alternatively, we could have use the information on the year the loan was obtained
to build the crisis variable that would become firm-specific rather than country-specific. Considering the issue of missing data implied with this approach, we favored the methodology presented here. However, results using the firm specific crisis variable tend to closely match and support the findings provided in the paper.
Several explanations are put forward to justify the lower sensitivity of public banks to the economic situation. First, public banks have a mandate (implicit or explicit) to stabilize economic activity (Micco and Panizza, 2007; Brei and Schclarek, 2015). Public banks are not guided by the search for short-term profit but have a long-term vision. As such, they will consciously increase their credit in times of recession even if this implies taking greater risk.
Another explanation put forward is that these banks are a tool at the service of political leaders (Shleifer and Vishny, 1994). As such, the activity of public banks is more politically motivated (re-election, corruption). The allocation of credit by public banks could therefore be more linked to the electoral cycle (increase in loans during electoral periods) rather than to economic one (Dinç, 2005). In addition, the funds lent could be directed towards actors or areas close to political power (Sapienza, 2004). To test this hypothesis, the third and fourth variables are reflecting the political cycle in each country. The two dummy variables are equal to one when the surveyed year corresponds to either a legislative election year or an executive election year. Data comes from the Database of Political Institutions (Cruz et al., 2018).
The vector Z is composed of fixed effect dummy variables reflecting country, sector and year fixed effects for the sample selection equation and sector and year fixed effect for the main equation.
The vector Y is composed of variables reflecting specific characteristics of the administrative region within the country the firm is operating in. It is through this vector that we want to qualify the nature and strength of development mandates of public banks and NDBs and their role in promoting equal development by testing the extent of which public banks are able to operate in vulnerable areas. This vector is composed of five variables.
The first one represents the relative difficulty of access to finance in each region. Following Kuntchev et al. (2013), we build four credit-constraint groups of firms according to the WBES. Each group, i.e “not
credit constraint”, “maybe credit constraint”, “partially credit
constraint” and “fully credit constraint” are then used to characterize the experience for firms toward access to finance. We use the percentage of firms belonging to the first group (not credit constraint) as a proxy for the regional financial sector development. It includes the firms that did not apply for a loan during the previous fiscal year and the reason for not applying for a loan was having enough capital for the firm’s needs. The important characteristic of this group is that, independently of its current level of external finance, these firms are happy with their current financing structure for both working capital and investments. We expect a negative correlation between this variable and the probability of getting a public credit or loan.
The second regional variable represents the regional average productivity level measured by the sales per workers ratio. Everything equals, lower regional productivity levels reflect the local business conditions such as markets failures, cumbersome regulations or low quality infrastructures that make doing business more difficult. We expect a negative effect of this variable on the allocation of credits or loans by public banks as this variable. However, it doesn’t necessarily mean that labor productivity levels of firms accessing public credit have themselves lower a productivity compared to firms getting a loan from a commercial bank. It means however that firms in those regions are more at risk.
The third variable represents the regional average annual labor productivity growth. While fast growing firm might have an easier access to private financing options, the average growth rate might not necessarily be negatively correlated with the probability of getting a public loan or credit. Under the hypotheses that less developed regions are converging toward the more developed ones at a faster rate in terms of productivity levels, we could instead see a positive correlation.
In order to better proxy to relative development levels of each region, we control for the percentage of full time workers that completed secondary school of each firms averaged by region. As education is directly correlated to poverty, we expect a negative correlation between this variable and the probability of getting credit from a public financial institution.
By controlling for the average percentage of total annual sales paid for security, we can assess if fragility is taken into account for the allocation of public credits. In regions that are relatively more fragile, existing firms might face higher security costs, lowering their productivity levels and making investments by private banks more risky. We could expect a positive relationship between security costs and the probability of accessing public finance. However, the risk of investing in more fragile regions might be too great even for public banks with strong development mandates as portfolio performance in such regions could be hard to maintain or good collateral hard to obtain.
Finally, one last variable is included in the selection equation (2) to act as the selection variable. This variable help explain the selection process while not influencing the access to public or private credit or loan. We rely on a variable at the firm-level reflecting whether the firm applied for a new loan or line of credit the year of the survey. We expect this variable to be negatively correlated with the selection process as firms looking for new sources of finance tend on average to not have had access to finance before.
3.2 Results
Table 3 provides estimation results for manufacturing and service firms and displays marginal effects.4 Firms accessing public loans are not very
different in terms of age or size from other firms ceteris paribus. SOEs and firms operating with public capital tend to access public loans more. Firms with international capital access public loans to a lesser extent. Firms accessing public finance are not significantly investing more in innovation nor are they growing at a faster rate on average. Being an exporter or owning the land from which the firm is operating isn’t associated with a higher chance to access public rather than private finance.
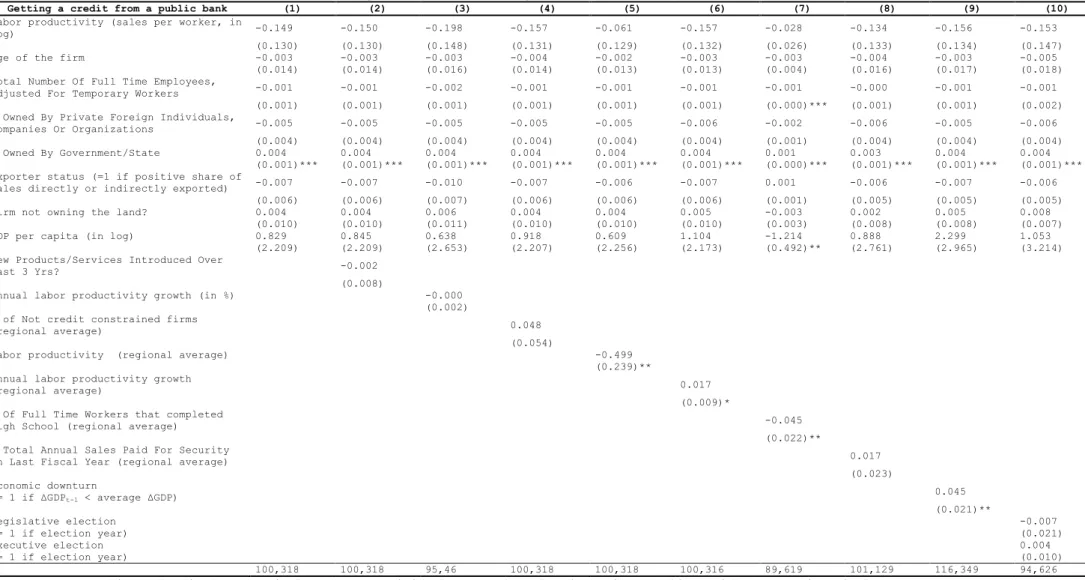
Table 3 : Heckman maximum-likelihood probit models with sample selection, 2006-2018.
Getting a credit from a public bank (1) (2) (3) (4) (5) (6) (7) (8) (9) (10)
Labor productivity (sales per worker, in
log) -0.149 -0.150 -0.198 -0.157 -0.061 -0.157 -0.028 -0.134 -0.156 -0.153
(0.130) (0.130) (0.148) (0.131) (0.129) (0.132) (0.026) (0.133) (0.134) (0.147)
Age of the firm -0.003 -0.003 -0.003 -0.004 -0.002 -0.003 -0.003 -0.004 -0.003 -0.005
(0.014) (0.014) (0.016) (0.014) (0.013) (0.013) (0.004) (0.016) (0.017) (0.018)
Total Number Of Full Time Employees,
Adjusted For Temporary Workers -0.001 -0.001 -0.002 -0.001 -0.001 -0.001 -0.001 -0.000 -0.001 -0.001
(0.001) (0.001) (0.001) (0.001) (0.001) (0.001) (0.000)*** (0.001) (0.001) (0.002)
% Owned By Private Foreign Individuals,
Companies Or Organizations -0.005 -0.005 -0.005 -0.005 -0.005 -0.006 -0.002 -0.006 -0.005 -0.006
(0.004) (0.004) (0.004) (0.004) (0.004) (0.004) (0.001) (0.004) (0.004) (0.004)
% Owned By Government/State 0.004 0.004 0.004 0.004 0.004 0.004 0.001 0.003 0.004 0.004
(0.001)*** (0.001)*** (0.001)*** (0.001)*** (0.001)*** (0.001)*** (0.000)*** (0.001)*** (0.001)*** (0.001)*** Exporter status (=1 if positive share of
sales directly or indirectly exported) -0.007 -0.007 -0.010 -0.007 -0.006 -0.007 0.001 -0.006 -0.007 -0.006
(0.006) (0.006) (0.007) (0.006) (0.006) (0.006) (0.001) (0.005) (0.005) (0.005)
Firm not owning the land? 0.004 0.004 0.006 0.004 0.004 0.005 -0.003 0.002 0.005 0.008
(0.010) (0.010) (0.011) (0.010) (0.010) (0.010) (0.003) (0.008) (0.008) (0.007)
GDP per capita (in log) 0.829 0.845 0.638 0.918 0.609 1.104 -1.214 0.888 2.299 1.053
(2.209) (2.209) (2.653) (2.207) (2.256) (2.173) (0.492)** (2.761) (2.965) (3.214)
New Products/Services Introduced Over
Last 3 Yrs? -0.002
(0.008)
Annual labor productivity growth (in %) -0.000
(0.002) % of Not credit constrained firms
(regional average) 0.048
(0.054)
Labor productivity (regional average) -0.499
(0.239)** Annual labor productivity growth
(regional average) 0.017
(0.009)* % Of Full Time Workers that completed
High School (regional average) -0.045
(0.022)** % Total Annual Sales Paid For Security
In Last Fiscal Year (regional average) 0.017
(0.023) Economic downturn (= 1 if ΔGDPt-1 < average ΔGDP) 0.045 (0.021)** Legislative election -0.007 (= 1 if election year) (0.021) Executive election 0.004 (= 1 if election year) (0.010) N 100,318 100,318 95,46 100,318 100,318 100,316 89,619 101,129 116,349 94,626
This table displays marginal effects conditional on sample selection using sampling weights. Equations include country, sector and year dummy variables. Clustered standard errors in parenthesis.
Furthermore, it seems to be clearly the case that on average less productive firm don’t tend to have a higher probability of accessing public credits or loans. However, according to column (5) of table 3, once the
regional productivity averages are introduced, while firms’ own
productivity levels are still not significant factor explaining access to public finance, the regional averages are. The lower the average, the higher the probability of getting a public loan becomes. This reflects the riskier position public banks are taking compared to private banks in developing countries. It doesn’t mean necessarily that public bank are less able to detect riskier investment but it rather reveal their particular strategy regarding development goals. This important result implies that public banks don’t specifically target less productive firms but rather firms in less developed region. The lack of significance of the firm own productivity implies that within those regions there aren’t any significant differences in terms of productivity between firms accessing private versus public finance. The strength of this particular targeting seems also worthwhile to note. With an elasticity close to unity, it means that a one percent decrease in the regional productivity average leads to a one percent increase in the probability of getting a public loan or credit rather than a private one. This focus on less developed region is then supporting to some extent the convergence between more developed and less developed region, as productivity growth is positively associated to the probability of getting a public credit or loan.
Interestingly, according to the fourth column of table 3, overall public banks don’t seem to specifically target regions where access to finance is more difficult. Similarly, while positive, the relationship between regional average cost of security and the probability of getting a public loan or credit isn’t significant, according to table 3, column 8.
Evidence that public banks tend to favor less developed region seems to be reinforced by column 7 of table 3 when the regional education level of the work force is introduced. This variable turns out to be highly significant and also displays a strong elasticity similar to the one observed for labor productivity. Regions that are characterized by low productivity and a lower share of workers with secondary education are likely to be relatively less developed than other areas. The focus on those particular regions implies two important conclusions. First, there are firms in less developed areas that are viable and are looking for sources of finance to develop their business. Second, public bank through their local expertise seem to be able to identify those firms rather effectively. In that case, local contexts and specific factors external to the firm arming firms’ growth such as logistical issues, the reliability of power generation or issues related to violence and insecurity might explain the higher rate of non-performing loans reported by public banks.
So far the results seem to suggest that public banks are more likely to allocate their credit to regions that are lagging behind, validating their development mandate. However, it doesn’t inform us about the stabilizing role of NDBs highlighted in the literature, suggesting that governments can play an active countercyclical role in their banking systems directly through public banks by contributing to the access to finance. As displayed in column 9 of table 3, our results seem to be in line with the literature and show a significant countercyclical effect of lending by public banks5.
Interestingly, the magnitude of the effect is very similar to the results
5 Introducing the crisis dummy variable in the sampling equation doesn’t change the
results. The dummy variable in the sampling equation is negative and significant implying a direct negative effect of economic crisis on credit supply.
provided by Brei & Schclarek (2018) for NDBs in Latin America6. During an
economic ‘crisis’ as defined here, the probability of getting a public rather than a private loan or credit rises by 4.5 percent.
Finally, looking at the effect of the political cycle on the probability of getting a public loan or credit, we could not find any significant effect of either variable (table 3, column 10).
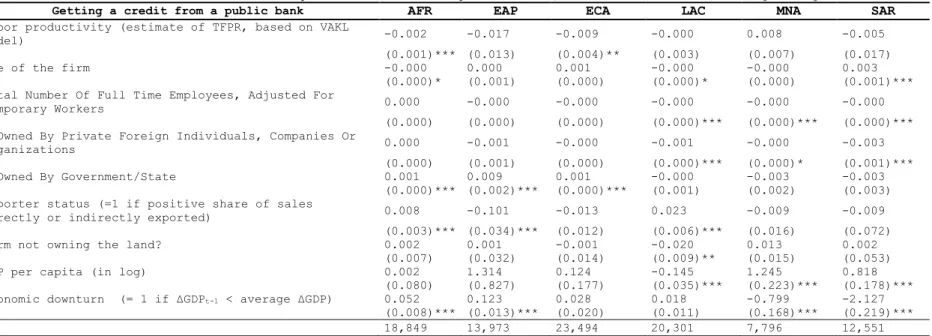
However, it has to be emphasized that results of table 3 represent average relationships that could mask significant differences between world regions or income groups. Notably, in light of the results presented in table 3, it is useful to question the conditions that facilitate or prevent the countercyclical role of public banks. According to the literature, this role seems to be conditional on the environment in which public development banks operate. Indeed, while the countercyclical effect is strong for public banks in South American, the evidence for Europe is more nuanced (Cull and Martinez-Peria, 2013; Iannotta et al., 2013). Moreover, there is evidence regarding other continents (Africa and Asia). For various authors, the institutional environment in which public banks operate plays an important role. The countercyclical role of public banks exists only in countries with good institutions (Betray et al., 2015). In weakly democratic countries, it would appear that public development banks are more politically driven (Frigerio and Vandone, 2020). Consequently, there is no guarantee that the presence of public development banks in countries with weak public governance is beneficial in mitigating the effects of adverse shocks.
Table 4 explores this issue further by providing results related to this countercyclical effect estimated on six subsamples corresponding to the six world regions. From this set of results is appears clearly that there is a significant amount of heterogeneity across regions and most probably banks. The countercyclical effect remains significant for Sub-Saharan Africa and East Asia and Pacific, becomes insignificant for Latin America, and Europe and Central Asia. Alternatively, the coefficient turns out strongly negative and significant for the Middle East and North Africa region and South Asia.
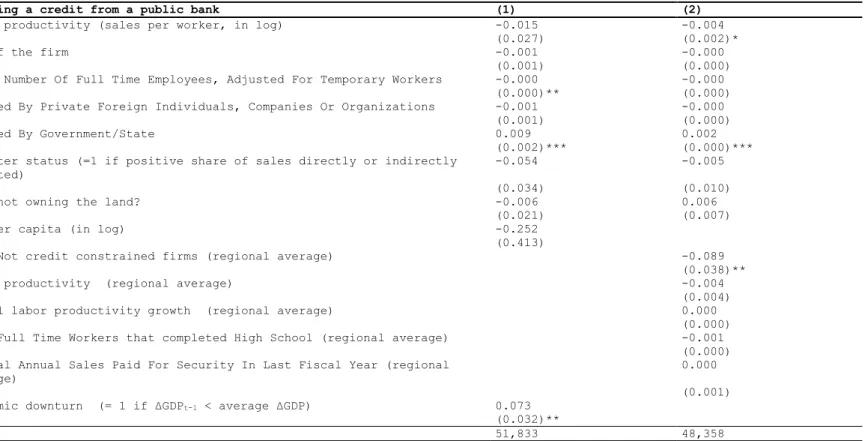
The first column of table 5 provides additional evidence of heterogeneity across public banks by displaying results for low and lower middle income countries. Interestingly for this set of countries, the countercyclical effect remains significant with a higher marginal effect than the one reported in table 3 over the whole sample with the occurrence of a crisis being associated by a higher probability of getting a public loan or credit of about 7 percentage points.
6 Using a dataset on the financial statements of 336 banks from 31 Latin American
and Caribbean countries over the period of 1995-2014, Brei & Schclarek (2018) find that during a crisis the real growth rate of lending of national development banks increased on average by more than 6 percentage points relative to normal times, whereas private foreign and domestic banks reduced their lending activity by more than 3 percentage points.
Table 4 : Heckman maximum-likelihood probit models with sample selection, 2006-2018. Results according to regions.
Getting a credit from a public bank AFR EAP ECA LAC MNA SAR
Labor productivity (estimate of TFPR, based on VAKL
model) -0.002 -0.017 -0.009 -0.000 0.008 -0.005
(0.001)*** (0.013) (0.004)** (0.003) (0.007) (0.017)
Age of the firm -0.000 0.000 0.001 -0.000 -0.000 0.003
(0.000)* (0.001) (0.000) (0.000)* (0.000) (0.001)*** Total Number Of Full Time Employees, Adjusted For
Temporary Workers 0.000 -0.000 -0.000 -0.000 -0.000 -0.000
(0.000) (0.000) (0.000) (0.000)*** (0.000)*** (0.000)*** % Owned By Private Foreign Individuals, Companies Or
Organizations 0.000 -0.001 -0.000 -0.001 -0.000 -0.003
(0.000) (0.001) (0.000) (0.000)*** (0.000)* (0.001)***
% Owned By Government/State 0.001 0.009 0.001 -0.000 -0.003 -0.003
(0.000)*** (0.002)*** (0.000)*** (0.001) (0.002) (0.003) Exporter status (=1 if positive share of sales
directly or indirectly exported) 0.008 -0.101 -0.013 0.023 -0.009 -0.009
(0.003)*** (0.034)*** (0.012) (0.006)*** (0.016) (0.072)
Firm not owning the land? 0.002 0.001 -0.001 -0.020 0.013 0.002
(0.007) (0.032) (0.014) (0.009)** (0.015) (0.053)
GDP per capita (in log) 0.002 1.314 0.124 -0.145 1.245 0.818
(0.080) (0.827) (0.177) (0.035)*** (0.223)*** (0.178)*** Economic downturn (= 1 if ΔGDPt-1 < average ΔGDP) 0.052 0.123 0.028 0.018 -0.799 -2.127
(0.008)*** (0.013)*** (0.020) (0.011) (0.168)*** (0.219)***
N 18,849 13,973 23,494 20,301 7,796 12,551
This table displays elasticities unconditional on sample selection using sampling weights. Equations include country, sector and year dummy variables.
Table 5 : Heckman maximum-likelihood probit models with sample selection, 2006-2018. Results for low and lower income coun-tries.
Getting a credit from a public bank (1) (2)
Labor productivity (sales per worker, in log) -0.015 -0.004
(0.027) (0.002)*
Age of the firm -0.001 -0.000
(0.001) (0.000)
Total Number Of Full Time Employees, Adjusted For Temporary Workers -0.000 -0.000
(0.000)** (0.000)
% Owned By Private Foreign Individuals, Companies Or Organizations -0.001 -0.000
(0.001) (0.000)
% Owned By Government/State 0.009 0.002
(0.002)*** (0.000)***
Exporter status (=1 if positive share of sales directly or indirectly exported)
-0.054 -0.005
(0.034) (0.010)
Firm not owning the land? -0.006 0.006
(0.021) (0.007)
GDP per capita (in log) -0.252
(0.413)
% of Not credit constrained firms (regional average) -0.089
(0.038)**
Labor productivity (regional average) -0.004
(0.004)
Annual labor productivity growth (regional average) 0.000
(0.000) % Of Full Time Workers that completed High School (regional average) -0.001
(0.000) % Total Annual Sales Paid For Security In Last Fiscal Year (regional
average)
0.000 (0.001) Economic downturn (= 1 if ΔGDPt-1 < average ΔGDP) 0.073
(0.032)**
N 51,833 48,358
This table displays marginal effects conditional on sample selection using sampling weights. Equations include country, sector and year dummy variables. Clustered standard errors in parenthesis.
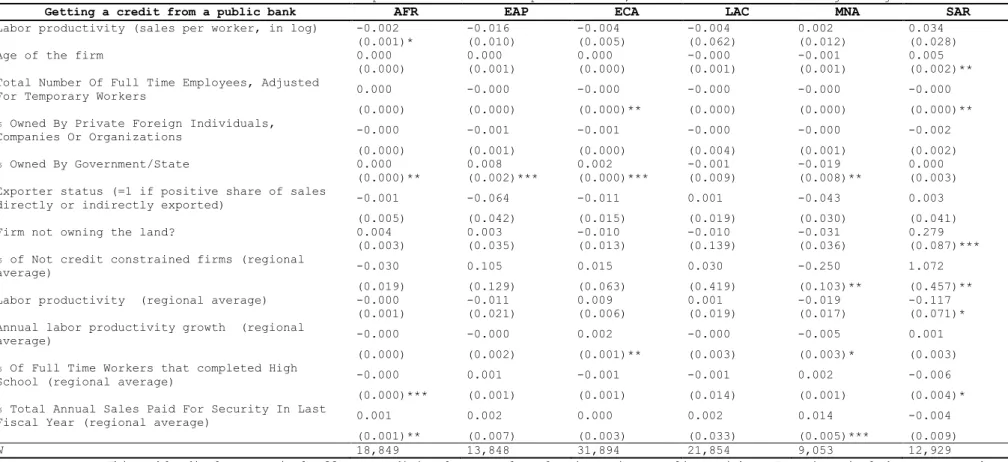
The second column of table 5 as well as table 6 explore further the heterogeneity issue by looking at differences in the factors explaining the regional allocation of credit or loan by public banks compared to private commercial ones. Here again it appears clearly that the nature of development mandates of NDBs varies greatly across income group and world regions. While the probability of getting a public loan or credit from NDBs in low and lower income countries is higher where the percentage of firms identified as credit constraints is high (table 5, column 2), regional characteristics influencing allocation differ across regions. It is notably the case for sub-Saharan Africa, where the probability of accessing public finance is relatively higher in regions where education is low (as for South Asia) but also where the costs associated to security are high. A similar effect is observed for the Middle-East and North Africa region. This result is particularly meaningful with regard to fragility as Besley and Mueller (2018) point out that firms operating in insecure environment spend a large amount of resources to develop protection mechanisms. Similarly, recent works show that violent events seriously disrupt business activities by reducing the performance of surviving businesses (e.g., Dupas and Robinson, 2010; Klapper et al., 2013; Amodio and Di Maio, 2018; Rozo, 2018) and inducing a stronger exit (Camacho and Rodriguez, 2013). Conflicts have a permanent effect on firms (Collier and Duponchel, 2013; Léon and Dosso, 2020) and affect investment dynamics in the long-run (Deininger, 2003, Singh, 2013). By providing a better access to finance in regions where financial risks are high due to violence, NDBs can play a stabilizing role by allowing firms to keep operating in difficult environments and providing jobs to the people is those areas. This stabilizing effect can be even more meaningful if this support of the private sector goes hand in hand with the financing of local government and public infrastructure.
Table 6 : Heckman maximum-likelihood probit models with sample selection, 2006-2018. Results according to regions.
Getting a credit from a public bank AFR EAP ECA LAC MNA SAR
Labor productivity (sales per worker, in log) -0.002 -0.016 -0.004 -0.004 0.002 0.034
(0.001)* (0.010) (0.005) (0.062) (0.012) (0.028)
Age of the firm 0.000 0.000 0.000 -0.000 -0.001 0.005
(0.000) (0.001) (0.000) (0.001) (0.001) (0.002)**
Total Number Of Full Time Employees, Adjusted
For Temporary Workers 0.000 -0.000 -0.000 -0.000 -0.000 -0.000
(0.000) (0.000) (0.000)** (0.000) (0.000) (0.000)**
% Owned By Private Foreign Individuals,
Companies Or Organizations -0.000 -0.001 -0.001 -0.000 -0.000 -0.002
(0.000) (0.001) (0.000) (0.004) (0.001) (0.002)
% Owned By Government/State 0.000 0.008 0.002 -0.001 -0.019 0.000
(0.000)** (0.002)*** (0.000)*** (0.009) (0.008)** (0.003) Exporter status (=1 if positive share of sales
directly or indirectly exported) -0.001 -0.064 -0.011 0.001 -0.043 0.003
(0.005) (0.042) (0.015) (0.019) (0.030) (0.041)
Firm not owning the land? 0.004 0.003 -0.010 -0.010 -0.031 0.279
(0.003) (0.035) (0.013) (0.139) (0.036) (0.087)***
% of Not credit constrained firms (regional
average) -0.030 0.105 0.015 0.030 -0.250 1.072
(0.019) (0.129) (0.063) (0.419) (0.103)** (0.457)**
Labor productivity (regional average) -0.000 -0.011 0.009 0.001 -0.019 -0.117
(0.001) (0.021) (0.006) (0.019) (0.017) (0.071)*
Annual labor productivity growth (regional
average) -0.000 -0.000 0.002 -0.000 -0.005 0.001
(0.000) (0.002) (0.001)** (0.003) (0.003)* (0.003)
% Of Full Time Workers that completed High
School (regional average) -0.000 0.001 -0.001 -0.001 0.002 -0.006
(0.000)*** (0.001) (0.001) (0.014) (0.001) (0.004)*
% Total Annual Sales Paid For Security In Last
Fiscal Year (regional average) 0.001 0.002 0.000 0.002 0.014 -0.004
(0.001)** (0.007) (0.003) (0.033) (0.005)*** (0.009)
N 18,849 13,848 31,894 21,854 9,053 12,929
This table displays marginal effects conditional on sample selection using sampling weights. Equations include country and sector dummy variables. Clustered (at region level) standard errors in parenthesis.
3.3 Robustness
Alternatively to the results obtained using Heckman maximum-likelihood probit models, this section assesses the robustness of our findings by using a different empirical strategy. We rely here on a simpler multinomial logit model. This model offers the advantage of not being dependent on the robustness of the selection process of the Heckman estimator and provides results that allow comparing factors influencing the probability of getting a public loan from those influencing the probability of getting a private one. However, this model by not specifying a selection equation might provide bias estimates if there are underlying factors explaining the probability of getting access to finance overall that are correlated with both probabilities of getting a loan or credit from a public or a private bank. Furthermore, it also makes it more difficult to assess the significance of the observed differences between equations explaining the average behavior of public and private banks.
As shown in Table A3 in appendix, conclusions drawn using the Heckman estimator remain similar. Firms that are more productive, larger, older, exporting, more able to provide collateral have a larger probability of accessing private finance. However, labor productivity as well as the ability to provide collateral are also positively associated with a higher probability of accessing public finance albeit to a lesser extent. There are two apparent significant differences between the factors explaining access to the two sources of finance. SOEs or companies partially own by governments or States have a higher probability to access public finance and the proportion of firms access private finance is positively associated with the level of GDP per capita.
Results from table 3 are reproduced in table A4 in appendix using the multinomial logit estimator. Estimated marginal effects remain consistent with the previous ones and confirm the main conclusion of the empirical analysis. Notably, public banks and NDBs in particular provide an easier access to finance than private banks in regions that lag behind as reflected by the negative marginal effect relative to education in the case of public bank, compared to the positive one for private banks. Furthermore, the stabilizing role of public bank is also displayed here as the crisis dummy variable remains positive and significant for public banks and turns out to be not significant for private ones.
Concluding remarks
Developing countries will not be able to achieve the 2030 Sustainable Development Goals if some regions are left out. Inequalities across regions and populations within countries are fundamental factors explaining the rise of discontent, political instability and, ultimately, fragility and internal conflicts. Public financial institutions and National Development Banks (NDBs) in particular are well suited to fill financing gaps in un- or under- served markets. By virtue of their developmental mandate, and local expertise, NDBs are able to operate and invest in the most vulnerable regions where the risk is often too great for a majority of private actors. In vulnerable areas, NDBs provide means to overcome first-mover disincentives and obstacles to risk-sharing and distribution while also playing a useful catalytic role in developing financial products and services. This study reflects on NDBs mandates in this context by shedding light on the significant role they can play to address scarcity of
financing in vulnerable areas within developing countries that may otherwise lead to lack of economic progress.
Using firm-level data for 127 countries over 2006-2018, we estimate how firm-level factors (such as size or labor productivity level), local factors (such as the regional average level of education of the workforce) or country-level factors (such as global economic shocks) impact the probability of getting a loan or a line of credit from a public bank. Firstly, we find that on average, there is no significant difference in terms of productivity levels between firms accessing private versus public finance. Secondly, NDBs tend to provide more finance in less developed localities relative to private commercial banks. Our results show therefore that public banks support more firms in less developed localities, without necessarily selecting less productive firms. Instead, they seem to be able to manage more risks related to the local context that fall outside of the direct control of the firm but that might affect their future portfolio performance (for example: insecurity, lower infrastructure resilience to climate shocks, etc.). Evidence also supports the emerging consensus that public banks play a countercyclical role by strengthening their credit offer during bad times, which raises interesting perspectives for the current Covid-19 pandemic.
From a policy perspective, our results suggest that governments can play an active role in providing access to finance to the private sector when global, national or local conditions are making the risk too high for private commercial bank, directly through national development and public banks. However, there seems to be a large amount of heterogeneity in the underlying rule explaining the geographic allocation of credit between income groups, regions and probably countries and banks. This is a consequence of the various mandates, either broad or narrow, given to those institutions by their shareholders. Adapting the mandates of public banks to the SDGs and maximizing their actions on sustainable development appear to be a critical step to insure they remain relevant. Not reviewing the mandate may prevent public banks from evolving and adjusting to the ever-changing environment in which it operates as well as not fully harnessing their potential as leading actors in vulnerable situations. Finally, the design of financing instruments adapted to a riskier environment lowering the resilience of firms looking for access to finance is necessary to insure that public banks design specific credit lines that are in coherence with the special needs that firms face in vulnerable environments.