Publisher’s version / Version de l'éditeur:
Journal of the Acoustical Society of America, 98, 5, pp. 2745-2752, 1995
READ THESE TERMS AND CONDITIONS CAREFULLY BEFORE USING THIS WEBSITE.
https://nrc-publications.canada.ca/eng/copyright
Vous avez des questions? Nous pouvons vous aider. Pour communiquer directement avec un auteur, consultez la
première page de la revue dans laquelle son article a été publié afin de trouver ses coordonnées. Si vous n’arrivez pas à les repérer, communiquez avec nous à [email protected].
Questions? Contact the NRC Publications Archive team at
[email protected]. If you wish to email the authors directly, please see the first page of the publication for their contact information.
NRC Publications Archive
Archives des publications du CNRC
This publication could be one of several versions: author’s original, accepted manuscript or the publisher’s version. / La version de cette publication peut être l’une des suivantes : la version prépublication de l’auteur, la version acceptée du manuscrit ou la version de l’éditeur.
For the publisher’s version, please access the DOI link below./ Pour consulter la version de l’éditeur, utilisez le lien DOI ci-dessous.
https://doi.org/10.1121/1.413240
Access and use of this website and the material on it are subject to the Terms and Conditions set forth at
Detection of acoustic second harmonics in solids using a heterodyne
laser interferometer
Moreau, A.
https://publications-cnrc.canada.ca/fra/droits
L’accès à ce site Web et l’utilisation de son contenu sont assujettis aux conditions présentées dans le site
LISEZ CES CONDITIONS ATTENTIVEMENT AVANT D’UTILISER CE SITE WEB.
NRC Publications Record / Notice d'Archives des publications de CNRC:
https://nrc-publications.canada.ca/eng/view/object/?id=cb3b7d6a-2ba2-4a0e-88d9-b2151f18cb2a https://publications-cnrc.canada.ca/fra/voir/objet/?id=cb3b7d6a-2ba2-4a0e-88d9-b2151f18cb2aDetection of acoustic second harmonics in solids using
a heterodyne laser interferometer
A. Moreau
Industrial Materials Institute, National Research Council of Canada, 75 boul. de Mortagne, Boucherville,
Qudbec J4B 6Y4, Canada
(Received 6 October 1994; accepted for publication 6 June 1995)
Acoustic second harmonic generation in solids is difficult to measure and often requires careful sample preparation. In this paper, a heterodyne interferometer modified to measure acoustic
fundamental and second harmonics is presented. It requires relatively little sample preparation and it provides noncontact, wideband, absolute, and pointlike measurements. It is shown that the output of an ideal heterodyne interferometer does not contain any even harmonics of a single-frequency acoustic signal. Odd harmonics, however, are produced in calculable amounts. A detailed model of the interferometer is introduced to account for various sources of spurious second harmonics and the model is experimentally verified. Three methods of calibration for the absolute measurement of surface displacement are presented. Measurements of the nonlinearity parameter, /3, of a fused quartz sample are shown to agree with literature values.
PACS numbers: 43.25.Dc, 43.25.Zx, 43.58.Ry
INTRODUCTION
Nonlinear acoustic measurements can provide informa-
tion on the microstructure or internal state of stress of mate-
rials,
and may permit
their nondestructive
characterization.
•
But nonlinear effects are difficult to measure, especially in industrial environments. For example, changes in acoustic
velocity with temperature or with applied stress are small
and temperature and stress are often difficult to vary. Other
techniques
based
on the detection
of acoustic
harmonics,
2 the
interaction
of multiple
acoustic
wavefronts,
3 and acoustic-
radiation-induced
static
strain
4 require
sensitive
transducers
calibrated for absolute amplitude measurements. The abso-
lute calibration is necessary to determine the matehal's third-
order elastic constants. Of these techniques, detecting second
harmonics may be the most practical because no applied
stress, no (slow) change in temperature, and only one acous-
tic source are used.
Acoustic second harmonic generation in solids is often
studied
using
a capacitive
transducer
5 as a detector
because
detectors able to measure absolute displacements with good
sensitivity, wide dynamic range, and wide bandwidth are re-
quired.
For example,
a 10-MHz,
40-• amplitude,
6000-m/s
longitudinal acoustic wave propagating a distance of 1 cm in
a material with a nonlinearity parameter,/3, of 5, develops a
20-MHz second
harmonic
of 0.1-• amplitude.
Capacitive
transducers, however, require time-consuming sample prepa-
ration and can only be implemented in the laboratory. Light diffraction techniques have been widely used to study harmonic generation of surface acoustic waves. The
surface waves create a diffraction grating upon which a light
probe
is reflected
with several
intensity
peaks.
6 By measur-
ing the amplitude of the various diffraction peaks, the
second- and higher-order acoustic harmonic amplitudes can be obtained. Several other optical techniques specific to sur- face acoustic waves are described in the literature. 7 These techniques are effective in establishing the diffraction pat-
terns of surface waves and for observing the growth of second- and higher-order harmonics. But they cannot be ap-
plied to bulk waves.
Optical detection of acoustic second harmonics using
interferometric
techniques
8-• may be an interesting
alterna-
tive. In addition to providing absolute values of the displace-ment, wide dynamic range, and wide bandwidth, they are
noncontact methods, require little or no sample preparation, and provide quick measurements. Their main disadvantage is reduced but adequate sensitivity. In contrast to capacitive techniques, which average the acoustic field over a large
area, optical interferometers can detect acoustic displace-
ments at a single point.
In this paper, a heterodyne interferometer modified to
measure acoustic second harmonics is presented. It is shown
that the output of an ideal heterodyne interferometer does not
contain any even harmonics of a single-frequency acoustic signal. Odd harmonics, however, are produced in calculable
amounts. A detailed model of the interferometer is intro-
duced to account for various sources of spurious second har-
monics and the model is experimentally verified. Measure- ments of the nonlinearity parameter, /3, of a fused quartz sample are shown to agree with literature values.
I. THE "IDEAL" HETERODYNE MICHELSON INTERFEROMETER
In a previous
paper,
•2 it is shown
that both
homodyne
and heterodyne interferometers can be configured to yield an electrical output proportional to the sine of the optical phase shift induced by an acoustic displacement of the sample sur-face. Although the heterodyne interferometer is conceptually
more complicated than the homodyne interferometer, it was
chosen because it provides improved isolation against me-
chanical vibrations and variations in the reflected light inten- sity.
Vast
Prob
...
!
Vu Vdet rmxer
'• •0 Volt
FIG. 1. Schematics of the Ultra-Optec OP35 heterodyne interferometer. The output signal Vu is proportional to the surface displacement.
(Ultra-Optec
OP35-O)
described
in the literature.
13'14
In the
schematic diagram shown in Fig. 1, the reference beam is frequency-shifted using a 40-MHz acousto-optic modulator (Bragg cell). The interference of the reference beam and of the probe beam reflected from the sample surface causes a 40-MHz variation of the light intensity at the photodiodedetector. Fluctuations in the path difference between the two
beams, caused by ultrasonic displacements of the sample sur-
face, phase-modulate the detected light intensity. The de- tected signal Vde t is
Vdet=A cos(roBt+4rrU(t)/k)=A cos(roBt+qv(t)), (1) where A is a proportionality constant, h is the wavelength of light, and U(t) and q>(t)=4rcU(t)/h are the acoustic dis- placement and probe-beam phase shift as a function of time t, and o• is the frequency of the modulation (Bragg fre- quency).
To extract the acoustic information, Vde t is mixed with another signal of frequency o•, but in quadrature:
Vde t sin roBt=A COS(roBt+ (p(t))sin robt. (2) This equation is expanded and all terms with frequencies above o• are neglected (they are electronically filtered out). The output signal Vu is
Vu = - (A/2)sin (p(t)• - (A/2) (p(t), (3) where the last approximation is valid for qv•<l, i.e., for acoustic displacements much smaller than the optical wave- length. The demodulated signal is linear in the surface dis- placement to first order. To higher orders, only odd powers of qv(t) are present, and in amounts proportional to the Taylor
expansion coefficients of the sine function.
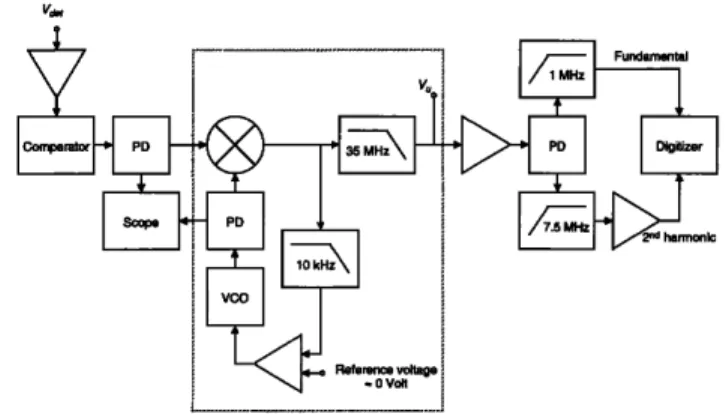
The electronic implementation of this demodulation scheme is shown in Fig. 2. A mixer is used as the multipli- cative element between Vde t and a quadrature signal gener- ated by a voltage controlled oscillator (VCO). The output 35-MHz low-pass filter eliminates all frequencies above o•. A 10-kHz feedback loop maintains the 90 ø phase relationship between Vde t and the quadrature signal in the presence of ambient vibrations. This method of compensation is more
effective than the actuated mirror of the homodyne interfer-
ometer because it does not involve an electromechanical
feedback loop of limited bandwidth caused by mirror mass
and piezoelectric resonances. A second advantage of this de-
modulation scheme is ease of calibration. The proportionality
FIG. 2. Electronic demodulation and processing of the detected signal for a 5-MHz acoustic wave. Items identified as "PD" are power dividers and "VCO" is a voltage-controlled oscillator. The section within the dotted box performs the phase demodulation.
constant A of Eq. (3) can easily be determined by unlocking the phase-locked loop. The circuit's output Vu then settles to
some
frequency
equal
to ]o•-Wvco[.
As the relative
phase
of
the two mixer inputs goes through 2r r, the output of the interferometer is a sine wave of amplitude A/2.
For a sinusoidal acoustic signal of the form
U(t)=U1 sin rOut and writing qOl=47rU1/h , Vde t of Eq. (1) can be expanded into its frequency components as follows (the proportionality constant A is neglected for simplicity): Vdet=COS rOBt COS(qVl sin rOut)--sin rOBt sin(qvl sin rOut)
= E Js(qOl)COS(rOB+SrOu)
t,
(4)
where the following identities are used:
cos(x
sin O)
= Jo(x)
+ 2 • J2i(x)cos(2i
0),
i=1
(5)
sin(x
sin 0)=2• J2i_l(x)sin((2i-
1)0),
i=1
S_i(x)-(- 1 )iSi(x
).
Equation (4) shows that the phase-modulated light signal contains a carrier frequency and an infinite number of lateral sidebands, the sth sideband having a relative amplitude Js(qVl). These relative sideband amplitudes of the detected
signal are easily measured on a spectrum analyzer. The de-
modulated and low-pass filtered output of this signal be-
comes
Vde
t sin rOBt=sin
rOb
t E Js(qOl)COS(rOB+SrOu)
t,
$--- •00
oo,/OOu
(6)
Vu
=-
•
Js(
qVl)sin
SrOat.
s= l,s odd
Equation (6) shows that the electronics do not generate any
even harmonics of the acoustic signal. Only odd harmonics
are produced in amounts proportional to Js(qVl), where s is the order of the harmonic. Unlike Eq. (3), this result is not restricted to small acoustic displacements.
II. THE NONIDEAL INTERFEROMETER
Unfortunately, many experimental factors complicate this simple analysis. There are many potential sources of spurious second harmonics and each one must be given care- ful consideration. This section presents these sources in the order they appear during signal processing.
A. Amplitude modulation of the photodetector's
output
Sample surfaces are generally rough and the amount of light collected may vary from point to point on the surface. Alternatively, a mirrorlike surface may not be flat and the
optics
may become
misaligned
as the sample
is translated
in
front of the probe. Consequently, the calibration of the inter- ferometer may apply only to a specific location. Moreover, an ultrasonic wave arriving at the sample surface with an oblique incidence angle may cause the probe beam to be reflected with a time varying angle so that the interferom- eter's optics may move in and out of alignment.
In fact, it is observed that the output of the photodiode,
Vdet,
is both phase
and amplitude
modulated
by the acoustic
signal. It is difficult to understand the source of this phenom- enon. Electromagnetic feedthrough is rejected because the amplitude modulation is approximately correlated in time
with the arrival of the acoustic wave, and not with the elec-
trical excitation of the generation transducer. By blocking the reference beam and positioning the photodiode so that only
half the reflected beam falls onto the detector's active area
(such
as in a knife
edge
techniqueS5),
a signal
varying
at the
excitation frequency is observed which indicates that the probe beam is reflected at a time varying angle. Note that
even if the beams are well centered on a sufficiently large
detector (and on every optical component), an amplitude
modulation of the carder can be observed because the vary-
ing reflection angle of the returning beam may cause the two beams to be relatively misaligned and to interfere with a varying amplitude. The reference beam acts as an aperture of finite dimensions.
Although these explanations appear reasonable, it is not
known how the acoustic wave could cause a time-varying
reflection angle of the light probe. A lithium niobate trans- ducer is bonded to a suprasil W1 sample with a thin layer of oil and generates a longitudinal wave which travels to the opposite surface. This surface is coated with a thin layer of A1 (• 1 /zm) to improve its reflectivity and with a thin SiO 2 protective overcoat. The light probe is in the axis of the transducer. In this geometry, the longitudinal acoustic wave
should make the surface vibrate as a whole, in the normal
direction and without any angular variations. Surface defects or dust particles should not move in and out of the probed region as they might for a shear wave. Oblique incidence waves and non-normal displacements, however, may occur due to transducer edge waves or reflections from the sides of the sample. This could cause a tilt of the surface and the observed time-varying reflection angle. Further work will be required to explain quantitatively the origin of this amplitude modulation. We have not investigated this effect further be- cause the amplitude modulation can be removed by elec- tronic processing, as will be seen below.
Some consequences of this amplitude modulation can be derived. For amplitude modulation and acoustic displace-
ments of the form
A(t)=Ao+Ai cos(rout+ •b),
(7)
U(t) = U1 sin rout, Eq. (4) becomes
Vdet=(Ao+Ai
cos(rout+
qb))
• Js(rpi)cos(roB+Srou)t.
(8)
For small values of tp• and A •/A o , keeping only the carrier
and the first lateral bands of the frequency spectrum,
Vdet=A0{cos rob t + ( q01/2)[cos( rob q- rou)t
- cos( roB-- rou)t]} + (A 1/2){cos[ ( rob + rou)t + •b]
+ cos[(roB-
rou)t- •b]}.
(9)
The term proportional to A0 represents the carrier and the first sidebands in the absence of amplitude modulation. The second term affects the amplitude and the phase of the first sidebands. Depending on the value of &, the amplitude dif- ference of the two lateral bands relative to the carder ampli- tude can be as large as A •/A o .
When Eq. (7) is substituted into Eq. (3), we obtain Vu = -(tpi /2)[Ao+Ai cos(rout+ &)]sin rout
A• A•
tpl A0
sin
rout- sin
=--5-
-5-
-5
'
(10) The demodulated signal contains an additional dc level and a second harmonic equal to A •/2Ao times the fundamental am- plitude. This ratio is typically a few percent for acoustic
amplitudes
of about
100 3, and
is comparable
to the second
harmonic amplitude generated in most solids.
To remove the effects associated with amplitude modu- lation, Vde t is converted into a phase-modulated square wave,
Vsq,
using
a comparatorlike
circuit.
This circuit
maintains
Vsq
at a constant
amplitude
if Vde
t is larger
than
some
mini-
mum value. The system is therefore largely insensitive to variations in the amount of collected light or to amplitude
modulations of Vde t .
The phase-modulated
Vsq
can be written
as a phase-
modulated Fourier expansion of a square wave:
4 1
=--
•
-cos n(roBt+rp(t)).
(11)
Vsq
•1'
n=
l,n
odd
Replacing
(p(t) by (p] sin rout
and
using
Eq. (5), Vsq,
reduces
to4 • • Js(nrPl)
cos(nroB+Srou)
t
Vsq
= 7/'
n
= 1,n
odd
s
= -
(12)
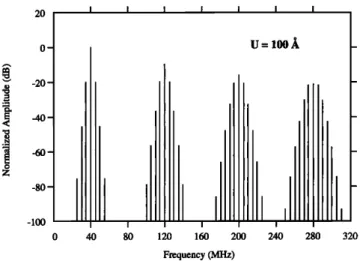
Such a frequency spectrum is shown in Fig. 3. Only odd harmonics of the carrier are present and they decrease in amplitude as 1/n. Each of these harmonics is phase modu-
20 0- -20 - -40- -80 - I I I I I I I U= 100A
I
I -100 • • i 0 40 80 120 160 240 280 320 Frequency (MHz)FIG. 3. Frequency spectrum of Vsq for o•=40 MHz, Wu=5 MHz, and
U1 = 100 • (qo1---0.2).
lated with lateral bands of relative amplitude equal to Js(nq•]). Note that the relative intensifies of the (fundamen- tal) carrier and of its sidebands, the n = 1 term in the expan-
sion,
are unchanged
from Eq. (4). When
Vsq
is used
as the
input of the demodulation circuit of Fig. 2, the higher-orderharmonics of the carder and their sidebands are mixed with
the 40-MHz frequency of the VCXO. The non-negligible (i.e., those with small enough values of s) additional compo- nents of the mixer output produced are all above the carrier frequency, to•, and are removed by the output low-pass filter. Therefore, the output signal, V u , reduces to that of Eq. (6), and all problems associated with unsteady calibrations and amplitude modulation of the carder frequency are elimi-
nated.
B. Distortions of the comparator circuit
There are three principal sources of distortion introduced by the comparator (and detector) circuit: second harmonic generation and frequency dependence of the gain and propa- gation delay. The comparator circuit may generate second (and higher) harmonics of its input signal and, in particular, of the carrier frequency and its sidebands. When mixed with the in-quadrature signal, these harmonics produce a signal below to• that appears like peaks in the noise spectrum. If the acoustic signal has a narrow bandwidth, this extra noise can often be filtered out. In general, the second harmonic genera- tion can be controlled by maintaining the comparator's input signals at relatively low levels.
Frequency variations of the gain and of the propagation delay are more serious difficulties. The mixer is an element producing output frequencies at the sum and difference of its two input frequencies. Therefore, when Vde t is mixed with the VCO quadrature signal, the positive and negative sth sidebands yield signals of frequencies +_sto a . Because of their phases, the positive and negative sidebands add for odd values of s and cancel for even values of s. The precise cancellation of the even harmonics, however, is possible only
if the comparator circuit and any other component between
the photodetector and the mixer do not alter the relative phase and amplitude of these sidebands.
If the gain of the amplifier at the frequency of the side- band s is A_+s and if A_+s=Ao + AA_+s, Eq. (6) becomes
w B/w u
V•=-
•
AoJ•(•)sin
s= l,s odd
1 WB/wu
2 •
S--- -- ro B /rouAA•d•(•l)sin
swat.
(13) The correction terms are in phase with the acoustic signal
and affect the dc offset and all harmonics of the demodulated
signal. For small values of qVl, the ratio of the spurious sec- ond harmonic to the fundamental is equal to
Vu2 AA2J2(rPl)-AA-2J-2(rPl) AA2-AA-2
Vul 2AoJI(rPl) 8Ao
(14) For (AA2-AA_2)/Ao=O.1 dB (a value attainable with high
quality
amplifiers)
and U=100 3., Vu2=0.029
3.. Conse-
quently, the frequency dependence of the gain can be con- trolled sufficiently well to contribute a negligeable amount to the total second harmonic signal.If the propagation delay of the amplifier, At s , is not constant as a function of frequency, phase shifts •s=(to•+SOOu)Ats must be introduced in Eq. (6) and we find that
Vsq
sin
coBt=sin
OaBt
S
1
1 •/•u
Vu
= - • J0(½l)
sin
•0- • •l Js(½i)sin(swu
t+ •s)
- J_s( q•l )sin( s oOut- C)_s).
Assuming that •bs•l and choosing •b0=0, Vu reduces to
VH -- •
rob/rou
s= l,s odd
J•(•)sin
•o•t+
•- .• ('•d•(•)
COS S O• u t. (16)
The correction terms affect all harmonics of the demodulated
signal but they are 90 ø out of phase with the acoustic signal. For small values of qh, the ratio of the spurious second har-
monic to the fundamental is equal to
Vu2 02J2(g>l) q- 0-2J-2(g>l)
Vul 2Jl(qOl)
•(•b2+
•b-2)
•-. (17)
In Eqs. (15)-(17), •b• are the phase shifts due to the variation between the propagation delays at the frequency of the side- band considered and at the carrier frequency to•. Therefore, the consistency of the propagation delay is more important at high frequencies because a small variation in time delay leads to a larger phase shift. For •b2 = •b_2 = 25 mrad (100 psat 40 MHz) and U-100 3., Vu2=0.12
3.. Since
few ampli-
fiers are capable of keeping the propagation delay constant to this precision, this source of second harmonic generation is perhaps the most serious of those investigated here. Addi-tionally, the photodetector capacitance creates an unavoid- able low-pass filter that affects the uniformity of the propa- gation delay. To reduce this problem, a 350-MHz silicon photodiode is used as a photodetector.
C. Phase error of the quadrature signal
If the angle between the quadrature signal and Vde t or
Vsq
differs
from 90
ø by an amount
4• in Eq. (6), then Vu
becomes
1
OOB/OOu
Vu=•
sin
• J0(q>l)-COS
• • Js(q>l)sin
s= l,s oddSmut
w B/w u+sin 4• •
Js((4:>l)COS
Smut.
(18)
s = 2, s even
This phase error introduces a dc offset of amplitude
1
• sin4• J0(q>l) and even harmonics of amplitude sin 4• Js(qh) which are phase shifted by 90 ø. For small qh and 4•,
Vu2
_ J2(qOl)sin
•
q•l
Vu'•--
jl((4:>l)COS
(•(• -•-.
(19)
Note that Eq. (18) is a special case of Eq. (15) for
4C+•=4•0=4•.
For a fundamental
amplitude
of 100 • and
4•=1ø=17 mrad, the electronics generates a second har-monic
with amplitude
of 0.09 •. Since
this signal
is a sub-
stantial fraction of the second harmonic that may be gener- ated by the material, the quadrature angle must be adjusted to better that one degree.Here, Vsq
is mixed
with the in-quadrature
signal
and the
output, V u , is filtered to retain only the dc component. The difference between the dc voltage and a reference voltage is used in a feedback loop to adjust the phase (frequency) of the VCO until the dc output of the mixer equals the reference voltage (see Fig. 2). For an ideal mixer, quadrature detection occurs for a zero reference voltage. In practice, the mixer and the difference amplifier have dc offsets so that the reference voltage must be adjusted to a nonzero value. To find the proper reference voltage, the feedback loop is unlocked and the dc level of Vu is measured. Then the feedback loop is locked again and the reference voltage is adjusted until the dc level of Vu equals the previously measured value.
D. Mechanical vibrations and laser fluctuations
The feedback loop compensates for low-frequency me- chanical vibrations and maintains the phase of the quadrature signal. Because some residual dc offset must be present to
drive the loop, the fluctuations in the dc offset caused by
mechanical vibrations are reduced by a factor equal to the gain of the loop at the frequencies considered. The remaining error signal corresponds to a time-varying phase 4•(t) that produces a varying amount of second harmonics. The situa- tion, however, is improved by increasing the gain of the loop and mechanically isolating the interferometer. As mentioned in Sec. I, one advantage of the heterodyne interferometer is that the quadrature is maintained electronically. Conse- quently, larger gains and better tracking can be obtained than with homodyne interferometers which must use a movable
mechanical component. Moreover, because the sign and am-
plitude of vibration-induced second harmonics are uncorre- lated in time, time averaging techniques can reduce these harmonics greatly.
Our interferometer uses a multimode, 10 mW He-Ne
laser. The modes are unstable and shift in frequency to create a •50-kHz phase noise similar but of higher frequencies
than the noise produced by mechanical vibrations. The feed-
back loop cannot compensate for this high-frequency noise. This problem can be reduced if the probe and reference beam path lengths are equal or if a single mode laser is used. This
laser noise contributes to second harmonic generation but, as
for mechanical vibrations, the sign and amplitude of these harmonics are uncorrelated in time and time averaging tech- niques can reduce these harmonics greatly.
E. On the use of mixers
Mixers are highly nonlinear elements. They distort the expected output because of their dc offset, harmonic genera-
tion, two-tone intermodulation, and imperfect isolation of the
input ports. These problems, however, can be reduced by saturating the Lo input port and sufficiently reducing the
amplitude at the rf input port.
F. Signal-to-noise ratio
Because the second harmonic amplitude is much smaller
than the fundamental amplitude, and because the sensitivity of optical detection techniques is less than that of other tech-
niques, the second harmonic is usually hidden in the wide- band noise. As with all other optical techniques, the signal-
to-noise ratio can be improved by increasing the amount of
detected
light
and
reducing
the detection
bandwidth.
15
Signal
averaging also works well. With the current system, secondharmonic
amplitudes
smaller
than
0.05 3, superposed
onto
a
fundamental
amplitude
of 80 • or more
can be detected.
G. On the use of amplifiers and digitizers
All amplifiers generate an amount of second harmonics proportional to the square of the amplitude of the fundamen- tal frequency. Therefore, if the output amplifier is operated with electric signals that are small enough, its second har- monic contribution will be negligible.
Digitizers have limited dynamic ranges (e.g., a 12-bit ADC has a dynamic range of 72 dB at best) and nonlinear responses at the level of precision required here. It is there- fore imperative to separate the fundamental from the second harmonic components of Vu with analog filters, and to digi- tize both signals separately so that any harmonics produced by the digitization of the large-amplitude fundamental will not be superposed to the acoustic small-amplitude second harmonic. Consequently, numerical filtering of the wideband signal must be avoided.
H. Calibration of the interferometer
There are three possible methods to calibrate the inter-
ferometer. In the first method, a sample is excited with a
content of Vde t is analyzed using a calibrated spectrum ana-
lyzer. The amplitude
ratio of the first sidebands
[s =_+ 1 in
Eq. (4)] to the carrier is equal to J•(qo)/Jo(qO)•qo/2
•2rrU0/X for qo•l. This measurement of the acoustic dis- placement is compared to V u and provides a calibration of
the interferometer.
•6 Because
the displacement
can be ob-
tained directly from the photodiode's current signal without any further electronic processing, this method should be the most reliable. It, however, requires a spectrum analyzer able to measure amplitudes to 0.1 dB accuracy for 1% accuracy in the calibration. Additionally, the previously discussed ampli- tude modulation of Vde t introduces a source of error in the measurement of the first sidebands [see Eq. (9)]. For best
results,
this calibration
should
be made
using
Vsq
instead
of
Vdet-
If the feedback loop of Fig. 2 is opened, the VCO fre- quency does not exactly match the Bragg frequency. The phase error 0 fluctuates through 2rr and Vu oscillates be- tween ___ Vma x which is equal to -A/2 in Eq. (3). Therefore,
the interferometer calibration at 0=0 is given by
Vu( t ) 4rrU(t)
• = sin qo(t)• •. (20)
l/ma x X
A third method relies on the relationship between the phase and the mixer's dc output. From Eq. (18), it can be seen that measuring dVu/d 0 at 0=0 and qo:0 gives Vma x '
dVu 0=0 -Vma x (21) and Vu( t ) 4rrU(t) qo(t)- (22)
[aVu/a],=o
For 00=0, this calibration method gives the same results as
Eq. (20) because
dVu/dc)l•=o
is equal
to Vma
x for a sine
waveform. In the general case, the mixer's output is related
to the phase
of its two inputs
through
the function
V u (
This function can be measured by unlocking the feedback loop: If no acoustic displacement is present (qo:0), 0 varies from 0 to 2rr linearly (as long as the VCO's frequency sta- bilizes to a fixed frequency) and Vu(0+qo) is easily mea- sured. Any linear portion of V u (0) can be chosen to demodu-
late Vde
t . In this case
(and for small
acoustic
displacements),
the calibration is
Vu(t) 4rrU(t)
[dVu/dO]O:0o X
(23)Given their range of applicability, the three calibration methods are experimentally self-consistent. The third method is perhaps preferable because it does not require a spectrum analyzer and works even if the mixer's output is slightly
distorted. Note that when the two input signals are square
waves, the mixer's output is linearly related to its inputs' phase difference. Although this would seem advantageous because no precise adjustment of the quadrature phase would be required, the square waves are often distorted and the mixer's output is only approximately linear.
III. DISCUSSION AND EXPERIMENTAL RESULTS
To verify that the interferometer and associated electron- ics operate according to the model described by Eq. (18), we measured the following five quantities of Vu as a function of
0 in a suprasil W1 (fused quartz) sample: dc offset, funda- mental amplitude and phase, and second harmonic amplitude and phase. Suprasil W1 was chosen because of its relatively large nonlinearity and sample to sample reproducibility as measured by other authors. The sample was a cylinder of one
1
inch diameter and 5 in. in length. A 4.9-MHz, 1-in.-diam, LiNbO3 transducer was bonded with oil to one of the two flat
faces. The other face was coated with A1 to increase the
amount of probe light reflected. The measurement was per-
formed in the near acoustic field whereby the Fresnel param-
eter
(equal
to Xz/a
2, where
X is the acoustic
wavelength,
z is
the distance traveled by the acoustic wave, and a is the ra-dius of the transduder's
active
region)
l? for this geometry
was equal to 0.08. It was also experimentally verified that the fundamental amplitude of the first echo was uniform over a large area near the center of the detection surface.
Given the additional contribution of the sample nonlin- earities to the second harmonic, Eq. (18) must be rewritten as Vu= 2 Vmax(( sin 0/2)J0(qo•)+cos 0J•(qo•)sin mat
+ sin •J2(qøl)COS 2mat + cos •Jl(qO2)sin 2mat), (24) where % and qo 2 correspond to the phase shifts due to the acoustic fundamental and second harmonic, respectively. The dc offset, the fundamental amplitude and phase, and the sec- ond harmonic amplitude and phase as a function of 0, are given the respective symbols Vuo, Vu•, 0•, V•2, and 02, and are fitted to the following equations:
Vuo = Vma x sin( 0 - 00) J0 ( qo 1 ) q- V0, Vul=2Vmax cos(O- OO)Jl(qOl),
01--a constant,
Vu2
= 2 Vmax
x/(sin
( •b--
•b0)J2(
rpl
))2 + (cos(
•b- •bo)
J1
(rp2))
2,
02 - arctan
cos(0-
sin(
0-
00)J2(qo•)
00)J(2) + 00,
)
(25) where V 0 is some offset voltage, and 00 and 00 are arbitrary phases. To perform these measurements, the quadrature phase error, 0, is selected by varying the reference voltage of the feedback loop. The least-squares fits and the measured values are shown in Fig. 4 (to the accuracy of the measure- ment, 0• is constant and is not shown). The voltage ampli- tudes are as measured and the scales do not match because ofthe various electronic gains. Each of the four graphs is fitted independently of the other three. The fitted parameters are compared in Table I where they have been corrected for the
various electronic calibrations and gains.
Table I also shows the values of the parameters obtained during calibration. Section II discusses how the calibration of the interferometer yields a value of Vma x . Of the three cali- bration methods discussed, the last two were applied: Mea- suring the amplitude (method II) and the slope at zero output voltage (method Ill) of the interferometer's low-frequency
100 5o -5o -lOO 50 -5o ' Phase of 2 ud ' harmonic (degrees) I I I -60 -40-20 I I I, I 0 20 40 60
.
Ampli.md•
of
2
•a .•
. . I I I I I I I -60 -40 -20 0 20 40 60 (degrees) • (degrees)FIG. 4. dc offset, fundamental amplitude, and second harmonic amplitude and phase of Vu as a function of •b in a suprasil W1 sample. The squares are the measured values and the solid lines are least-squares fits to subexpressions of Eq. (25). The phase difference, qb, is determined from the least-squares fit to the
dc offset measurements. The abscissa do not match and the fitted parameters are shown in Table II.
oscillations when the feedback loop is unlocked. These two
calibrations are in excellent agreement with the value of Vma x obtained from Vuo (see Table II). The dc component of V u when the loop is unlocked is converted to 00 and compared to values of 00 found from the graphs of Vui and 01: these values agree to within one degree. The two values of 00 extracted from Vu2 and 02, however, agree well between themselves but differ significantly from the previous three. The two fitted values of qol also agree between themselves. The model describing the interferometer is essentially
TABLE I. Various parameters extracted from the fitted curves shown in Fig. 4, from two calibration procedures, and from unlocking the phase-locked loop.
Vmax (•1 •2 q•0
Measurement (mV) (radian) (radian) (deg)
Calibration II Calibration III Loop unlocked dc offset (Vu0) Fundamental amplitude (Vu •) Harmonic amplitude (Vu2) Harmonic phase (02) 109.8 ... 108.8 ... ... 0.7 109.5 ... 0.0+0.5 ß -. 0.165 .-. 0.6+0.4 0.173 9.3x10 -4 -7.7_+0.4 -7.2_+0.4
valid but the presence of two different values of •0 is
troublesome. In the previous section, it was seen that non-
uniform gains in processing Vde t could lead to a spurious second harmonic that was in phase with the acoustic second harmonic. It was also seen that two other sources of spurious second harmonics, the nonuniform propagation delays of Vde t and the phase error of the quadrature signal, generate second harmonics that are 90 ø out of phase with the acoustic second harmonic (see Table II). Of these three sources, the nonuni- form propagation delays of Vde t was estimated to have the largest contribution. If all spurious sources of second har- monics are small, then the quadrature phase error can be adjusted so that the sources that are 90 ø out of phase with the acoustic signal cancel each other. In this case, a plot of Vu2 as a function of • may show a minimum for a value of •0 different from the one for which the maximum of Vu• oc-
TABLE II. Summary of second harmonic contributions for a sinusoidal acoustic excitation of frequency w u .
Source Magnitude Phase
Acoustic J 1 (•2) cOS q• 0ø Uniformity of gain of Vde t (AA 2- AA_2)J2(q>) 0 ø Uniformity of phase of Vde t (sin qb2+sin q•_2)J2(•) _+90 ø Quadrature phase error J2(%)sin qb +90 ø
curs. This would explain the two different values of •b0 ob-
served in Table I. If this is true, then the interferometer
should be operated at the value of •b0 obtained using Vu2 and 02 when measuring second harmonic generation. Moreover,
because the acoustic fundamental and second harmonic var-
ies as the cosine of •b, the small adjustment in •b0 used to cancel spurious second harmonics does not affect the acous- tic measurements significantly. In the case presented in Fig. 4 and Table I, the discrepancy of about 8 ø corresponds to an error of only 1% in the measured acoustic fundamental and second harmonic amplitudes. Alternatively, additional terms were added to Eq. (24) to attempt to model some of these
nonlinearities. The results were inconclusive because these
terms are not sufficiently independent from those already
mentioned or from each other.
The spurious second harmonics that would be in phase with the acoustic second harmonic (the most important one being the nonuniform gains in processing Vdet) cannot be canceled out in a manner similar to the spurious harmonics
that are in quadrature. Therefore, these contributions will be
considered negligible if the measured nonlinearity parameter of the Suprasil sample agrees with values found in the litera- ture. The values of q>• and q>2 extracted from Fig. 4 yield a
fundamental
surface
amplitude
of 83 ]k and a second
har-
monic
amplitude
of 0.46 ]k (the bulk amplitudes
are half
these values). The corresponding absolute value of the non-linearity parameter/3 is 13.7.
In another series of experiments, the interferometer was set to operate at the value of qb 0 that minimized the second harmonic amplitude. Measurements were made at 4.9, 7.4, and 10.0 MHz, in samples 0.25 and 0.5 in. thick, with acous- tic amplitudes ranging from 3 to 6 nm, and by three different experimenters. The average and standard deviation of these
measurements
yielded
I/1-13.4_+
1.2. The result
is in reason-
able agreement with the values /3=-11.6 (Ref. 18) and -12.7 (Ref. 4) quoted in the literature. Therefore, the con- tribution of the spurious second harmonics that are in phase
with the acoustic second harmonic are small and we believe
that the interferometer gives a reliable measurement of the
second harmonic amplitude.
IV. CONCLUSION
We measured the nonlinearity parameter /3 of suprasil W1 using a heterodyne interferometer to detect the absolute displacement of the sample's surface. The interferometer can
detect
second
harmonic
amplitudes
smaller
than
0.05 ]k su-
perposed
onto fundamental
amplitudes
greater
than 80 ]k
(dynamic range >64 dB). The main advantages of this method are the speed at which the measurements are made and the small amount of sample preparation required. In principle, one could measure samples with rough surfaces and no sample preparation if a sufficiently powerful detec- tion laser were used. Moreover, the method allows for point detection of surface motion, in contrast to capacitive or pi- ezoelectric detection methods that average the acoustic sig- nal over a large area. This characteristic has permitted thedetailed measurement of the second harmonic displacement
field.
•9 Although
this interferometer
is still a laboratory
in-
strument, it could be an important technological advance to- ward industrial applications of nonlinear acoustics.ACKNOWLEDGMENTS
The author thanks Jean-Pierre Monchalin and J. Bus- si•re for helpful discussions and Martin Lord for invaluable technical assistance. This work was supported in part by the CANDU Owner's Group.
• For a recent review, see J. H. Cantrell and K. Salama, "Acoustoelastic
characterization of materials," Int. Mater. Rev. 36, 125-145 (1991).
2M. A. Breazeale and J. Philip, "Determination of third-order elastic con-
stants from ultrasonic harmonic generation measurements," in Physical Acoustics, Vol. 17, edited by W. P. Mason and R. N. Thurston (Academic, New York, 1984), p. 1-60.
3p. Li, W. P. Winfree, W. T. Yost, and J. H. Cantrell, Jr., "Observation of
collinear beam-mixing by an amplitude modulated ultrasonic wave in a solid," Proceedings of the IEEE Ultrasonics Symposium, Cat No. 82CH1947-1, edited by B. R. McAvoy (Institute of Electrical and Elec- tronics Engineers, New York, 1983), pp. 1152-1156.
4W. T. Yost and J. H. Cantrell, Jr., "Acoustic-radiation stress in solids. II.
Experiment," Phys. Rev. B 30, 3221-3227 (1984).
5W. B. Gauster and M. A. Breazeale, "Detector for measurement of ultra-
sonic strain amplitudes in solids," Rev. Sci. Instrum. 37, 1544-1548 (1966).
6E. G. Lean, C. C. Tseng, and C. G. Powell, "Optical Probing of Acoustic
Surface-Wave Harmonic Generation," Appl. Phys. Lett. 16, 32-35 (1970).
7 For a review, see G. I. Stegeman, "Optical Probing of Surface Waves and
Surface Wave Devices," IEEE Trans. Sonics Ultrason. 23, 33-63 (1976).
8 D. Doughty, "A laser interferometer technique for measuring sound har-
monic distortion in the acoustic output of a transducer," Report No.: TM- 681-02, Pennsylvania State Univ., Institute for Science and Engineering, Ordinance Research Lab., University Park, PA. (27 March, 1970).
9B. A. Auld, S. Ayter, and M. Tan, "Filter Detection of Phase-Modulated
Laser Probe Signals," Electron. Lett. 17, 661-662 (1981).
•øYutaka Abe and Kazuaki Imai, "Interferometric measurement of the third-
order elastic constants in germanium and gallium arsenide," Proceedings of the IEEE Ultrasonics Symposium, Cat No. 85CH2209-5, edited by B. R. McAvoy (Institute of Electrical and Electronics Engineers, New York, 1985), pp. 1109-1112.
n Xie Wenxiang, "Sonde h6t6rodyne laser h r6solution optimis6e pour les
mesures d'ondes de surface en propagation non lindaire et en milieu mul-
ticouche," Doctoral thesis, Universit• de FRANCHE-COMTE, 1988.
•2A. Moreau and J. Bussi•re, "Detection of acoustic second harmonics us-
ing a laser interferometer," Rev. Prog. in Quant. Nondest. Eval., edited by
D. O. Thompson and D. E. Chimenti (Plenum, New York, 1993), Vol. 12,
pp. 2051-2058.
13j. p. Monchalin, R. H•on, and N. Muzak, "Evaluation of Ultrasonic In-
spection Procedures by Field Mapping with an Optical Probe," Can. Met- all. Q. 25, 247-252 (1986).
•4j._p. Monchalin, J.-D. Aussel, R. H•on, C. K. Jen, A. BoudreauIt, and R.
Bernier, "Measurement of in-plane and out-of-plane ultrasonic displace- ments by optical heterodyne interferometry," J. Nondest. Eval. 8, 121- 133 (1989).
15 j._p. Monchalin, "Optical detection of ultrasound," IEEE Trans. Ultrason.
Ferromagn. Freq. Control 33, 485-499 (1986).
16G. Bouchard and D. B. Bogy, "Experimental measurement of scattered
surface waves using a laser-Doppler technique," J. Acoust. Soc. Am. 77, 1003-1009 (1985)
17 J.-D. Aussel and J.-P. Monchalin, "Measurement of ultrasound attenuation
by laser ultrasonics," J. Appl. Phys. 65, 2918-2922 (1989).
•8j. H. Cantrell, Jr., and M. A. Breazeale, "Ultrasonic investigation of the
nonlinearity of fused silica for different hydroxyl-ion contents and homo- geneities between 300 and 3 øK," Phys. Rev. B 17, 4864-4870 (1978).
19A. Moreau and J.-D. Dai (unpublished).