fondation pour les études et recherches sur le développement international
LA FERDI EST UNE FOND
ATION REC ONNUE D ’UTILITÉ PUBLIQUE . ELLE ME T EN ŒUVRE A VEC L ’IDDRI L ’INITIA TIVE POUR LE DÉ VEL OPPEMENT E
T LA GOUVERNANCE MONDIALE (IDGM).
ELLE C
OORDONNE LE LABEX IDGM+ QUI L
’ASSOCIE A U CERDI E T À L ’IDDRI. CE TTE PUBLIC ATION A BÉNÉFICIÉ D ’UNE AIDE DE L ’É TA T FR ANC AIS GÉRÉE P AR L ’ANR A U TITRE DU PR OGR A MME «INVESTISSEMENT S D ’A VENIR» POR
TANT LA RÉFÉRENCE «ANR-10-LABX
-14-01».
Structural Reforms and Firms’
Productivity: Evidence from
Developing Countries
Wilfried A. Kouamé | Sampawende J.-A. Tapsoba
Wilfried A. Kouamé, World Bank and Economics Department, Université de Sherbrooke, Canada (Corresponding author)
|
[email protected]; wilfried. [email protected]Sampawende J.-A. Tapsoba, International Monetary Fund and Fondation pour les Études et Recherches sur le Développement International (FERDI)
|
[email protected]Abstract
This paper assesses the effects of structural reforms on firm-level productivity for 37
developing countries from 2006 to 2014 period. It takes advantage of the IMF Monitoring
of Fund Arrangements dataset for reform indexes and the World Bank Enterprise Surveys for
firm-level productivity. The paper highlights the following results. Structural reforms such as
financial, fiscal, real sector, and trade reforms, significantly improve firm-level productivity.
Interestingly, real sector reforms have the most sizeable effects on firm-level productivity. The
relationship between structural reforms and firm-level productivity is nonlinear and shaped
by some firms’ characteristics such as the financial access, the distortionary environment,
and the size of firms. The pace of structural reforms matters since being a “strong reformer”
is associated with a clear productivity dividend for firms. Finally, except for financial and
trade reforms, all structural reforms under consideration are bilaterally complementary in
improving firm-level productivity. These findings are robust to several sensitivity checks
including alternatives methodology and measure of productivity, and a counterfactual
experiment based on unsuccessful reforms.
Keywords: Structural Reforms, Firm-level productivity, Developing countries. JEL codes: D22, O16, O23, O24
Aknowledgment
Authors are grateful to Axel Schimmelpfennig, Chris Papageorgiou, Cesar Calderon, Punam Chulan-Pole, Doerte Doemeland, Alper Emre, Barhoumi, Karim, John Bluedorn, Jorge Alvarez, Paulo Lopez, Frederico Lima, Moussa Blimpo, Maty Konté, Neree Noumon, Erik van der Marel and colleagues for their comments. The paper was presented at the 2017 International Economic Association World Congress and at the 2017 EADI-NORDIC Conference.
Dev
elopment Po
lic
ie
s
Wo
rkin
216
g Paper
March 20181. Introduction
Most papers document that structural reforms have positive effects on firm-level productivity. In this stream of work, there is a consensus in the literature that structural reforms are important to boost and sustain long-term growth. Reforms matter for macroeconomic performances (Bordon et al., 2016; Christiansen et al., 2013; Bouis et al., 2012; Bourlès et al., 2010) and promote growth (Prati et al., 2013) by increasing aggregate firm-level productivity (Nicoletti and Scarpetta, 2003) and raising employment (Bordon et al., 2016).
Little is known about how structural reforms affect industries or firms in developing countries. The
literature on the economic effects of structural reforms has focused so far on developed countries.1
In the developing world, the role of structural reforms to buttress firm-level productivity is crucial. Constraints to the business environment are huge (Almeida and Carneiro, 2009; Aterido et al., 2011); the business environment is characterized by macroeconomic instability with negative effects on taxation and private investment (Krugman, 1988); labor market and entry regulations are heavy (Dabla-Norris et al., 2016; Klapper et al., 2006); and financial and market distortions are severe (Ayyagari et al., 2016; Bah and Fang, 2015; Giannetti and Ongena, 2009).
In this study, four key structural reforms are examined as firm-level productivity enhancing in developing countries. First, fiscal reforms are key to improving firm-level productivity through changes in labor supply and investment in physical and human capital. For instance, labor tax reforms aimed at addressing youth unemployment improve firm-level productivity (Banerji et al., 2015). Reforming public investment in human capital (education and health) accelerates the technological catch-up and enhances the skills of domestic workers and firms’ labor productivity (Pritchett, 2013; Baldacci et al., 2008). Likewise, basic structural reforms such as expenditure rationalization, revenue base broadening, or taxing “excess returns” and rents could minimize distortions and reduce cumbersome burdens and improve firm-level productivity (IMF, 2015, Cottarelli and Keen, 2012). Second, several papers find that financial sector reforms have positive effects on firm-level productivity through more efficient allocation of resources (Galindo et al., 2005) and easier access to external financing (Rajan and Zingales, 1998). Financial sector reforms aiming at removing financial restrictions and financial repression have the potential to lower the cost of capital and boost firm-level productivity and growth at the firm level. They align the allocation of financial resources to more productive firms and, therefore, contribute to boosting firm-level productivity (Larrain and Stumpner, 2015). Third, several authors also document that real sector reforms enhance firm-level productivity. Various studies using rich micro-level datasets find
1 In this paper, we adopt the common definition in the literature (Spilimbergo et al., 2009). Reforms refer to government policies aiming to address market failures, reduce or remove impediments to the efficient allocation of resources, government intervention (including removal of state-imposed price controls and the abolition of state monopolies), and restriction on trade, domestic and financial transactions.
robust evidence that structural reforms that promote competition in product markets could help boost firm-level productivity (Nicoletti and Scarpetta, 2003; Faini et al., 2006; Buccirossi et al., 2009; Bourlès et al., 2010). Excessive labor market regulation and collective bargaining in developing countries are sources of inefficiency that reduce firms’ output and employment (World Bank, 2013). Looser regulations could also encourage competition and firms to experiment with new ideas and technologies and facilitate the shift of resources from slow to fast-growing sectors (Daude, 2016). Fourth, trade reforms were found to be firm-level productivity enhancing at the aggregate level (Trefler, 2004; Melitz, 2003). For developed countries, Topalova and Khandelwal (2011) find that trade reforms increase firm-level productivity, with input tariff reforms having a larger impact. Melitz (2003) and Melitz and Ottaviano (2008) find, for example, that trade reforms increase competition which results in a reallocation of resources from less productive to more productive firms. In summary, there is ample evidence that the key structural reforms of interest in this paper are positively associated with increases in firm-level productivity, especially in developed countries. The paper examines whether structural reforms are followed by significant changes in firm-level productivity on a sample of 37 developing countries over the 2006-14 period. The paper combines newly constructed structural reforms index from the IMF Monitoring of Fund Arrangements (MONA) database with firm-level data from the World Bank Enterprise Surveys (WBES). To account for the fact that firms in the same country deal with similar contextual characteristics, the paper uses a multilevel modeling approach to assess the impact of structural reforms on firm-level productivity. By capturing both the between-country and within-country effects, the multilevel model accounts for the fact that firms are nested within the country and allows the inclusion of both firm-level and macroeconomic variables.
The paper also explores conditional factors of the impact of structural reforms on firm-level productivity and whether structural reforms are substitutes or complementary in affecting productivity at the firm level.
Key findings are as follows. In developing countries, structural reforms significantly improve firm-level productivity. We also find that the pace of structural reforms matters since being a “strong reformer” is associated with a clear firm-level productivity dividend for firms. Interestingly, real sector reforms have the most sizeable effects on firm-level productivity. We also find that financially-included firms benefit less from financial reforms. Financial access also strengthens the relationship between fiscal reforms and firm-level productivity. The effects of fiscal and trade reforms on firm-level productivity are hindered by distortions. Evidences also suggest that small firms benefit more from financial reforms relative to the larger ones. Structural reforms considered in this study are bilaterally complementary in improving firm-level productivity (except for financial and trade reforms). The findings are robust to several sensitivity analyses including alternative measures of firm-level productivity, alternative estimation methodology, and accounting for possible omitted variables. The robustness checks are presented in Appendix B.
MONA database to construct new reform indexes. Relative to the existing literature, by focusing on successful performance criterion (met or met with minor delay), our reform indexes present the advantages of accounting for reforms implemented only. Moreover, we are able to identify the effects of specific structural reforms (financial, fiscal, real sector, and trade reforms) while the
existing literature mostly uses liberalization index as a measure of structural reforms.2 Second, to
the best of our knowledge, this is the first paper to assess the impact of structural reforms on
firm-level productivity in developing countries.3
The rest of the paper is structured as follows. Section II describes the datasets. Descriptive statistics and the empirical strategy are discussed in Section III. Section IV reports and discusses estimation results. Section V concludes.
2. Datasets
The data are compiled from four different sources. Structural reform indexes are computed from the IMF Monitoring of Fund Arrangements (MONA) database, firms’ characteristics are culled from the World Bank Enterprises Surveys (WBES) and the other macroeconomic variables are collected from the World Bank World Development Indicators (WDI) and World Governance Indicators (WGI).
2.1. The IMF Monitoring of Fund Arrangements (MONA) database
As argued in the literature, structural reforms are more difficult to measure than classical macroeconomic policies limiting the scope for quantitative analysis of their effects. Structural reforms are typically policies geared towards raising firm-level productivity by improving the efficiency of markets and institutions and by reducing (or removing) impediments to the efficient allocation of resources. Hence, structural reforms have typically been associated with regulatory policies that strengthen market-based incentives in the domestic product and service markets, labor markets, trade, and capital and financial markets. However, structural reforms may also involve actions to address market failures or other government policies that could affect firm-level productivity more directly.
The paper uses the IMF Monitoring of Fund Arrangements (MONA) database, which covers all aspects of conditionalities in the program. The MONA database provides a cumulative history of Fund-supported programs from Executive Board approval through its completion. The Monitoring of Fund Arrangements (MONA) database contains comparable information on the economic
2 See, Arnold et al. (2015); Prati et al. (2013); Abiad and Mody (2005); Abiad, Detragiache and Tressel (2008).
3 Tressel (2008) investigates the effects of, financial and trade sector reforms on real output growth at the industrial level in 91 countries including developed countries. However, Tressel (2008) focuses on financial and trade liberalization and does not examine the effects of these reforms on firm-level productivity. The few studies examining the impact of reforms on firms’ productivity in developing countries mainly focus on a specific reform in China, Colombia, India, and Indonesia
objectives and outcomes in Fund-supported arrangements. It tracks the performance of countries in terms of scheduled purchases and reviews, quantitative and structural conditionality, and macroeconomic indicators. Data are available for most arrangements as early as 2002 and are collected at the time of arrangement approval and following each review. The dataset covers 94 countries with an IMF arrangement program since 2002.
Most IMF programs are characterized by disbursements linked to the Board’s approval. Program reviews provide a framework to assess periodically whether programs are on track and whether modifications are necessary to achieve the objectives set. Reviews combine backward-looking assessment (were the program conditions met per the agreed timetable?) with a forward-looking perspective (does the program need to be modified considering new developments?).
Program approval or reviews are based on various policy commitments agreed with the country authorities. Conditionalities could take different forms, including prior actions (PA), quantitative performance criteria (QPC), indicative targets (IT) or structural benchmarks (SB). PAs are measures that a country agrees to take before the IMF Executive Board approves financing or completes a review. They ensure that the program has the necessary foundation to succeed or is put back on track in the event of deviations from agreed policies. QPCs are specific and measurable conditions that must be met to complete a review. QPCs always relate to macroeconomic variables under the control of the authorities, such as monetary and credit aggregates, international reserves, fiscal balances, and external borrowing. ITs may be established in addition to QPCs as quantitative indicators to assess the member’s progress in meeting the objectives of a program. Sometimes they are also set when QPCs could not be because of data uncertainty about economic trends (for the latter months of a program). As uncertainty is reduced, these targets are normally turned into QPCs, with appropriate modifications. SBs are (often) non-quantifiable reform measures that are critical to achieving program goals and are intended as markers to assess program implementation during a review. They vary across programs: examples are measures to improve financial sector
operations, build up social safety nets, or strengthen public financial management.4 We focus on
SBs for the design of structural reforms. We assume that SBs met under IMF-supported programs in developing countries could be identified as major and critical structural reforms.
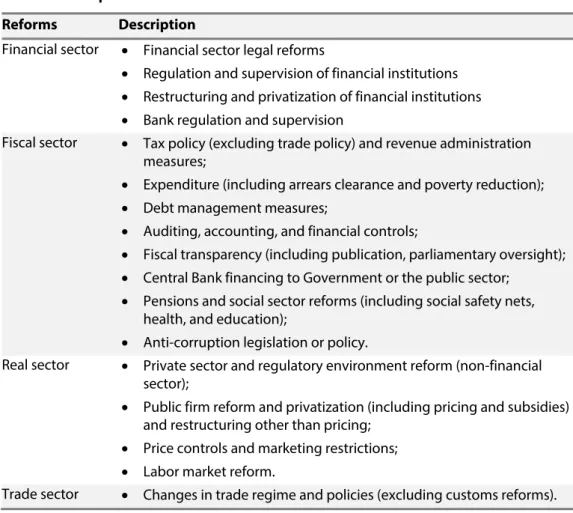
Using economic classification, we group the different SBs in four categories reported in Table 1. Fiscal sector reforms include both fiscal and public sector structural reforms. Financial sector reforms include structural reforms in the banking and financial sectors aiming at ensuring the supervision of financial institutions and lessen regulation. Real sector reforms cover investment climate, price controls, and labor market reforms. Finally, Trade reforms account for international trade policy reforms.
4 Structural benchmarks and indicative targets do not require waivers if they are not met but are assessed in the context of overall program performance.
Table 1. Description of structural reforms indices
Reforms Description
Financial sector Financial sector legal reforms
Regulation and supervision of financial institutions Restructuring and privatization of financial institutions Bank regulation and supervision
Fiscal sector Tax policy (excluding trade policy) and revenue administration measures;
Expenditure (including arrears clearance and poverty reduction); Debt management measures;
Auditing, accounting, and financial controls;
Fiscal transparency (including publication, parliamentary oversight); Central Bank financing to Government or the public sector;
Pensions and social sector reforms (including social safety nets, health, and education);
Anti-corruption legislation or policy.
Real sector Private sector and regulatory environment reform (non-financial sector);
Public firm reform and privatization (including pricing and subsidies) and restructuring other than pricing;
Price controls and marketing restrictions; Labor market reform.
Trade sector Changes in trade regime and policies (excluding customs reforms). Source: Authors’ classification based on MONA database.
2.2. The World Bank Enterprise Surveys (WBES) database
We use the WBES database to compute firm-level productivity. The WBES database is a collection of firm-level surveys in developing countries based on a representative sample (random stratified sampling) mainly from the private sector. The surveys cover a broad range of business environment topics including access to finance, corruption, infrastructure, crime, competition, and performance measures in most countries of the world. The surveys follow common guidelines in design and implementation, thereby allowing cross-country analyses. We use the standardized dataset over the period 2006 to 2014, which has a pseudo-panel structure. While, the dataset contains information on 117 358 firms in 136 countries, this paper focuses on developing countries under an IMF program and having at least one round of the WBES. In addition, our identification strategy requires matching firm-level data with reform programs within the 3 previous years. The median sample size is 360 firms, with only three having samples over 1,000 observations (Bangladesh, Pakistan, and Ukraine). The WBES contains information on firms’ performance such as employment, investment, and sales. The existence of retrospective information on employment and sales allow capturing labor productivity growth over the period of reforms. All firms in the sample are producing in the formal sector i.e., registered with local or national authorities.
the service sector. The Table A7 in appendix C reports a complete list of countries with the number of firms in each country.
In the analysis, we include some firms’ characteristics such as the size, the age, the ownership, financial access, distortions faced, the connection to foreign markets, the demand in the country, and the initial performance of the firm. The size of the firm is measured by four categorical variables based on the number of permanent employees: micro-firms (1 to 10), small (11 to 50), medium (51 to 200), and large (more than 200). Large is the reference category. The age of the firm is captured by three categorical variables: young (1-5 years old), mature (6-15 years old), and older (more than 15 years old). Older is the reference category. The ownership is measured as the percentage of the capital owned by the government, local private sector, and foreign individuals, companies, or organizations. The financial access is measured as a dummy variable that takes 1 if the firm has a credit line or an overdraft facility and 0 otherwise. Distortions in the business environment are measured as the costs related to power outages, insecurity, and corruption. The level of distortions is captured by a dummy variable taking 1 for firms in the fourth quintile of the distribution of distortions. The connection to foreign markets is captured by a dummy variable taking 1 if the share of sales exported is positive and 0 otherwise. Demand conditions within the country are captured by a dummy variable taking 1 if the firm is in a city with a population over one million and 0 otherwise. The initial conditions are captured with the use the 3-year-lagged natural logarithm of the real total sales. All the nominal values are adjusted are adjusted for inflation. Table 2 in the next section reports the descriptive statistics.
2.3. Other macroeconomic data
We include three main macroeconomic variables that could affect both structural reforms and firm-level productivity: the average GDP growth, the inflation rate, and the quality of the regulatory environment. The average GDP growth intends to control for the change in firm-level productivity due to changes in the economic environment. The inflation rate, measured by the consumer price index, is included to capture macroeconomic stability. The quality of the regulatory environment captures the institutional environment in which firms operate. Also, this variable helps to control for the fact that the average institutional quality may affect the initial reform targets, reforms implementation as well as the productivity. It intends to control for the ability of the government to formulate and implement sound pro-private sector policies. The average GDP growth and inflation level data are from the WDI database while the average quality of the regulatory
environment is from the WGI.5 The macroeconomic variables as well as the country fixed effects
help control for the country’s business cycle and country-level trends in firm-level productivity, the
5 The World Governance Indicators proxy the quality of governance at the macroeconomic level over six dimensions including the quality of the regulatory framework. The indicators rely on perception-based governance data from a set of 31 sources, including survey of firms, households, non-governmental organizations, and multilateral organizations, and other public sector bodies. Kaufmann, Kraay and Mastrizzi (2011) for more detailed information on the methodology.
institutional capacity, and the ambitiousness of the authorities, the political situation and several other factors as the availability of development partners in providing technical assistance. The macroeconomic variables help to minimize endogeneity concerns. We will elaborate further in the section below.
3. Empirical strategy
The empirical section first describes the calculation of the firm-level productivity and reform indexes. The subsection discusses the modeling strategy to assess the effects of structural reforms on firm-level productivity.
3.1. Calculation of firm-level productivity
The literature has proposed several measures of firm-level productivity. The common ones are the labor productivity growth (LPG) and the total factor productivity (TFP).
In this paper, we focus primarily on LPG for two main reasons. First, LPG measured as sales per worker has the advantage of being dynamic and is computed over the period covered by structural reforms. An advantage allowing us to better capture the change in productivity due to improvements or setbacks in structural reforms. Second, although the TFP accounts for the capital and the production technology, the version computed from the WBES does not allow capturing changes in TFP that could be attributed to structural reforms. Indeed, the WBES collects information only on the current stock of capital. The information on the past stock of capital required to calculate the change in TFP are not reported. Recall that the standardized WBES dataset
used in this study has a pseudo panel structure.6 The sensitivity analysis explore the robustness of
the findings using TFP and value-added per worker as alternative measures of productivity.
LPG is computed as the average annual growth of labor productivity (LP) over the last three years. In the surveys, firms are asked to report their total annual sales and full-time employees at the end of the previous fiscal year ( −1) and three years ago ( −3), respectively. At each period, LP is computed as the ratio of total annual sales over total permanent full-time employees. Following Davis and Haltiwanger (1999) and World Bank (2016), we compute LPG by dividing the change in
productivity between −1 and −3 – by the average value of initial and final labor
productivity . This approach helps to reduce the influence of outliers. Further, since
there were two full years between the two points in time, we calculate the annual average LPG as follows:
6 The lack of panel data on firms limits the possibility to use robust measures of productivity such as the TFP from Levinsohn-Petrin (Levinsohn and Petrin, 2003).
∗ – (1) is ranged between -1 and 1 and refers to the information on labor productivity growth
available at the time t.
3.2. Calculation of structural reform indexes
We construct structural reform indexes based on the IMF MONA database. We use the information available on macroeconomic SBs affecting the fiscal sector, the financial sector, the real sector, and
the trade sector.7 For each measure, we focus on measures for which targets have been met or met
with minor delays.
Based on Nardo et al. (2005) and OECD (2008), we use the centered-reduced normalization, or Z-score approach which consists of transforming a given variable X characterized by its mean μ and
standard deviation σ, into an index or Z score expressed as follows: . If X is normally
distributed, then Z follows a centered-reduced normal distribution, with a zero mean and a standard deviation of one. With this standardization, all structural reform variables are expressed in the same unit, namely the standard deviation, and can, therefore, be meaningfully compared in
terms of effects.8
For each class of structural reform described above and for each period, we compute a normalized reform index by country as follows:
(2)
is the total number of successful structural reforms (met or met with minor delay) in the
country c during the last review by the IMF board at year t. N and are, respectively, the
average number and the standard deviation of the number of successful structural reforms for all countries at a given year. The index takes the value 0 if the number of structural reforms corresponds to the average number of successful structural reforms. All the indexes of reforms are computed using the entire sample of countries in the MONA dataset.
We also build an aggregate index of structural reforms by averaging indexes of different structural reforms (fiscal, financial, real sector, and trade reforms). The aggregate index of structural reforms is computed using equal weights for each reform and ranges between -1.6 and 3.5 with high values
7 Structural macro-structural benchmarks are reform measures that are important to achieve program goals and are intended to assess program implementation during a review.
8 One matter of concern related to this approach is the sensitivity of the transformed Z variable to the presence of outliers. In the robustness section, we address this issue by using the min-max approach.
X
Z
corresponding to a higher intensity of successful structural reforms on average. Compared to the existing literature, our reform index focuses on structural reforms “truly” implemented as we select structural reforms based on performance criteria in IMF programs that have been met or met with delay. In addition, we are also able to cover the fiscal and real sector reforms while the existing
literature mostly focuses on trade and financial liberalization.9 The indexes of reforms for each
country of the sample are reported in Table A6 of the appendix C.
3.3. The consolidated sample
The MONA dataset is matched with firm-level data from the WBES considering only successful structural reforms within the 3 previous years. For example, for firm-level data available in 2010, we match successful structural reforms in 2007, 2008, and 2009. The matching strategy minimizes potential endogeneity issues between productivity and reforms by matching structural reform indexes. Matching structural reform data from MONA dataset and firm-level data from the WBES
dataset, we obtain a pair of reform indexes and firm characteristics for 3710 Low and Low-middle
income countries from six different regions (sub-Saharan Africa, East Asia and the Pacific, Europe and Central Asia, Latin America and the Caribbean, the Middle East and North Africa, and South
Asia) from 2006 to 2014.11 The final sample contains 10 822 firms.
Table 2 provides descriptive statistics. On average, micro and small firms dominate the sample, almost 77.5 percent of the total sample. Most firms in the sample are mature (between 5 and 15 years old) or old (more than 15 years old) with a proportion of 84 percent. 18.4 percent of firms exports their prodcution, and only 11.7 percent of firms have access to finance (e.g. a credit line or an overdraft facility). The average GDP growth is 4.5 percent and the average inflation is 7.1 percent.
A visual perusal of the data indicates that, in the sample, structural reforms comprise mostly fiscal and financial reforms (Figure 1). This is in line with the source for structural reforms (the IMF MONA database). IMF programs are mostly dominated by fiscal and financial measures. The real and the trade sectors are often added under the section of business climate improvement. Reforms spiked in 2009 with the significant increase in IMF programs after the fallout of the global financial crisis. As it can be seen in Figure 2, there is a positive correlation between LPG and structural reforms.
9 See Arnold et al. (2015) Prati et al. (2013); Abiad and Mody (2005); Abiad, Detragiache and Tressel (2008).
10 Seven countries in the sample experimented two IMF programs over the period and at least two rounds of the enterprise surveys over the period. We keep all the observations in those countries as they fit our matching strategy. Tables A6 and A7 in Appendix C report the list of countries and related descriptive statistics.
11 The list of countries in the sample is as follows: Afghanistan, Armenia, Bangladesh, Bolivia, Bosnia and Herzegovina, Burkina Faso, Burundi, Central African Republic, Congo, Democratic Republic of Congo, Djibouti, Dominican Republic, El Salvador, Ethiopia, Ghana, Guatemala, Honduras, Kosovo, Kyrgyz Republic, Madagascar, Malawi, Mali, Mauritania, Moldova, Mongolia, Nepal, Nicaragua, Niger, Pakistan, Rwanda, Senegal, Tajikistan, Tanzania, Uganda, Ukraine, Yemen, and Zambia.
Table 2. Summary statistics
Variables Mean Std. Dev. Min. Max.
Firms’ size
Share of microenterprises 37.55 0.48 0 100
Share of small firms 39.88 0.49 0 100
Share of medium firms 15.41 0.36 0 100
Share of large firms 7.16 0.25 0 100
Firms’ age
Share of young firms 15.54 0.36 0 100
Share of mature firms 45.13 0.5 0 100
Share of old firms 39.32 0.49 0 100
Connection to foreign market
Proportion of firms exporting 18.41 0.39 0 100
Financial access
Proportion of firms having a credit line
or an overdraft facility 11.65 22.98 0 100
Ownership
Average foreign share 8.66 26.26 0 100
Average government/states share 0.51 5.39 0 100
Macroeconomic variables
GDP growth 4.54 2.77 -1.9 12.42
Inflation 7.13 6.12 -0.28 33.22
Quality of regulation -0.46 0.41 -1.51 0.37
Note. Outside of the quality of regulation, all variables are in percent. The summary statistics are at the firm level
Figure 1: Composition of successful reforms over time, all sample
Figure 2: Average labor productivity growth and successful reforms, over 2006-14
Source: Authors’ calculations based on the IMF MONA and the WBES
3.4. The multilevel mixed model
Estimating the effects of structural reforms on firm-level productivity is challenging because of the structure of the data. Firms in the same country may not be independent. Within countries, firms share similar contextual characteristics such as the institutional environment, the macroeconomic framework, and policies affecting their productivity. Standard econometric methods ignore such clustering effects, which may generate downward-biased standard errors.
To account for such bias, we rely on the multilevel mixed model. The multilevel mixed model accounts for such clustering effects by allowing the intercept to vary across countries capturing the
heterogeneity that exists at the country level.12 Country-level variables and country fixed-effects
can be included simultaneously in the multilevel model. This last point is particularly important for the present paper which examines the impacts of structural reforms on firm-level productivity. Another challenge is the potential endogeneity issues between structural reforms and firm-level productivity, which may originate from omitted variable bias. To minimize the latter, we include in all estimates a set of country, sector, and year fixed effects. In addition to controlling for the omitted variables, these fixed effects control for differences in demand conditions and survey waves, and time-invariant omitted variables. The matching strategy between structural reforms
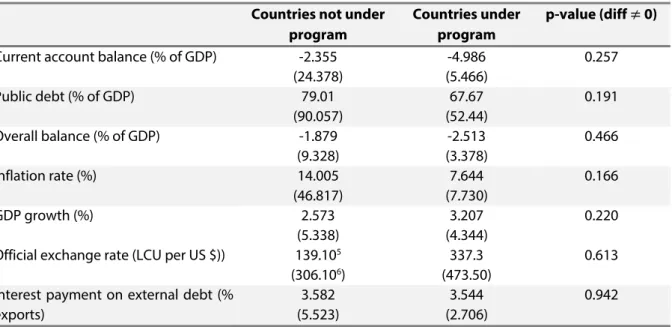
and firm-level productivity limits potential reverse causality issues between structural reforms and firm-level productivity. Indeed, we ensured that the approval year of each IMF program corresponds exactly or is after the reference year of labor productivity growth. This means that the possibility of the level of firm-level productivity determining the implementation of structural reforms can be ignored. Finally, we ensured that the estimated effects of structural reforms are not driven by differences in macroeconomic variables before the adoption of structural reforms by presenting a sample balance table. Table 6 in appendix A compares low and lower-middle income countries under IMF program and those without an IMF program over the period. The analysis focuses on key macroeconomic variables that are the level of debt, the current account and overall balances, the GDP growth, the level of inflation, the exchange rate, and interest payment on the external debt (percent of total exports).
As it can be seen, countries under IMF program and those without are not statistically different. The evidences suggest that the challenge of identify the impacts of structural reforms due to the difference in the pre-treatment macroeconomic conditions can ignored. The evidences in Table 6 minimize the possibility that the estimated effects will be attributed to economic recovery. The macroeconomic environment preceding the structural reforms is not statistically significant different from the sample of low and low-middle income without a IMF supporting program. As additional robustness check, we account explicitly for countries in crisis over the period of the analysis.
The estimated multilevel mixed model is based on a two-level model where the highest level is the country, and the lowest level is the firm:
1:
, , , ~ 0, (3)
is the labor productivity growth of the firm in the country at a year as described above.
, refers to indexes of the 3-year lagged successful structural reforms in the
country . refers to a set of firm individual characteristics that were described above. The vector
refers to a set of macroeconomic variables described as well in the previous section. Finally, refers to the firm-level error term. The coefficient is the parameter of interest that captures the impact of structural reforms on firm-level productivity. We expect a positive sign in line with the expectation that structural reforms raise firm-level productivity in developing countries.
2: , ~ 0, , (4)
Combining equation (3) and (4), the baseline model could be written as follows:
, , (5)
is the random part of the model with the country-specific error term. The multilevel
model has the advantage of capturing both between and within country effects of structural reforms. In addition, we include country, sector, and year fixed effects to control for some
potentially important omitted variables, differences in demand conditions13 and survey differences.
The standard errors are clustered at the country-level in all specifications.14
4. Estimation results
4.1. Baseline
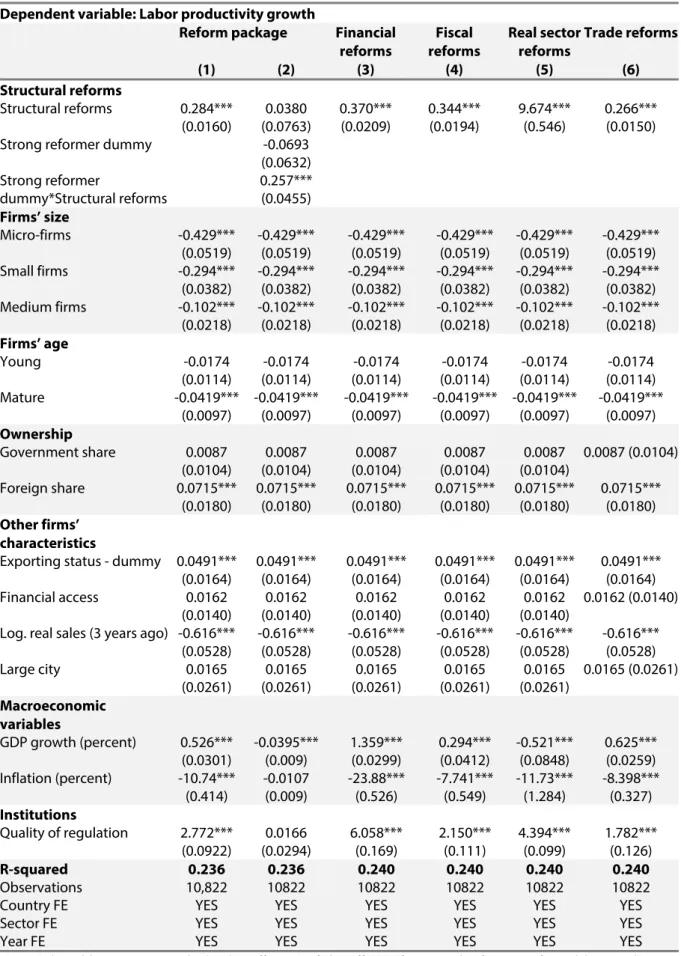
Baseline results are reported in Table 3 below. All estimates are standardized and can be compared across structural reforms. Column (1) has the estimates with the average reform index. We find that the structural reform variable has a positive impact on LPG. The associated coefficient is positive and statistically significant at the 1 percent level. A one standard deviation increase in the reform index is an improvement of 0.284 percentage point in firm-level LPG. There is strong evidence that structural reforms at the macroeconomic level are associated with firm-level productivity improvement at the firm level.
Most of the control variables are statistically significant. Exporting, and foreign-owned firms have a positive impact on LPG. Estimated coefficients are significant at 1 percent with a magnitude of the effects between 0.05 and 0.072 standard deviation increase for a 1 standard deviation increase in the index of structural reforms. Initial conditions matter and are significant, at least, at the 1 percent level. LPG is lower for firms having large sales at the beginning of the period. The magnitude of the effects is relatively higher at 0.62 standard deviation decrease in LPG for a 1 standard deviation differential in the real sales. Mature firms have a lower LPG. The coefficient is statistically significant at, respectively, the 1 and 5 percent levels. Likewise, micro, small, and medium-size firms have lower LPG relative to the large ones. Relative to the large firms, the gap in LPG is, respectively, 0.429 standard deviation for micro-firms, 0.294 standard deviation for small firms, and 0.102 standard deviation for medium firms. Large cities and government-owned firms are significant drivers of LPG.
The macroeconomic environment influences firm-level LPG. Higher GDP growth favors firm-level productivity growth. The estimated coefficient is significant at 1 percent. A 1 standard deviation improvement in growth at the macroeconomic level translates to 0.526 standard deviation increase in LPG. Conversely, higher inflation (often considered as an indicator of macroeconomic instability) has a negative impact on LPG. The estimated impact is significant at 1 percent. An increase of inflation by 1 standard deviation decreases LPG by 10.74 standard deviation. Further,
13 This accounts for the short-term economic recovery effects as some countries might begin the IMF programs in a near-crisis condition with a weak macroeconomic environment. From a sluggish economy, domestic demand may be restored as a result of the program. The year fixed effects help distinguish between the impacts of structural reforms from the effects of economic recovery. The findings are robust using different combination of country, sector, and year fixed effects.
good quality of institutions helps support LPG at the firm level. The coefficient associated with the quality of regulation is positive and significant at 1 percent. An increase of 1 standard deviation in
the quality of regulation indicator raises LPG by 2.77 standard deviation.15
4.2. “Strong reformer” vs. “Weak reformer”
As discussed in Figure 1, there is a significant country heterogeneity in structural reforms across countries. This suggests that the effect of structural reforms might vary according to the pace of structural reforms. We test whether the positive effect of structural reform on LPG evidenced above varies with the pace of structural reforms implemented. Distinguishing countries by the pace of structural reforms implemented might be tricky. To avoid a priori bias, we chose the median of the
reform index as a threshold.16 We generate a dummy variable taking the value 1 when the average
of the reform index for a country is above the median and 0 otherwise.17 We extend equation (5)
and introduce additively and multiplicatively (with , , ), the “strong reformer”
dummy variable.
, ,
∗ , , (6)
denotes labor productivity growth, , , the reform index,
∗ , , the interaction between the “strong reformer”
dummy variable ( ) and the reform variable. As in equation (5), we
control for firm-level characteristics, macroeconomic variables, and a set of country, sector and year fixed effects.
The result is shown in the second column of Table 3. It turns out that there is a clear dividend for being a “strong reformer.” We find that countries dubbed as “strong reformer” might drive baseline result. To begin with, firms in the “strong reformer” category do not appear to be more productive than the counterfactual group (dubbed as “weak reformer”). The coefficient of the strong reformer dummy is negative and statistically not significant. However, the gains from structural reforms in LPG between a firm in the “strong reformer” group and the one in the control group is about 0.257
15 Table A5 in appendix presents the evidence on the sub-group of Low Income Countries. All the macro-structural reforms under consideration increase LPG.
16 Although, the indexes of reforms capture the intensity of reforms for each country, it is limited in distinguishing between the quality and the quantity of reforms. One can imagine that high quality reforms might be more ambitious and thereby less successful relative to less-ambitious reforms. We are unable to explore those aspects, as the MONA dataset does not allow us to categorize the reforms by level of ambition or quality. The indexes of reforms as well as the findings in this paper are interpreted as the impact of the intensity of successful reforms on firms’ productivity.
17 According to this classification the list of strong reformer countries over the period is as follows: Armenia, Bangladesh, Bolivia, Burkina Faso, Burundi, Central African Republic, Congo, Democratic Republic of Congo, Djibouti, Dominican Republic, Ghana, Honduras, Moldova, Nicaragua, Niger, Rwanda, Tanzania, Zambia.
percentage point. This corresponds to the coefficient associated with the interactive term between structural reforms and the dummy variable indicating “strong” reformer countries. The findings indicate that the structural reform has a positive effect on LPG in countries dubbed as “strong reformer”, which are those in the top of the distribution of the reform index. The net effect of structural reform is very close to the estimate in the baseline.
Among countries under IMF program, we could expect countries with good pre-structural reforms to perform better than those with a pre-structural reforms weak macroeconomic environment. On the opposite, we could expect countries in pre-crisis or crisis context (weak macroeconomic environment) to perform better in term of labor productivity than the others due to the economic recovery. In each case, the effects of structural reforms for top and weak reformers may be misleading. We ensure the difference in the estimated effects of structural reforms between strong and weak reformer countries is not driven by pre-treatment differences in key the macroeconomic
conditions. Table 718 presented in appendix A shows that “strong reformer” countries are not
statistically different from the “weak reformers” on the pre-treatment basis.
4.3. Specific structural reforms
Furthermore, we analyze the effect of specific structural reforms. The effects of structural reforms on LPG might vary according to their nature. To shed lights on this assumption, we split the reform index into its subcomponents: financial sector reform, fiscal sector reform, real sector reform, and trade sector reform, respectively. We then re-estimate equation (5) for each specific reform. Results are presented in Table 3, columns (3) to (6). We find that all structural reforms at the macroeconomic level considered have positive impacts on the LPG at the firm’s level. The estimated coefficients are all positive and statistically positive at the 1 percent level.
Interestingly, the real sector reform turns out to be the reform with the most sizeable impact on firms’ LPG. Indeed, the effect of real sector stands out in magnitude relative to the baseline result. The associated coefficient is positive and estimated at 9.7, implying that a one standard deviation increase in the real sector reform index leads to an improvement of 9.7 percentage points in LPG at the firm level, which is more than 34 times higher than the baseline estimate. Next, we find that the impact of financial and Fiscal reforms (dominant in the sample given the fact that structural reforms are extracted from IMF programs’ measures) are close in magnitudes at around 0.35, slightly above that of the average index. A one standard deviation increase in these reform indexes is associated with an improvement of 0.37 and 0.34 percentage point in LPG at the firm level. Finally, the impact of trade structural reforms is close to the one estimated with the average index.
18 The sample balance analysis in Table 7 in Appendix A focuses on the same macroeconomic variables as previously i.e. the level of debt, the current account and overall balance, the inflation and exchange rate, the interest rate on the external debt over GDP, and the GDP growth.
Table 3. Impact of the structural reforms on labor productivity growth
Dependent variable: Labor productivity growth
Reform package Financial
reforms Fiscal reforms Real sector reforms Trade reforms (1) (2) (3) (4) (5) (6) Structural reforms Structural reforms 0.284*** (0.0160) 0.0380 (0.0763) 0.370*** (0.0209) 0.344*** (0.0194) 9.674*** (0.546) 0.266*** (0.0150)
Strong reformer dummy -0.0693
(0.0632) Strong reformer dummy*Structural reforms 0.257*** (0.0455) Firms’ size Micro-firms -0.429*** (0.0519) -0.429*** (0.0519) -0.429*** (0.0519) -0.429*** (0.0519) -0.429*** (0.0519) -0.429*** (0.0519) Small firms -0.294*** (0.0382) -0.294*** (0.0382) -0.294*** (0.0382) -0.294*** (0.0382) -0.294*** (0.0382) -0.294*** (0.0382) Medium firms -0.102*** (0.0218) -0.102*** (0.0218) -0.102*** (0.0218) -0.102*** (0.0218) -0.102*** (0.0218) -0.102*** (0.0218) Firms’ age Young -0.0174 (0.0114) -0.0174 (0.0114) -0.0174 (0.0114) -0.0174 (0.0114) -0.0174 (0.0114) -0.0174 (0.0114) Mature -0.0419*** (0.0097) -0.0419*** (0.0097) -0.0419*** (0.0097) -0.0419*** (0.0097) -0.0419*** (0.0097) -0.0419*** (0.0097) Ownership Government share 0.0087 (0.0104) 0.0087 (0.0104) 0.0087 (0.0104) 0.0087 (0.0104) 0.0087 (0.0104) 0.0087 (0.0104) Foreign share 0.0715*** (0.0180) 0.0715*** (0.0180) 0.0715*** (0.0180) 0.0715*** (0.0180) 0.0715*** (0.0180) 0.0715*** (0.0180) Other firms’ characteristics
Exporting status - dummy 0.0491*** (0.0164) 0.0491*** (0.0164) 0.0491*** (0.0164) 0.0491*** (0.0164) 0.0491*** (0.0164) 0.0491*** (0.0164) Financial access 0.0162 (0.0140) 0.0162 (0.0140) 0.0162 (0.0140) 0.0162 (0.0140) 0.0162 (0.0140) 0.0162 (0.0140)
Log. real sales (3 years ago) -0.616*** (0.0528) -0.616*** (0.0528) -0.616*** (0.0528) -0.616*** (0.0528) -0.616*** (0.0528) -0.616*** (0.0528) Large city 0.0165 (0.0261) 0.0165 (0.0261) 0.0165 (0.0261) 0.0165 (0.0261) 0.0165 (0.0261) 0.0165 (0.0261) Macroeconomic variables GDP growth (percent) 0.526*** (0.0301) -0.0395*** (0.009) 1.359*** (0.0299) 0.294*** (0.0412) -0.521*** (0.0848) 0.625*** (0.0259) Inflation (percent) -10.74*** (0.414) -0.0107 (0.009) -23.88*** (0.526) -7.741*** (0.549) -11.73*** (1.284) -8.398*** (0.327) Institutions Quality of regulation 2.772*** (0.0922) 0.0166 (0.0294) 6.058*** (0.169) 2.150*** (0.111) 4.394*** (0.099) 1.782*** (0.126) R-squared 0.236 0.236 0.240 0.240 0.240 0.240 Observations 10,822 10822 10822 10822 10822 10822 Country FE Sector FE Year FE YES YES YES YES YES YES YES YES YES YES YES YES YES YES YES YES YES YES Notes. The table presents standardized coefficients of the effects of structural reforms on firms’ labor productivity growth using a multilevel mixed effects model. All estimates use the weights and are standardized so that can be compared across structural reforms. Robust standard errors clustered at the country level in parentheses. ***, **, * denote significance at the 1, 5, and 10 percent level.
4.4. Conditional factors
We further refine the estimates of the effect of structural reforms on LPG. We focus on firms’ characteristics that shape that effect. Indeed, even though the same country’s firms face similar macroeconomic and policy environments, they have different individual characteristics, which could amend the impact of structural reforms on firms’ LPG.
We follow the literature on the business environment and firm-level productivity (Bah and Fang, 2015; Aterido et al., 2011; Aghion et al., 2010; Berman and Héricourt, 2010; Rajan and Zingales, 1998) and center on four potential conditional factors: access to international markets, financial access, distortion in the business environment, and the size of firms. First, access to the foreign market is one of the channels through which trade reforms could affect firm-level productivity. Trade sector structural reforms could affect all firms; the exporting ones are the most exposed to changes in trade regimes such as liberalization, reduction of tariffs, and time necessary to comply with all export procedures. We expect, therefore, that exporting firms benefit more from trade reforms relative to the non-exporting ones. Second financial access is one of the main channels through which financial reforms impact firm-level productivity. As argued by Rajan and Zingales (1998) and Beck et al. (2005), access to finance is crucial for firms’ development and growth. It remains one of the big obstacles weighing down on firms in developing countries. Given that financial reforms are aimed at improving the efficiency of the banking system and reducing financial repression, we expect firms, which are already financially included, to benefit less from financial reforms. Third, as highlighted by Bah and Fang (2015), firms in developing countries face idiosyncratic distortions affecting their firm-level productivity and economic performance. Distortions can take different forms such as bribery, nuisance or discriminatory taxes/subsidies, tax exemption, bias against exporters, the cost of insecurity, barrier to entry, complex tax system and the costs of power outages. In such environment, firms can be stifled and limited in their development potentials. Fourth, firms’ size is one of the channels through which structural reforms, in general, affect firm-level productivity. As pointed out in the literature, small businesses in developing countries are negatively affected by a heavy regulatory framework (Aterido et al., 2011), and strict labor market regulation negatively affects firm size (Chauney, 2015; Almeida and Carneiro, 2009). Hence, by lightening the regulatory framework and price controls, real sector reforms could increase firm-level productivity in developing countries, especially for smaller firms. To capture these potential heterogeneous effects, we extend equation (5) and introduce additively
and multiplicatively (with , , ) a conditional factor variable ( ) which captures
firms’ individual characteristics that could potentially affect the effect of structural reforms at the macroeconomic level on LPG at the firm level.
The empirical model estimated with a multilevel approach could be specified as follows:
, , ∗ , ,
(7)
denotes labor productivity growth, , , the reform index, ∗
, , the interaction between the reform index and conditional factors described
below. As previously, we control for firm-level characteristics, macroeconomic variables, and a set of country-, sector-, and year-fixed effects. As described above, connection to foreign market is captured by a dummy variable that takes 1 if a positive share of sales is exported directly or indirectly and 0 otherwise. Financial access is a dummy variable that takes 1 if a firm has a credit line or an overdraft facility and 0 otherwise. The level of distortions facing firms is captured by a dummy variable that takes 1 for firms in the fourth quintile of the distribution of distortions, i.e. firms facing a high level of distortions. Firm size is captured by four categorical variables based on the number of permanent employees: Micro-firms (1 to 10), Small (11 to 50), Medium (51 to 200), and Large (more than 200).
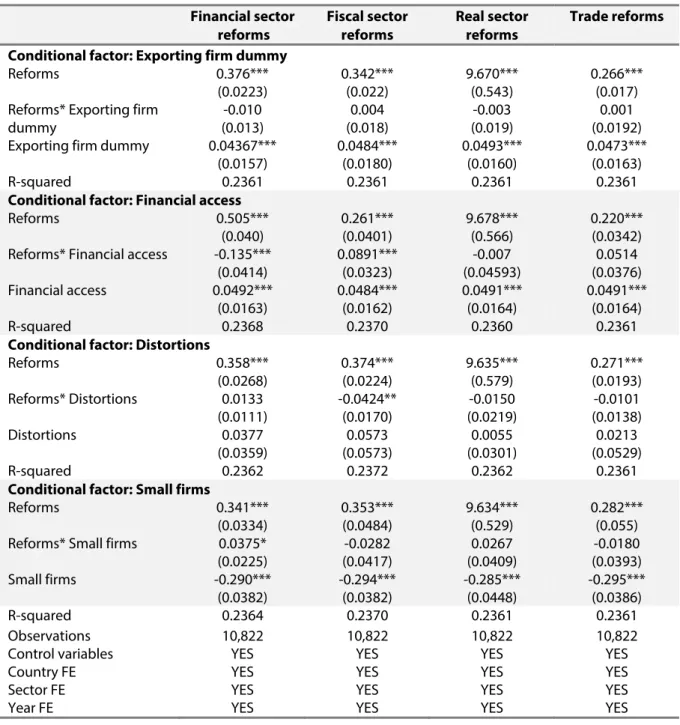
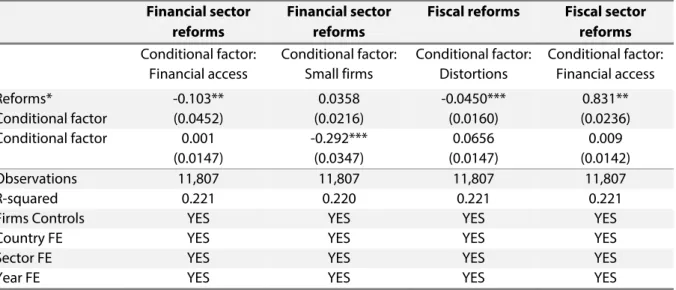
The findings are reported in Table 4 below. First, we assess whether the access to the international market influences the effects of structural reforms at the macroeconomic level on firm-level productivity. Contrary to our expectations, being connected to the foreign market does not generate specific labor productivity gains from structural reforms. We find no evidence of this assumption. The estimated coefficients are positive (except for the real sector reform) but not statistically significant. Second, we find that financially-included firms benefit less from financial reforms. The estimated coefficient of the interaction term of financial access and financial reform variables is negative and statistically significant at 1 percent. Being financially included, firms reduce firm-level productivity gain by 0.135 percentage point for a one standard deviation increase in financial reforms. Third, financial access also strengthens the relationship of Fiscal reforms on firm-level productivity. The coefficient associated with the interaction term of financial access and fiscal reform variables is positive and statistically significant at 1 percent. The magnitude of firm-level productivity gain is 0.089 for a one standard deviation increase in fiscal reforms. These findings suggest that structural reforms of financial sectors in developing countries help financially excluded firms to have better access to finance, thereby boosting their firm-level productivity. Concerned the additional gains from fiscal reforms for firms having access to finance, the findings suggest that fiscal reforms seem to open access to a new source of financing. Fiscal structural reforms such as debt management could lower borrowing rate spreads for firms having access to finance and enable the local currency financial market to function properly. In addition, other structural reforms such as tax structural reforms could increase the efficiency of the banking or financial system as these could reduce uncertainty and intertemporal incoherence.
Fourth, as expected, we find that the effects of fiscal reforms on labor productivity gain are hindered by distortions. The more a firm faces distortions in the business environment, the less are firm-level productivity gains from fiscal reforms. The estimated coefficients of the interaction term
between distortions, fiscal reform is negative and statistically significant at the 5 percent level. A one standard deviation increase in fiscal related structural reforms raises firm-level productivity by 0.342 standard deviation. The cost of being a part of the top 50 more distorted firms is 0.042 standard deviation decrease in firm-level productivity for a one standard deviation increase in fiscal reforms, respectively. As expected, the findings suggest that facing a higher level of distortions, measured in this paper as the costs in the percentage of sales of crime, insecurity, power outage and bribe paid “to get things done,” mitigates the effects of fiscal reforms. These findings suggest that fiscal structural reforms may help reduce distortions in a business environment such as bribery
activities. Consequently, firms using corruption to grease the wheels of the business environment19
may be disadvantaged by these structural reforms, especially anti-corruption policies. Finally, in terms of firms’ size, the evidence suggests that small firms benefit more from financial reforms relative to the other ones. The estimated coefficient of the interaction term of the small firm and the financial reform variables is positive and statistically significant at 10 percent. Being a small firm improves labor productivity growth gains from financial reforms by 0.038 standard deviation for one standard increase in financial reforms. As pointed out by Atérido et al. (2011), small businesses have less access to formal finance. Hence, financial reforms that aim at easing financial constraints will impact small firms mostly.
In sum, structural reforms increase firm-level productivity in developing countries. Factors such as financial access, distortions, and the size of firms play a conditional role. The findings suggest that financial access and being a small firm enhance the impact of Financial reforms on firm-level productivity. The effect of fiscal structural reforms is improved by better financial access while hindered by distortions. The effect of trade structural reforms on labor productivity growth is also impaired by distortions in the business environment. We show in the appendices that the findings are robust to alternative measures of productivity, methodologies, additional control variables, and counterfactual experiment based on unsuccessful reforms.
19 Herrera and Kouamé (2017) for more extensive discussion on firms using corruption to grease the wheels of the business environment.
Table 4. Effects of specific structural reforms on firm-level productivity—Conditional factors Financial sector reforms Fiscal sector reforms Real sector reforms Trade reforms
Conditional factor: Exporting firm dummy
Reforms 0.376*** (0.0223) 0.342*** (0.022) 9.670*** (0.543) 0.266*** (0.017) Reforms* Exporting firm
dummy -0.010 (0.013) 0.004 (0.018) -0.003 (0.019) 0.001 (0.0192)
Exporting firm dummy 0.04367***
(0.0157) 0.0484*** (0.0180) 0.0493*** (0.0160) 0.0473*** (0.0163) R-squared 0.2361 0.2361 0.2361 0.2361
Conditional factor: Financial access
Reforms 0.505*** (0.040) 0.261*** (0.0401) 9.678*** (0.566) 0.220*** (0.0342) Reforms* Financial access -0.135***
(0.0414) 0.0891*** (0.0323) -0.007 (0.04593) 0.0514 (0.0376) Financial access 0.0492*** (0.0163) 0.0484*** (0.0162) 0.0491*** (0.0164) 0.0491*** (0.0164) R-squared 0.2368 0.2370 0.2360 0.2361
Conditional factor: Distortions
Reforms 0.358*** (0.0268) 0.374*** (0.0224) 9.635*** (0.579) 0.271*** (0.0193) Reforms* Distortions 0.0133 (0.0111) -0.0424** (0.0170) -0.0150 (0.0219) -0.0101 (0.0138) Distortions 0.0377 (0.0359) 0.0573 (0.0573) 0.0055 (0.0301) 0.0213 (0.0529) R-squared 0.2362 0.2372 0.2362 0.2361
Conditional factor: Small firms
Reforms 0.341*** (0.0334) 0.353*** (0.0484) 9.634*** (0.529) 0.282*** (0.055)
Reforms* Small firms 0.0375*
(0.0225) -0.0282 (0.0417) 0.0267 (0.0409) -0.0180 (0.0393) Small firms -0.290*** (0.0382) -0.294*** (0.0382) -0.285*** (0.0448) -0.295*** (0.0386) R-squared 0.2364 0.2370 0.2361 0.2361 Observations 10,822 10,822 10,822 10,822
Control variables YES YES YES YES
Country FE YES YES YES YES
Sector FE YES YES YES YES
Year FE YES YES YES YES
Notes: The table presents standardized coefficients of the effects of structural reforms on firm-level labor productivity growth using a multilevel mixed effects model. All estimates use the weights and are standardized so that can be compared across structural reforms. Robust standard errors clustered at the country level are in parentheses. ***, **, * denote significance at the 1, 5, and 10 percent level.
4.5. Complementarities between structural reforms
In this section, we assess whether structural reforms have substitutable or complementarity effects on firm-level productivity. Documenting the complementarity between structural reforms would help the design of reform package when preserving firms’ growth potential is at the core of policy recommendation.
If several policies are implemented, complementarity and sequencing become vital issues. As pointed out by Dewatripont and Roland (1995) and Hausmann et al. (2005), the success of implementation might depend on the order of structural reforms. Dewatripont and Roland (1995) suggest prioritizing on political feasibility, and Hausmann et al. (2005) recommend targeting the most binding constraints. For instance, the effectiveness of growth-friendly structural reforms could have mutually reinforcing effects. Complementary structural reforms, such as trade liberalization or real sector reform (labor and product markets structural reforms), could enhance the impact of fiscal reforms by promoting savings, stimulating investment, and unlocking firm-level productivity gains. To analyze potential substitutability and complementarity between structural reforms, we estimate a modified version of equation (5) by introducing interaction terms between structural reforms:
, ∗
(8)
, 1,2,34
where refers to labor productivity growth, , and two different
structural reforms among financial, fiscal, real and trade sector structural reforms, and ∗
the interaction term between them. The coefficient captures the complementarity effect. The latter is expected to be positive if two structural reforms have mutually reinforcing effects (complementarity effects) and negative if the structural reforms have mutually adverse effects (substitutability effect). is expected to be statistically insignificant if the effects of the structural reforms on firm-level productivity are independent. The potential complementarity among structural reforms will be tested through six (6) equations, including each one-interaction theme between structural reforms. Each equation is estimated with a multilevel model as described above and controls for firm-level characteristics, macroeconomic variables as well as country-, sector-, and year-fixed effects.
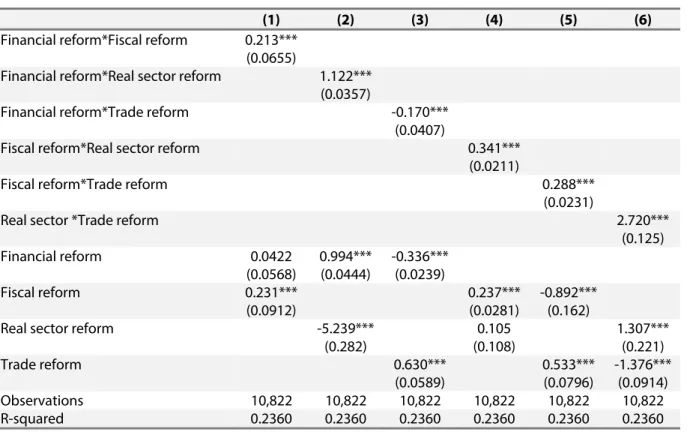
Results are reported in Table 5. Columns (1), (2), and (3) check whether financial reforms are complementary with fiscal, real sector and trade sector structural reforms, respectively. Columns (4) and (5) assess potentially complementary effects between fiscal, real, and trade reforms, respectively. Finally, column (6) examines the potentially complementary effect between real sector and trade reforms.
We find that, except for financial and trade structural reforms, all structural reforms considered are bilaterally complementary in improving firms’ labor productivity growth. The coefficients associated with the interaction terms between structural reforms are positive and statistically significant at 1 percent. The potential substitute relationship between financial and trade structural reforms that can explain by the stage of development of the countries in the sample. At an early stage of development, finance may not be a key determinant of the country abilities to perform (Henderson et al., 2013). Implementing financial reforms in that environment may not reinforce or
hinder the effects of trade structural reforms (or inversely) as the financial sector stills weakly developed.
These results imply that most of the structural reforms under IMF programs can be implemented jointly to maximize their effects on the firm-level productivity of firms.
Table 5. Substitutable or complementary effects of structural reforms
(1) (2) (3) (4) (5) (6)
Financial reform*Fiscal reform 0.213*** (0.0655)
Financial reform*Real sector reform 1.122***
(0.0357)
Financial reform*Trade reform -0.170***
(0.0407)
Fiscal reform*Real sector reform 0.341***
(0.0211)
Fiscal reform*Trade reform 0.288***
(0.0231)
Real sector *Trade reform 2.720***
(0.125) Financial reform 0.0422 (0.0568) 0.994*** (0.0444) -0.336*** (0.0239) Fiscal reform 0.231*** (0.0912) 0.237*** (0.0281) -0.892*** (0.162)
Real sector reform -5.239***
(0.282) 0.105 (0.108) 1.307*** (0.221) Trade reform 0.630*** (0.0589) 0.533*** (0.0796) -1.376*** (0.0914) Observations 10,822 10,822 10,822 10,822 10,822 10,822 R-squared 0.2360 0.2360 0.2360 0.2360 0.2360 0.2360
Notes. The table presents standardized coefficients of the effects of structural reforms on firm-level labor productivity growth using a multilevel mixed effects model. The specifications include firm’s individual characteristics, sector and year fixed effects. At the macroeconomic level, the specifications include the average growth of GDP, the level of inflation, and the quality of policies and regulations related to the private sector and country fixed effects. All estimates use the weights and are standardized so that can be compared across structural reforms. Robust standard errors clustered at the country level are in parentheses. ***, **, * denote significance at the 1, 5, and 10 percent level.
In addition of using the multilevel model, the paper devotes efforts to minimize endogeneity concerns. We present sample balance tables showing that the sample developing countries are not statistically different from those without the IMF’s program regarding key macroeconomic variables. Having the pre-treatment macroeconomic variables well matched allows us to minimize the concerns that the pre-reforms macroeconomic environment drives the estimated effects of reforms on productivity. Moreover, the identification strategy relies on matching productivity data only with reforms within the 3 previous years. The matching strategy limits potential reverse causality issues between reforms and productivity by ensuring that the approval year of each the IMF’s arrangement programs corresponds exactly or is after the reference year of labor productivity growth. This means that the possibility of the level of productivity determining the implementation of reforms can be ignored.
5. Concluding remarks
Structural reforms are at the core of policy advice to developing countries. Reforms are expected to ensure sound macroeconomic and a non-distortionary environment, improve firm-level productivity, deliver sustainable and inclusive growth, and raise long-term living standards. Several papers have analyzed the issue at the macroeconomic level, but few have focused on the transmission from structural reforms to the microeconomic level.
This paper takes advantage of original datasets (structural reforms from the IMF and enterprise surveys from the World Bank) and examines the impact of structural reforms at the macroeconomic level on firm-level productivity. Structural reforms computed from the IMF Monitoring of Fund Arrangements (MONA) database are based on conditionalities implemented (met as planned and met with minor delay) under IMF-supported arrangement programs. Using the economic description of each reform, we regroup structural reforms into four different classes: financial, fiscal, real sector, and trade structural reforms. Firms’ characteristics and firm-level productivity measures are culled from the World Bank Enterprise Surveys (WBES) database.
This paper finds that there is strong evidence that structural reforms at the macroeconomic level are associated with firm-level productivity improvement at the firm level. All structural reforms at the macro level considered in this paper (financial, fiscal, real sector, and trade structural reforms) have positive effects on firm-level productivity at the firm’s level. Interestingly, the real sector reform turns out to be the reform with the most sizeable impact on firm-level productivity. In addition, being a “strong reformer” is associated with stronger firm-level productivity gains at the firm level. Furthermore, the relationship between structural reforms and firm-level productivity is nonlinear and influenced by certain firms’ characteristics such as financial access, whether facing a distortionary environment, and size. We find that financial inclusion strengthens the impact of financial and fiscal reforms on firm-level productivity; being a small firm enhances the impact of financial reforms on firm-level productivity, and the effects of fiscal and trade structural reforms on firm-level productivity are hindered by distortions. Finally, we find that, except for financial and trade structural reforms, all structural reforms considered are bilaterally complementary in improving on firm-level productivity. This paper finds that structural reforms are key to improving firm-level productivity. The design of structural reforms should be comprehensive and account for complementarities and nonlinearities between structural reforms.
The combined WBES dataset used in this paper focuses only on the formal sector, while in low and low middle-income countries, an important share of the labor force works in the informal sector. Our findings capture, therefore, the firm-level productivity gain from structural reforms in the formal sector. As both informal and formal sector are interrelated in developing countries, we should expect the gains from structural reforms to spread over the informal through the externality effects and potential incitation for informal firms to move into the formal sector. Similarly, this paper does not account structural reforms not supported by IMF programs due to lack of data