HAL Id: hal-01784502
https://hal.archives-ouvertes.fr/hal-01784502
Submitted on 10 May 2018
HAL is a multi-disciplinary open access
archive for the deposit and dissemination of
sci-entific research documents, whether they are
pub-lished or not. The documents may come from
teaching and research institutions in France or
abroad, or from public or private research centers.
L’archive ouverte pluridisciplinaire HAL, est
destinée au dépôt et à la diffusion de documents
scientifiques de niveau recherche, publiés ou non,
émanant des établissements d’enseignement et de
recherche français ou étrangers, des laboratoires
publics ou privés.
morphology
Wagner L. F. Marcolino, Jean-Claude Bouret, Thierry Lanz, Donavan S.
Maia, Marc Audard
To cite this version:
Wagner L. F. Marcolino, Jean-Claude Bouret, Thierry Lanz, Donavan S. Maia, Marc Audard.
Mid-infrared observations of O-type stars: spectral morphology. Monthly Notices of the Royal Astronomical
Society, Oxford University Press (OUP): Policy P Oxford Open Option A, 2017, 470 (3), pp.2710
-2722. �10.1093/mnras/stx1191�. �hal-01784502�
Mid-infrared observations of O-type stars: spectral
morphology
?
W. L. F. Marcolino
1†
, J.-C. Bouret
2, T. Lanz
3, D. S. Maia
1, and M. Audard
41Universidade Federal do Rio de Janeiro, Observat´orio do Valongo, Ladeira Pedro Antˆonio, 43, Rio de Janeiro, Brasil 2Aix Marseille Univ, CNRS, LAM, Laboratoire d’Astrophysique de Marseille, Marseille, France
3Observatoire de la Cˆote d’Azur, Nice, France
4Department of Astronomy, University of Geneva, ch. d’Ecogia 16, CH-1290 Versoix, Switzerland
Last updated 2017 April; in original form 2017 March
ABSTRACT
We present mid-infrared observations for a sample of 16 O-type stars. The data were acquired with the NASA Spitzer Space Telescope, using the IRS instrument at moder-ate resolution (R ∼ 600), covering the range ∼ 10 − 37 µm. Our sample includes early, mid and late O supergiants and dwarfs. We explore for the first time their mid-IR spec-tral morphology in a quantitative way. We use NLTE expanding atmosphere models to help with line identifications, analyze profile contributions and line-formation regions. The O supergiants present a rich emission line spectra. The most intense features are from hydrogen - 6α, 7α, and 8α - which have non-negligible contributions of He i or He ii lines, depending on the spectral type. The spectrum of early O supergiants is a composite of H i and He ii lines, He i lines being absent. On the other hand, late O supergiants present features composed mainly by H i and He i lines. All emission lines are formed throughout the stellar wind. We found that O dwarfs exhibit a feature-less mid-IR spectrum. Two stars of our sample exhibit very similar mid-IR features, despite having a very different optical spectral classification. The analysis of O-type stars based on mid-IR spectra alone to infer spectral classes or to estimate physical parameters may thus be prone to substantial errors. Our results may therefore in-form spectroscopic observations of massive stars located in heavily obscured regions and help establish an initial framework for observations of massive stars using the Mid-Infrared Instrument on the James Webb Space Telescope.
Key words: massive stars – O stars – mid-infrared spectroscopy – stellar winds – atmosphere models
1 INTRODUCTION
Massive O stars have been extensively studied in the last decades through the comparison of synthetic spectra with high-resolution spectroscopic data. Most of such investiga-tions found in the literature focus on ground-based opti-cal observations, and some also include satellite ultraviolet (UV) observations. Depending on the luminosity class, both the photosphere and wind of an O star can be detected in the optical (e.g., in early supergiants). However, the major energy output from massive stars is in the UV region, where most stellar wind diagnostics can be found.
After the first rocket experiments (Morton 1967) and
? Based on observations with the NASA Spitzer Space Telescope,
which is operated by the Jet Propulsion Laboratory (JPL), Cal-ifornia Institute of Technology (Caltech) under a contract with National Aeronautics and Space Administration (NASA). † Contact e-mail:wagner@astro.ufrj.br
with the early satellite missions in the UV (e.g., Coperni-cus, IUE), a variety of P-Cygni line profiles of different ions was revealed for the first time (e.g., N v λλ1239, 1243, O v λ1371, Si iv λλ 1394, 1403, C iv λλ1548,1551, He ii λ1640, and N iv λ1718). It was soon discovered that the UV mor-phological properties of the O-type stars is strongly
cor-related to their optical spectral classifications (Walborn &
Panek 1984). Since then, these lines were continuously used to infer the mass-loss rates and terminal wind velocities of O
stars of various spectral types (Howarth & Prinja 1989). In
addition, detailed analyses of UV data revealed several new physical informations (e.g., NACs, superionization, clump-ing; Prinja & Howarth 1986;Bouret et al. 2005) and pro-vided ways to check parameters inferred from optical
anal-yses (e.g., effective temperatures;Crowther et al. 2002).
Compared to the UV and optical studies, there are rel-atively few high-resolution observations of O stars at longer wavelengths. In the infrared (IR), the energetic output of
Table 1. Log of the Spitzer Space Telescope mid-IR observations. Exposure times include target plus sky background subtraction. Star Spectral type Total exposure time (s) Total exposure time (s) Obs. Date Note
IRS/SH IRS/LH HD 66811 O4If+ 38 50 2007-10-19 ζ Puppis 2007-10-23 HD 190429A O4If+ 218 1935 2004-06-26 HD 188001 O7.5Iaf 244 1935 2006-11-14 9 Sge 2007-06-13 HD 207198 O8.5II 126 967 2006-10-18 HD 30614 O9.5Iab 63 117 2006-10-18 α Cam 2007-10-03 HD 188209 O9.5Iab 244 1935 2006-10-18 HD 209975 O9.5Ib 126 488 2006-09-15 19 Cep HD 195592 O9.7Ia 126 244 2006-10-18 2006-11-13 HD 46223 O4V((f)) 488 3869 2007-04-27 HD 46150 O5V((f)) 488 2902 2007-04-27 HD 199579 O6V((f)) 244 967 2007-06-18 HD 206267 O6.5V((f)) 244 488 2006-10-18 HD 47839 O7V((f)) 488 4837 2007-04-27 15 Mon 2007-05-02 HD 209481 O9V 488 3869 2006-10-18 LZ Cep HD 214680 O9V 488 4837 2007-08-03 10 Lac 2007-09-02 HD 38666 O9.5V 488 3869 2007-10-06 µ Col
type stars is considerably weaker than in the optical and UV regions. Moreover, depending on the IR band, several obser-vational difficulties appear (e.g., telluric contamination, sky and thermal emission). Nonetheless, near and mid-IR data present obvious advantages in some specific contexts. For example, at various Galactic locations, the visual extinction
is very large, reaching AV ∼ 20 − 30 (e.g., obscured H ii
re-gions; Galactic center), and the analysis and interpretation of J, H and K band spectra remains the best opportunity. In
this context,Lenorzer et al.(2004) were able to show that
the He i-ii line ratios in the near-IR correlate well with the line ratios in the optical spectrum that are used for spectral
classification (see alsoHanson et al. 1996). Soon after,
Repo-lust et al.(2005) demonstrated for a sample of OB stars that photospheric and wind parameters derived from the near-IR alone matched well the ones derived from the optical (within error bars). That is, a priori one can obtain accurate physi-cal parameters of OB stars which are not accessible at visual or UV wavelengths because of high extinction.
However, we should note that a direct spectral classi-fication or derivation of physical parameters based only on
the infrared is not problem-free. For instance, Conti et al.
(1995) found two Of stars with K band spectra typical of
Wolf-Rayet stars (WN type), despite having normal optical and UV characteristics found in the Of class. By analyzing
evolved massive stars,Morris et al.(1996) reported a
simi-lar problem, where objects from a certain group -WNL, Of, Of/WN, Be, B[e] or LBV - can be classified as a member of another class if one relies uniquely on the 2µm spectra. An analogous issue is pointed out again in the present paper.
Combined with other spectral regions, long wavelength data can provide valuable additional constraints on impor-tant physical parameters. In the near-IR for example, the Brα line emerged as an important mass-loss rate diagnostic
in O stars (Lenorzer et al. 2004;Najarro et al. 2011). The
IR and radio region have also long been known to provide
mass-loss values through continuum flux excesses (Wright
& Barlow 1975). However, given the very low fluxes, radio band studies are usually restricted to the brightest objects. More recently, radio plus IR and optical data were used by
Puls et al.(2006) to evidence strong constraints on the ra-dial stratification of wind clumping in O stars (density inho-mogeneities). Such multi-wavelength investigations are cru-cial to address the stellar and wind properties of massive stars. Uncertainties on stellar parameters can be reduced and model limitations might become clear by using as many line and continuum diagnostics as possible.
In this work, we present mid-IR observations of O stars and discuss their spectral morphology for the first time. The data were acquired with the IRS instrument on-board the NASA Spitzer Space Telescope. Our sample consists of 16 stars, comprising late, mid and early dwarfs and super-giants. We describe their mid-IR spectral morphology with the aid of NLTE stellar atmosphere models and complemen-tary ultraviolet and optical data. We present line identifi-cations, equivalent width measurements, profile formation regions and ion contributions. There are clear differences among the spectral types. O dwarfs present featureless at-mospheric spectra. In supergiants, the mid-IR lines - essen-tially from hydrogen and helium - increase considerably in strength from late to early supergiants. Interestingly, two stars of our sample present very similar mid-IR spectra, despite having different optical spectra (spectral types). In
Sect. 2, we start by presenting our sample along with the
observational details. In Sect.3, we show the observed
spec-tra and discuss the mid-IR specspec-tral morphology in detail.
2 OBSERVATIONS
We used the IRS instrument onboard the NASA Spitzer Space Telescope to obtain mid-infrared high-resolution spec-tra for a sample of 16 O stars (PI T. Lanz, program 30030). The Short-High (SH) and Long-High (LH) modules were
used (Houck et al. 2004). Both are cross-dispersed echelle
spectrographs which provide a wavelength coverage of ∼ 9.9 − 19.6µm and ∼ 18.7 − 37.2µm, respectively. The de-tectors are 128 × 128 pixel Si:As blocked impurity band ar-rays, with 2.3 arcsec per pixel (SH) and 4.5 arcsec per pixel (LH). The exposure times were estimated to aim for signal-to-noise ratios of about 150 and 50 with the SH and LH mod-ules, respectively. The data reduction was performed from the processed pipeline data, using post-BCD tools and the
SPICE package (Teplitz & Brinkworth 2011). The final
spec-tra were obtained by co-adding the different sub-exposures (2 to 4 individual exposures for SH and LH, respectively) and by merging the different orders with an IDL routine. They were all normalized by polynomial fits to the continua, each specified by a careful selection of points in continuum windows. Our sample consists of 8 dwarfs and 8 supergiants, comprising late, mid and early types. The stars and
corre-sponding spectral classes (Sota et al. 2014) are presented
in Table 1. Total exposure times for each module are
indi-cated, including time used for sky background substraction. For HD 190429A, we did not repeat observations in the SH range and made use of previous IRS calibration observations, namely, from AOR10021376.
In order to achieve our goals, we also use high-resolution ultraviolet and optical observations to further analyze the mid-infrared region quantitatively by means of sophisticated
atmosphere models (see Section3). In the optical, we used
public and own data from the FEROS (R ∼ 48000), NAR-VAL (Telescope Bernard-Lyot; R ∼ 65000), ESPADONS (CFHT; R ∼ 68000), and ELODIE (OHP; R ∼ 42000) spec-trographs. In the ultraviolet, we focused on SWP spectra from the International Ultraviolet Explorer satellite.
3 MID-IR SPECTRAL MORPHOLOGY
Previous mid-IR spectra of O-type stars were shown by
Ardila et al. (2010) in their Spitzer Atlas of Stellar Spec-tra (SASS). The atlas contains a total of 159 objects of sev-eral spectroscopic types, out of which 12 objects are O-type stars. It is most complete at spectral types later than the G type, for luminosity classes V (dwarfs) and III (giants). The O stars are not analyzed in detail, neither qualitatively
nor quantitatively.Ardila et al.(2010) only emphasized that
the spectra contain emission lines that are typical of wind or circumstellar material. The resolving power of the SASS observations is ∼ 60 − 130, with the low-resolution mode of the IRS, that is a factor of about 5 to 10 lower than the resolution of the spectra shown here. Previous observations with other space observatories (e.g., ISO, IRAS) are also of lower resolution, focusing mainly in spectral types and
ob-jects other than O stars (see e.g., the compilation byHodge
et al. 2004).
In order to provide a robust morphological analysis of the spectra, we relied on stellar atmosphere models
com-puted with the code CMFGEN (Hillier & Miller 1998). We
provide line identifications, equivalent width measurements
(Wλ), compute individual ion contributions and line
forma-tion regions to fully characterize the mid-IR spectrum of O
stars for the first time. We refer the reader toBouret et al.
(2012) for a detail description of the code and a canonical
ap-proach for a thorough analysis of massive stars. For several stars, we did not start the quantitative analysis from scratch. Initial models were taken from previous investigations by our
group (Martins et al. 2015a; Martins et al. 2015b; Bouret
et al. 2012). For completeness, we present the photospheric
and wind parameters of the final models in TableA1.
A detailed discussion about the models, their sensitiv-ity to the parameters and the potential of mid-IR spectra to constrain the physical properties, especially useful in the context of the arrival of JWST, will be presented in a forth-coming paper. Here, we focus on the mid-IR morphology. We present and discuss the spectra of our sample below, starting with the O supergiant stars.
3.1 O supergiants
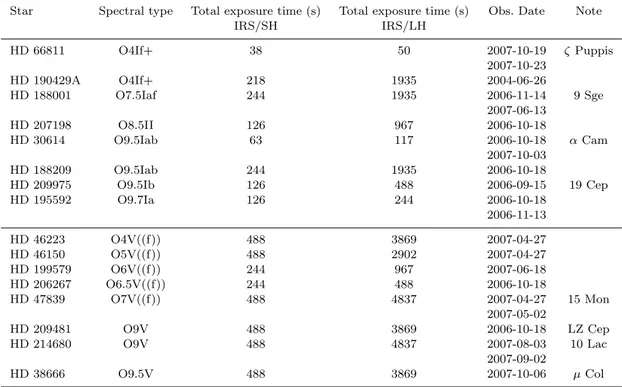
The spectra of the O supergiants of our sample are displayed
in Figs.1and2. For clarity, they were normalized and offset
by a constant. We cut data beyond ∼ 31 µm, due to very poor signal-to-noise ratio.
The observed spectra are characterized by a wealth of emission lines. The identification of these features was made more reliable thanks to the synthetic spectra computed with CMFGEN, which agree well for the whole sample with obser-vations throughout the entire spectral range. We stress that this is truly remarkable since the parameters of the models were constrained from the analysis of the optical and UV spectra. Although models are not the focus of the present
paper, we illustrate this excellent agreement in Fig.A1using
the O4If+ star ζ Puppis as an example. The high fidelity of the synthetic spectra, over such a broad wavelength range,
is a major achievement of stellar atmosphere modeling1.
The most intense spectral lines in the mid-IR spectrum of the O-type supergiants correspond to wavelengths of the H i lines: 6α (12.37µm), 7α (19.06µm) and 8α (27.80µm). They arise from high-level transitions: n = 7 → 6, n = 8 → 7, and n = 9 → 8, respectively. However, as we will show below, these lines and in fact most H i transitions also contain a contribution of He i or He ii lines, depend-ing on the spectral type (or, more precisely, of the effective temperature).
The hottest two stars, with spectral types O4, also show a few individual lines of He ii, most intense at 13.13µm (11-10), 17.26µm (12-11), 22.17µm (13-12), and significantly weaker at 15.47µm (15-13), 16.77µm (18-15). Note that the line at 17.26µm is also observed in HD 207198, despite its much later spectral type (O8.5). The use of models allowed to pinpoint this line, as it is weak and not much stronger than the noise level in surrounding zones.
1 We note that our best models initially predicted a relatively
intense H i line at 13.19 µm (n = 18 → 10), which is absent in all observed spectra. After some investigation, we found that the f and A values for this transition in the CMFGEN atomic database is higher than it should be by a factor of 10, according to the NIST database (Kramida et al. 2015; John Hillier, private comm.).
Figure 1. The mid-IR Spitzer spectra of the supergiants of our sample, between 9.8 and 20.4 µm (black lines), with early-type to late-type supergiants from bottom to top. Synthetic CMFGEN spectra are also displayed (red lines). They are essential to characterize quantitatively the mid-IR spectrum, providing the line identifications shown, individual ion contributions and line formation regions (see text for more details).
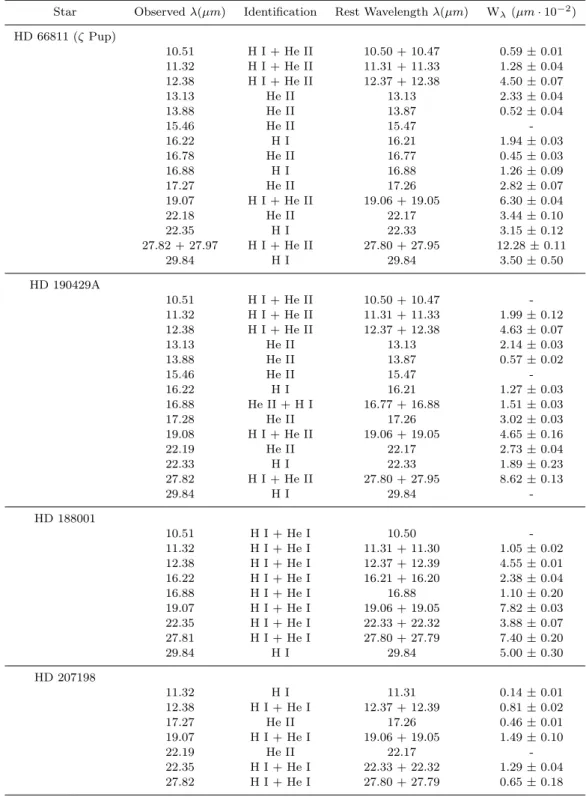
We present a detailed list of line identifications and Wλ
measurements in Table A2. In some cases, no reliable Wλ
could be obtained (e.g., weak or blended feature). There-fore, the respective line identifications on the table should be then interpreted as an indication that a line is likely present, based on the overlying models. These results are
summarized in graphical form in Fig.3, where we present
mean equivalent widths of the late plus mid (> O7) and
ear-lier supergiants classes. The Wλvalues increase from late to
the early supergiants. Its clear that early supergiants have the most intense lines. Moreover, regardless of the spectral class, the most intense features are always 6α, 7α, and 8α.
We did not identify metallic lines (e.g., from CNO ions)
in a definitive way, in contrast to spectral features observed
in the near-IR. For example,Hanson et al.(1996) report lines
of C iv and N iii in several O stars spectra around 2µm. The lines that are not accounted for by our model spectra are unlikely to be formed in the atmosphere of the stars. This is for instance the case of the features between ∼ 16 − 19µm, most clearly visible in the mid-to-late supergiants, and for which we could not find any identification in the literature
(see Fig. 1). We do not exclude the possibility that some
of them might be artifacts that remained despite the data reduction process. The features at ∼ 15.5µm and close to 26µm (box-like shape) are also clear discrepancies. They are
Figure 2. Same as Fig.1but for the spectral region between 20.4 and 31.0 µm.
and2). They were also reported in the Spitzer observations
of EZ Canis Majoris, a WN star, by Morris et al. (2004)
who identified them to [Ne iii] 15.5µm and [O iv] 25.9 µm transitions.
The [S iv] 10.5 µm, [Ne ii] 12.8 µm, and [S iii] 18.7µm lines, are also possibly present in some spectra, e.g. in HD 190429A and HD 195592. These two stars are known binaries. The respective companions of each were certainly in the field of view of the SH and LH modules during ob-servations, but it remains speculative to assume that the companions are responsible for the observed features. We note that HD 195592 has a very high reddening (E(B-V) =
1.17, seeMcSwain et al. 2007), indicating that lots of
inter-stellar/circumstellar material is on the line-of-sight. Hence we are tempted to assume that the emission features are produced around HD 195592. Interpreting their presence in
HD 190429A is more difficult as E(B-V) = 0.46 (Bouret et al.
2012) and is nothing exceptional even for early-type
super-giants. In any case, such fine-structure transitions must be formed far from the bulk of the stellar wind, where densities
are very low (log ne/cm3∼ 5).
Despite our efforts, several non-atmospheric features re-mained unidentified. We note that the signal-to-noise starts to deteriorate beyond 28µm and it becomes hard to confirm the presence of lines at longer wavelengths, regardless the origin.
Figure 3. Mean equivalent widths of mid plus late-type O su-pergiants (> O7; squares; thin solid line) and early-type O super-giants (diamonds; thick solid line). Note that the highest values correspond to the wavelengths of the 6α, 7α, and 8α transitions. The He ii transitions at 13.13µm, 17.27µm, and 22.18µm, clearly separate early-type objects from later-type stars.
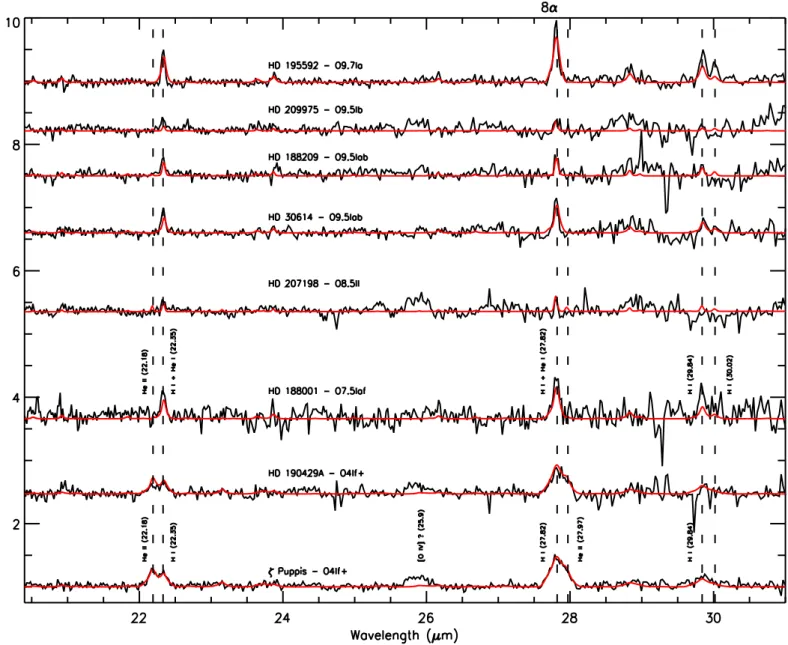
Figure 4. Individual ion contributions to the most intense mid-IR profiles in O supergiants. Top panels correspond to HD 188001 (O7.5Iaf). Bottom panels correspond to ζ Puppis (O4If+). For clarity, only the synthetic lines 6α and 8α are shown (full spec-trum: black full line; H i: red dashed line; He i: green dashed-dotted line; He ii: blue dashed-dotted line).
Figure 5. Line formation regions in O supergiants. The H i tran-sitions are the mid-IR (6α, 7α, and 8α) and Hα. The He i and He ii transitions chosen are at ∼12.36, 19.06, and 27.9 µm, i.e., at wavelengths corresponding to 6α, 7α, and 8α. He ii transitions at 13.13, 17.26, and 22.17 µm are also shown.
3.1.1 Line contributions and formation regions
Following our methodology to identify the transitions in the
spectra2, we found that the profiles 6α, 7α, and 8α (the most
intense ones) are contaminated by a He i-ii contribution, as
illustrated in Fig.4. For simplicity, we selected regions
com-prising the 6α and 8α lines and show only synthetic models for HD 188001 (O7.5Iaf) and ζ Puppis (O4If+) as examples. In early O supergiants, the full line profiles are formed by a contribution of H i and He ii. The He i contribution is negli-gible. The He ii contribution to 8α is particularly important, and is responsible for the asymmetry of the line profile. In mid and late supergiants, we see the opposite: the profiles mostly result from the H i transition, with a small contri-bution of He i, and He ii is absent. These characteristics of the mid-IR line spectra were more clearly evidenced thanks to the stellar atmosphere models.
Overall, from the observations and model spectra, we conclude that: (i) the early supergiants have the most in-tense transitions in the mid-IR; (ii) mid and late supergiants present the main features composed by H i and He i lines; (iii) early supergiants present the main features composed by H i and He ii lines, He i lines being absent; (iv) the most intense transitions are from H i 6α, 7α, and 8α.
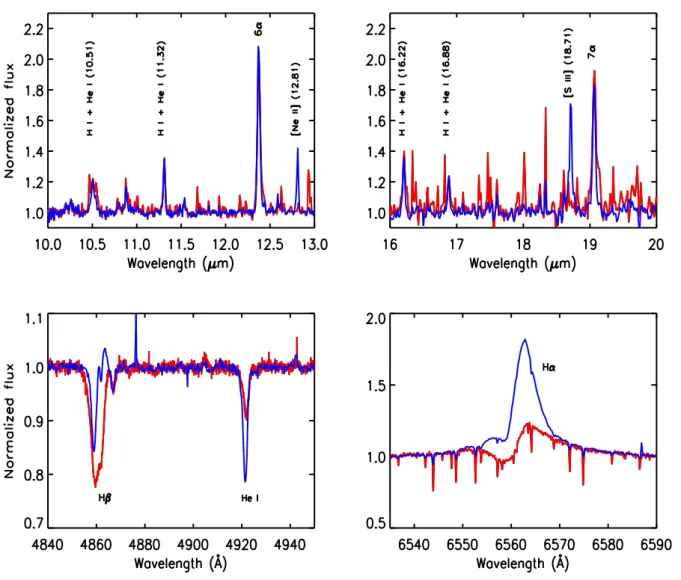
Now, we present the line formation regions (LFRs) for specific lines. Regarding H i lines, we chose 6α, 7α, and 8α. The He i and He ii transitions chosen are at ∼12.36, 19.05, and 27.9 µm. Besides mid-IR transitions, for comparison purposes, we compute LFRs for the C iv λ1551 and Hα
pro-files. We refer the reader toHillier(1987) for an expression
for the quantity that defines the LFR.
2 We have computed synthetic spectra produced by individual
Figure 6. The similar mid-IR (top) and drastically different optical spectra (bottom) of HD 195592 (O9.7Ia, blue lines) and HD 188001 (O7.5Iaf, red lines). Note that the mid-IR mismatches - in particular around 16-20µm - are likely due to non-atmospheric features, as discussed in Section3.
For simplicity, we present LFRs in Fig.5for two stars,
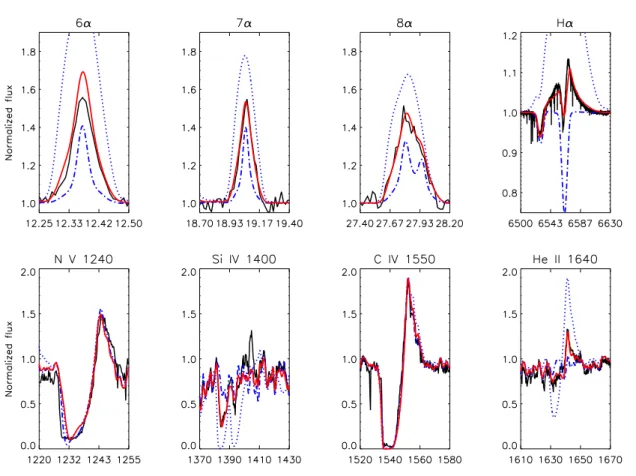
again HD 188001 (O7.5Iaf) and ζ Puppis (O4If+). It can be seen that 6α, 7α, and 8α follows the C iv ultraviolet line trend, being formed throughout the wind. The bulk of the He i lines (in mid and late-type supergiants) is formed in the inner wind, similar to Hα. The He ii LFRs (in early-type supergiants) follow more or less the ones of the mid-IR H i lines.
In conclusion, our results demonstrate that the observed mid-IR features in O supergiants are definitely formed in the stellar wind. Therefore, they are potential diagnostics for the determination of wind properties. A detailed analysis of mid-IR line responses to the different physical parameters is beyond the scope of the present paper and will be presented elsewhere. Here, we just emphasize that the same value for the mass-loss rate (and clumping parameters) allows us to match simultaneously the UV P-Cygni profiles, Hα, and the mid-IR lines, as demonstrated for ζ Puppis (appendix, Fig.
A2).
3.1.2 The case of the two supergiants HD 195592 and
HD 188001
From a pure morphological, mid-IR point of view,
HD 195592 is at odds with its spectral classification, namely, O9.7 Ia. While its fellow late-type O9 (and sub-division) su-pergiants exhibit weaker lines than the earlier type ones, the lines in HD 195592 are remarkably similar in shape and intensity to those of HD 188001, an O7.5 Iaf. This is best
illustrated in Fig.6, where we overplot a selection of lines
from the mid-IR spectra of the two stars (but see also Figs.
1and2for a pan view). We also show portions of the
opti-cal spectra, demonstrating that these stars are very different one of the other, in agreement to their spectral classification. A low-resolution UV (IUE) spectrum for HD 195592 is available and despite the modest signal-to-noise ratio, ex-hibits spectral morphology consistent with the star’s O9.7 Ia spectral type. So we are facing here an interesting conun-drum, and taken at face value, these two stars demonstrate that the mid-IR range should be used with caution to assign a spectral type to a massive supergiant star, at least in the
range from O7.5 to O9.7 (where most supergiants are ex-pected to belong). This is specially important in the context of observations of heavily obscured regions.
Despite this seemingly paradoxical behavior, models can be found that simultaneously fit the UV, optical, and mid-IR spectra. The parameters from these models can be
found in Table A1. The model parameters are fully
com-patible with the results found in the literature for stars of these spectral types, hence clearly suggesting a spectral de-generacy in the mid-IR (different stellar parameters but very similar spectra). This issue deserves a deeper theoretical in-vestigation that is beyond the scope of this paper.
In contrast to the arguments presented above, one can argue that (drastic) variability (O9 to O7) is a possible ex-planation for the atypical spectrum of HD 195592. Variabil-ity of HD 195592 from an ”normal” mid-IR O9 spectrum (i.e., like the others O9 in the sample) to an O7 spectrum (match-ing HD 188001) and back (if periodic) would be drastic, but not impossible. Binarity effects, wind instabilities, and wind collisions are all possibilities to produce spectral changes. If this is the case, our observations would then correspond to HD 195592 at the spectral state of an O7 (HD 188001). We note however that the SH and LH spectra of HD 195592 (and of HD 188001) were acquired at different dates (see Table
1). That is, in Figs. 1 and 2 we actually have four
spec-tra. If variability is very important, similar spectra would be unlikely.
3.2 O dwarfs
The midIR spectra of O dwarfs late, mid and early types -are featureless, that is, with an absence of conspicuous lines formed in the photosphere or in the stellar wind. For
com-pleteness, they are presented in Fig.A3along with our model
stellar atmosphere spectra, adopted from an UV/optical analysis.
The spectrum of HD 38666 has a very low signal-to-noise ratio at wavelengths longer than 15µm, hindering the analysis. The 10 Lac spectrum is of better quality, but it does not show either stellar or wind transitions. In HD 209481, the atmospheric transitions 6α, 7α and 8α are barely visible, if present at all. We recall that they are the strongest fea-tures in the spectra of O supergiants. Forbidden lines seem to be present in a few stars (e.g., [O iv]) and various narrow unidentified transitions are conspicuous.
Although more luminous, hotter, and with higher mass-loss rates than O9V stars, the O4-7V stars of our sample also present a featureless spectra. Again, various (non-atmospheric) features at ∼ 17-19µm and ∼ 23-27µm (see e.g, HD 199579), as well as [O iv] 25.9µm (see e.g., HD 206267) are present.
The results concerning the early dwarfs (O4-5V) are somewhat counterintuitive. Since their ultraviolet spectra contain intense wind emission lines - e.g., C iv λλ1548,1551 can be even found saturated, as in supergiants - one would expect at least weak emissions in the mid-IR. In fact, their effective temperature and luminosity values are even com-patible with the ones found in early supergiants (see Table
A1). We must remind however that their surface gravities
are higher by up to 1 dex relative to supergiants and most importantly, the mass-loss rates of the O supergiants can be higher by 1-2 dex. Therefore, it seems that a combination of
low gravity and intense mass-loss is needed for a detectable mid-IR line emission spectrum. Nevertheless, a firmer con-clusion awaits a more detail theoretical study.
Overall, we conclude that there is no atmospheric infor-mation regarding O dwarfs in the mid-IR beyond the con-tinuum flux level. The observed features are likely formed far from their atmospheres, being circumstellar or even from the ISM (e.g., diffuse emission). Some are certainly spurious, given the limited signal-to-noise achieved for some stars (see e.g., HD 38666 and HD 199579 at ∼ 29µm). Our models give confidence to this conclusion since they reveal pure mid-IR continua. This finding should be taken into account in fu-ture investigations. For example, it does not appear useful to acquire mid-IR spectra of main-sequence massive stars in regions with extremely high visual extinction at high cost with the MIRI instrument aboard the JWST.
4 CONCLUSIONS
We have presented an analysis of mid-IR data of O-type stars, based on observations with the NASA Spitzer Space Telescope (IRS instrument; R ∼ 600). We provided a de-tailed description of the spectra supported by model spectra from NLTE expanding model atmospheres calculated with the CMFGEN code.
We found that O supergiants present a rich emission line mid-IR spectrum, while O dwarfs are essentially feature-less in terms of atmospheric information. The most intense transitions found in O supergiants are the H i recombination lines: 6α (n = 7 → 6; 12.37µm), 7α (n = 8 → 7; 19.06µm), and 8α (n = 9 → 8; 27.80µm). However, according to our models, these lines have a non-negligible contribution of He i lines in mid and late O supergiants, and of He ii lines in early O supergiants. In early O-type supergiants, the He ii line contribution is responsible for the asymmetry of the 8α line profile.
We provided line identifications and measurements for
all detected H i, He i, and He ii features (Table A2). The
presence of isolated, relatively strong He ii lines at 13.13µm, 17.27µm, and 22.18µm, is a basic characteristic of early-type supergiant spectra. We do not identify lines from heavy el-ement ions (e.g., CNO) formed in the stellar photosphere or wind, in contrast to the near-IR spectrum. There are however several features that are probably of circumstellar origin, e.g., [Ne iii] 15.5µm and [O iv] 25.9 µm. Despite our efforts, a few detected emission features remain unidentified. Two supergiants – HD 188001 and HD 195592 – raised an interesting problem. Their mid-IR spectra are very simi-lar while their optical characteristics drastically differ. From a pure observational point of view, such fact means that the use of mid-IR data alone to classify O stars may be prone to errors if unsupported by observations in UV, optical or near-IR. This must be taken into account in observations of heavily-obscured regions (e.g., the Galactic Center, obscured H ii regions). Additionally, the lack of photospheric or wind features in the mid-IR spectrum of all O dwarfs put a strin-gent limitation about the usefulness of such observations. In regions inaccessible to UV or optical observations because of heavy extinction, the near-IR should be preferred to observe and analyze main-sequence massive stars.
ACKNOWLEDGEMENTS
The authors would like to thank D. J. Hillier for his con-tinuous support regarding CMFGEN. WM would like to thank J.-C. Bouret for the hospitality at the Laboratoire d’Astrophysique de Marseille, where part of the work was carried out. Support for this work was provided by NASA through an award issued by JPL/Caltech. This research also made use of the SIMBAD database and Vizier service, op-erated at CDS, Strasbourg, France.
REFERENCES
Ardila D. R., et al., 2010,ApJS,191, 301
Bouret J.-C., Lanz T., Hillier D. J., 2005,A&A,438, 301
Bouret J.-C., Hillier D. J., Lanz T., Fullerton A. W., 2012,A&A,
544, A67
Conti P. S., Hanson M. M., Morris P. W., Willis A. J., Fossey S. J., 1995,ApJ,445, L35
Crowther P. A., Hillier D. J., Evans C. J., Fullerton A. W., De Marco O., Willis A. J., 2002,ApJ,579, 774
Hanson M. M., Conti P. S., Rieke M. J., 1996,ApJS,107, 281
Hillier D. J., 1987,ApJS,63, 965
Hillier D. J., Miller D. L., 1998,ApJ,496, 407
Hodge T. M., Kraemer K. E., Price S. D., Walker H. J., 2004,
ApJS,151, 299
Houck J. R., et al., 2004,ApJS,154, 18
Howarth I. D., Prinja R. K., 1989,ApJS,69, 527
Kramida A., Ralchenko Y., Reader J., and NIST ASD Team 2015, NIST Atomic Spectra Database (ver. 5.3), [Online]. Available: http://physics.nist.gov/asd [2017, January 16]. National Institute of Standards and Technology, Gaithersburg, MD. Lenorzer A., Mokiem M. R., de Koter A., Puls J., 2004,A&A,
422, 275
Martins F., Marcolino W., Hillier D. J., Donati F., Bouret J.-C., 2015a,A&A,574, A142
Martins F., et al., 2015b,A&A,575, A34
McSwain M. V., Boyajian T. S., Grundstrom E. D., Gies D. R., 2007,ApJ,655, 473
Morris P. W., Eenens P. R. J., Hanson M. M., Conti P. S., Blum R. D., 1996,ApJ,470, 597
Morris P. W., Crowther P. A., Houck J. R., 2004,ApJS,154, 413
Morton D. C., 1967,ApJ,147, 1017
Najarro F., Hanson M. M., Puls J., 2011,A&A,535, A32
Prinja R. K., Howarth I. D., 1986,ApJS,61, 357
Puls J., Markova N., Scuderi S., Stanghellini C., Taranova O. G., Burnley A. W., Howarth I. D., 2006,A&A,454, 625
Repolust T., Puls J., Hanson M. M., Kudritzki R.-P., Mokiem M. R., 2005,A&A,440, 261
Sota A., Ma´ız Apell´aniz J., Morrell N. I., Barb´a R. H., Walborn N. R., Gamen R. C., Arias J. I., Alfaro E. J., 2014,ApJS,
211, 10
Teplitz H., Brinkworth C., 2011, SPICE User’s Guide (ver. 2.3.1), [Online]. Available: http://irsa.ipac.caltech.edu/ [2017, March 17] NASA/IPAC Infrared Science Archive.
Walborn N. R., Panek R. J., 1984,ApJ,280, L27
APPENDIX A: ADDITIONAL DATA
This paper has been typeset from a TEX/LATEX file prepared by
Table A1. Stellar and wind parameters of the sample. Values for additional physical (and chemical) parameters can be found in the quoted references: (1) this work; (2) Martins et al. (2015a); (3) Martins et al. (2015b); (4) Bouret et al. (2012). The uncertainty for Tef f
is about ±2000K, log g is ±0.1, v∞is about ∼ 200 km s−1, and ˙M is ∼ 0.4 dex.
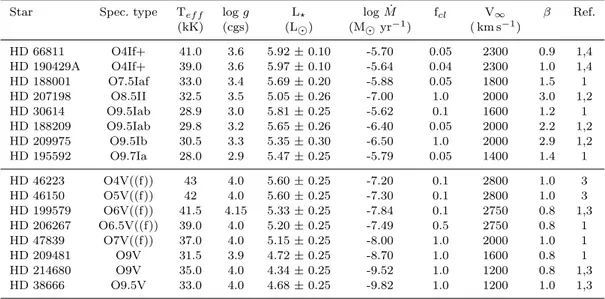
Star Spec. type Tef f log g L? log ˙M fcl V∞ β Ref.
(kK) (cgs) (L ) (M yr−1) ( km s−1) HD 66811 O4If+ 41.0 3.6 5.92 ± 0.10 -5.70 0.05 2300 0.9 1,4 HD 190429A O4If+ 39.0 3.6 5.97 ± 0.10 -5.64 0.04 2300 1.0 1,4 HD 188001 O7.5Iaf 33.0 3.4 5.69 ± 0.20 -5.88 0.05 1800 1.5 1 HD 207198 O8.5II 32.5 3.5 5.05 ± 0.26 -7.00 1.0 2000 3.0 1,2 HD 30614 O9.5Iab 28.9 3.0 5.81 ± 0.25 -5.62 0.1 1600 1.2 1 HD 188209 O9.5Iab 29.8 3.2 5.65 ± 0.26 -6.40 0.05 2000 2.2 1,2 HD 209975 O9.5Ib 30.5 3.3 5.35 ± 0.30 -6.50 1.0 2000 2.9 1,2 HD 195592 O9.7Ia 28.0 2.9 5.47 ± 0.25 -5.79 0.05 1400 1.4 1 HD 46223 O4V((f)) 43 4.0 5.60 ± 0.25 -7.20 0.1 2800 1.0 3 HD 46150 O5V((f)) 42 4.0 5.60 ± 0.25 -7.30 0.1 2800 1.0 3 HD 199579 O6V((f)) 41.5 4.15 5.33 ± 0.25 -7.84 0.1 2750 0.8 1,3 HD 206267 O6.5V((f)) 39.0 4.0 5.20 ± 0.25 -7.49 0.5 2750 0.8 1 HD 47839 O7V((f)) 37.0 4.0 5.15 ± 0.25 -8.00 1.0 2000 1.0 1 HD 209481 O9V 31.5 3.9 4.72 ± 0.25 -8.70 1.0 1600 0.8 1 HD 214680 O9V 35.0 4.0 4.34 ± 0.25 -9.52 1.0 1200 0.8 1,3 HD 38666 O9.5V 33.0 4.0 4.68 ± 0.25 -9.82 1.0 1200 1.0 1,3
Table A2. Line identifications and equivalent width measurements of the mid-IR features of the O supergiants. Star Observed λ(µm) Identification Rest Wavelength λ(µm) Wλ(µm · 10−2)
HD 66811 (ζ Pup) 10.51 H I + He II 10.50 + 10.47 0.59 ± 0.01 11.32 H I + He II 11.31 + 11.33 1.28 ± 0.04 12.38 H I + He II 12.37 + 12.38 4.50 ± 0.07 13.13 He II 13.13 2.33 ± 0.04 13.88 He II 13.87 0.52 ± 0.04 15.46 He II 15.47 -16.22 H I 16.21 1.94 ± 0.03 16.78 He II 16.77 0.45 ± 0.03 16.88 H I 16.88 1.26 ± 0.09 17.27 He II 17.26 2.82 ± 0.07 19.07 H I + He II 19.06 + 19.05 6.30 ± 0.04 22.18 He II 22.17 3.44 ± 0.10 22.35 H I 22.33 3.15 ± 0.12 27.82 + 27.97 H I + He II 27.80 + 27.95 12.28 ± 0.11 29.84 H I 29.84 3.50 ± 0.50 HD 190429A 10.51 H I + He II 10.50 + 10.47 -11.32 H I + He II 11.31 + 11.33 1.99 ± 0.12 12.38 H I + He II 12.37 + 12.38 4.63 ± 0.07 13.13 He II 13.13 2.14 ± 0.03 13.88 He II 13.87 0.57 ± 0.02 15.46 He II 15.47 -16.22 H I 16.21 1.27 ± 0.03 16.88 He II + H I 16.77 + 16.88 1.51 ± 0.03 17.28 He II 17.26 3.02 ± 0.03 19.08 H I + He II 19.06 + 19.05 4.65 ± 0.16 22.19 He II 22.17 2.73 ± 0.04 22.33 H I 22.33 1.89 ± 0.23 27.82 H I + He II 27.80 + 27.95 8.62 ± 0.13 29.84 H I 29.84 -HD 188001 10.51 H I + He I 10.50 -11.32 H I + He I 11.31 + 11.30 1.05 ± 0.02 12.38 H I + He I 12.37 + 12.39 4.55 ± 0.01 16.22 H I + He I 16.21 + 16.20 2.38 ± 0.04 16.88 H I + He I 16.88 1.10 ± 0.20 19.07 H I + He I 19.06 + 19.05 7.82 ± 0.03 22.35 H I + He I 22.33 + 22.32 3.88 ± 0.07 27.81 H I + He I 27.80 + 27.79 7.40 ± 0.20 29.84 H I 29.84 5.00 ± 0.30 HD 207198 11.32 H I 11.31 0.14 ± 0.01 12.38 H I + He I 12.37 + 12.39 0.81 ± 0.02 17.27 He II 17.26 0.46 ± 0.01 19.07 H I + He I 19.06 + 19.05 1.49 ± 0.10 22.19 He II 22.17 -22.35 H I + He I 22.33 + 22.32 1.29 ± 0.04 27.82 H I + He I 27.80 + 27.79 0.65 ± 0.18
Table A2 – continued
Star Observed λ(µm) Identification Rest Wavelength λ(µm) Wλ(µm · 10−2)
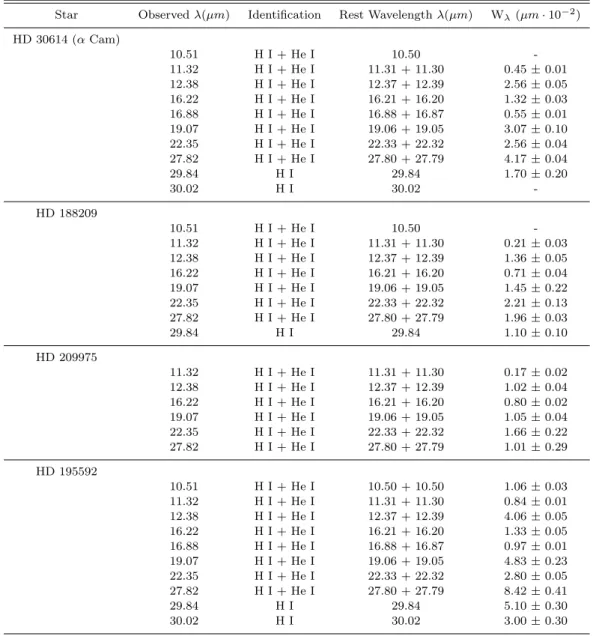
HD 30614 (α Cam) 10.51 H I + He I 10.50 -11.32 H I + He I 11.31 + 11.30 0.45 ± 0.01 12.38 H I + He I 12.37 + 12.39 2.56 ± 0.05 16.22 H I + He I 16.21 + 16.20 1.32 ± 0.03 16.88 H I + He I 16.88 + 16.87 0.55 ± 0.01 19.07 H I + He I 19.06 + 19.05 3.07 ± 0.10 22.35 H I + He I 22.33 + 22.32 2.56 ± 0.04 27.82 H I + He I 27.80 + 27.79 4.17 ± 0.04 29.84 H I 29.84 1.70 ± 0.20 30.02 H I 30.02 -HD 188209 10.51 H I + He I 10.50 -11.32 H I + He I 11.31 + 11.30 0.21 ± 0.03 12.38 H I + He I 12.37 + 12.39 1.36 ± 0.05 16.22 H I + He I 16.21 + 16.20 0.71 ± 0.04 19.07 H I + He I 19.06 + 19.05 1.45 ± 0.22 22.35 H I + He I 22.33 + 22.32 2.21 ± 0.13 27.82 H I + He I 27.80 + 27.79 1.96 ± 0.03 29.84 H I 29.84 1.10 ± 0.10 HD 209975 11.32 H I + He I 11.31 + 11.30 0.17 ± 0.02 12.38 H I + He I 12.37 + 12.39 1.02 ± 0.04 16.22 H I + He I 16.21 + 16.20 0.80 ± 0.02 19.07 H I + He I 19.06 + 19.05 1.05 ± 0.04 22.35 H I + He I 22.33 + 22.32 1.66 ± 0.22 27.82 H I + He I 27.80 + 27.79 1.01 ± 0.29 HD 195592 10.51 H I + He I 10.50 + 10.50 1.06 ± 0.03 11.32 H I + He I 11.31 + 11.30 0.84 ± 0.01 12.38 H I + He I 12.37 + 12.39 4.06 ± 0.05 16.22 H I + He I 16.21 + 16.20 1.33 ± 0.05 16.88 H I + He I 16.88 + 16.87 0.97 ± 0.01 19.07 H I + He I 19.06 + 19.05 4.83 ± 0.23 22.35 H I + He I 22.33 + 22.32 2.80 ± 0.05 27.82 H I + He I 27.80 + 27.79 8.42 ± 0.41 29.84 H I 29.84 5.10 ± 0.30 30.02 H I 30.02 3.00 ± 0.30
Figure A2. Sensitivity of mid-IR lines to mass-loss rate changes (wavelength given in µm). The chosen star is ζ Puppis. Selected UV lines and Hα are also shown (wavelengths in ˚A). The rates displayed are: 7.0 × 10⁻⁷M yr−1(blue dashed-dotted line), 1.9 × 10⁻⁶M yr−1(final model; red solid line), and 6.0 × 10⁻⁶M yr−1 (blue dotted line). A unique model spectrum with the same mass-loss rate matches the mid-IR, optical and UV observations (black).
Figure A3. The mid-IR Spitzer spectra of the dwarfs of our sample (black lines). For comparison, the bottom panel show the observed and synthetic spectra of ζ Puppis. From bottom to top we have early to late spectral types. Synthetic CMFGEN spectra are displayed in red. They support the conclusion that the mid-IR spectrum of O dwarfs does not contain conspicuous atmospheric features.