HAL Id: hal-01302680
https://hal.archives-ouvertes.fr/hal-01302680
Submitted on 14 Apr 2016
HAL is a multi-disciplinary open access
archive for the deposit and dissemination of
sci-entific research documents, whether they are
pub-lished or not. The documents may come from
teaching and research institutions in France or
abroad, or from public or private research centers.
L’archive ouverte pluridisciplinaire HAL, est
destinée au dépôt et à la diffusion de documents
scientifiques de niveau recherche, publiés ou non,
émanant des établissements d’enseignement et de
recherche français ou étrangers, des laboratoires
publics ou privés.
Empirical Mode Decomposition for Noninvasive Atrial
Fibrillation Dominant Frequency Estimation
Antonio Hidalgo-Muñoz, Ana Maria Tome, Vicente Zarzoso
To cite this version:
Antonio Hidalgo-Muñoz, Ana Maria Tome, Vicente Zarzoso. Empirical Mode Decomposition for
Non-invasive Atrial Fibrillation Dominant Frequency Estimation. 23rd European Signal Processing
Con-ference (EUSIPCO-2015), Aug 2015, Nice, France. pp.2581-2585, �10.1109/EUSIPCO.2015.7362851�.
�hal-01302680�
EMPIRICAL MODE DECOMPOSITION FOR NONINVASIVE ATRIAL
FIBRILLATION DOMINANT FREQUENCY ESTIMATION
Antonio R. Hidalgo-Muñoz
1, Ana M. Tomé
2and Vicente Zarzoso
1 1I3S Laboratory, University of Nice Sophia Antipolis, CNRS, France
2
DETI/ IEETA, University of Aveiro, Portugal
ABSTRACT
The dominant frequency (DF) of the atrial activity signal is arguably one of the most relevant features characteriz-ing atrial fibrillation (AF), the most common cardiac ar-rhythmia. Its accurate estimation from noninvasive acqui-sition modalities such as the electrocardiogram (ECG) can avoid risks of potential complications to patients in a cost-effective manner. However, the approximation of the underlying intracardiac atrial activity by noninvasive techniques such as average beat subtraction or blind source separation has not always been satisfactory. In the present work, a new approach based on the ensemble empirical mode decomposition (EEMD) is proposed for AF DF estimation. Our results suggest that EEMD pro-vides more accurate estimates of intracardiac AF DF than alternative noninvasive methods. In addition, the empiri-cal nature of EEMD overcomes important drawbacks of other techniques, simplifying its implementation in auto-matic tools for diagnosis aid.
Index Terms— Atrial fibrillation, dominant
frequen-cy, electrocardiogram, empirical mode decomposition
1. INTRODUCTION
Atrial fibrillation (AF) is the most common sustained arrhythmia encountered in clinical practice, particularly in elderly people [9]. This cardiac disease consists in disor-ganized electrical wavefronts propagating across the atria, triggered by ectopic foci around the pulmonary veins, preventing a good synchronization between atrial pump-ing and ventricular activity. This dysfunction is reflected in the surface electrocardiogram (ECG) in the form of quasi-periodic sawtooth-like fibrillatory waves (f-waves), usually in the range of 3 to 9 Hz, instead of the P-wave preceding the QRST complex in normal sinus rhythm [9].
The estimation of the AF dominant frequency (DF) from the standard surface ECG remains a challenging problem, and it requires a preprocessing step typically based on average beat subtraction (ABS) [1] or blind source separation (BSS) [14] to cancel out the QRST
A. R. Hidalgo-Muñoz is partially funded by the University of Nice Sophia Antipolis. V. Zarzoso is a member of the Institut Universitaire de France.
complex of ventricular activity. Several approaches aim at computing the AF DF from different standpoints to check the correlation between the surface manifestation of AF and intracardiac measurements [4, 7], but correlation results are perfectible. While modern computer aided diagnosis systems require efficient and simple tools to tackle the intrinsic variability of biomedical signals, few research works have actually managed to cope with the unavoidable difficulties of automatic AF DF computation. The present study applies the ensemble empirical mode decomposition (EEMD) [13] to noninvasively ex-tract atrial spectral information in patients suffering from AF. This technique is a noise-assisted variant of the pirical mode decomposition (EMD) [8], which uses em-pirical knowledge of oscillations intrinsic to a time series in order to represent them as a superposition of compo-nents with well-defined instantaneous frequencies. These approaches hint at promising signal processing techniques to deal with problems of a multi-scale nature as in cardio-vascular electrophysiology based applications. Unlike other traditional decompositions such as the Fourier trans-form, the EMD is a data-driven technique that reflects in a natural way the characteristics of the signals under study without requiring a predetermined basis system, letting frequency as well as amplitude vary over time [8, 13].
EMD has been applied to analyze ECG signals for dif-ferent purposes. Some applications of this technique main-ly concern the artifact rejection stage of ECG prepro-cessing, either to eliminate high frequency noise artifacts or to reduce the low frequency contribution due to respira-tion [3]. EMD has also been employed as a feature extrac-tion method to detect ventricular fibrillaextrac-tion [2]. A similar approach is carried out in [12] directly for QRS complex detection. Furthermore, an EMD block to extract spectral features from ECG has been included in a predictive mod-el for determining paroxysmal AF termination [10]. How-ever, the obtained surface DF estimates are not linked to intracardiac values in that study. On the other hand, the ensemble version currently begins to arouse interest for ECG analysis. For instance, EEMD is applied on ECG identification in [15].
This work analyzes the ability of EEMD to estimate the intracardiac AF DF from the surface ECG. The tech-nique is compared to alternative methodologies for atrial activity analysis, such as ABS for QRST complex cancel-lation [1] and BSS based on independent component anal-ysis (ICA) [14].
2. DATABASE 2.1. Study population
Sixty-one consecutive patients (51 male, 61.5±10.6 years) having persistent and long-lasting persistent AF [9] (AF history=62.3±56.3 months, current AF episode=7.14±11.1 months) were included in the study. All patients were treated at the Cardiology Department of Princess Grace Hospital, Monaco. The study was approved by the Institu-tional Committee on Human Research. According to insti-tutional guidelines, all patients gave written informed consent.
2.2. Signal acquisition
One minute standard 12-lead ECG was acquired at a sam-pling rate of 977 Hz (Prucka Engineering, Inc., Houston, TX, USA). ECG signals were filtered by a 4th-order zero-phase bandpass type-II Chebyshev filter with a lower cutoff frequency of 0.5 Hz and an upper cutoff frequency of 40 Hz to remove baseline wander, power line and myo-electric interference as well as high frequency artifacts.
Simultaneously to the ECG, an atrial electrogram (EGM) was also acquired for each patient by placing a bipolar catheter within the left atrial appendage (left atrial diameter=47.4±6.92 mm).
3. SIGNAL PROCESSING
3.1. Ensemble empirical mode decomposition
The basic EMD is a heuristic unsupervised data decompo-sition technique, with no need for a priori defined basis system. This technique adaptively and locally decomposes any nonstationary time series as a sum of intrinsic mode functions (IMF), representing zero-mean amplitude and frequency modulated components [8]. Perfect reconstruc-tion is assured by superimposing all extracted IMFs to-gether with the residual trend. The empirical nature of EMD offers the advantage over other signal decomposi-tion techniques of not being constrained by condidecomposi-tions that often can only be roughly assumed, especially in biologi-cal signals.
According to EMD, the original signal 𝑥 𝑡 can be ex-pressed as
𝑥 𝑡 = 𝑐(!)(𝑡)
!
!!!
+ 𝑟 𝑡 (1)
where 𝑐(!) 𝑡 represents the 𝑗th IMF and 𝑟 𝑡 the
remain-ing residual trend.
During sifting, mode mixing as well as boundary arti-facts can be avoided by a variant called ensemble EMD (EEMD) [13]. This is a noise-assisted data analysis meth-od consisting in adding white noise of finite amplitude to the raw data, and then applying the EMD algorithm. This procedure is repeated several times, and each IMF is final-ly calculated as an ensemble average of the corresponding
IMFs obtained over the noise realizations. With a growing ensemble number, the resultant IMF is expected to con-verge to the most accurate IMF. However, the ensemble factor will depend on the application goal and the most relevant frequency range under study. The added noise is treated as random noise that appears in the measurement. In this way, the EMD of the nth noisy observation will be
𝑥! 𝑡 = 𝑥 𝑡 + 𝜖! 𝑡 = 𝑐!(!) 𝑡
!
!!!
+ 𝑟! 𝑡 (2)
where 𝑥 𝑡 is the original signal (in our case, the ECG signal), 𝜖! 𝑡 is the nth random noise realization and 𝑐!(!) represents the jth IMF obtained for the nth noisy observa-tion. Thus, the resultant IMF 𝑐(!) is computed by
averag-ing the ensemble 𝑐!(!), 𝑛 = 1, 2, … , 𝐸.
Therefore, EEMD requires setting two parameters, be-sides 𝐽, namely the ensemble size E and a proper standard deviation 𝜎!"#$% = 𝛾𝜎!"#$%& of additive Gaussian noise,
where 𝜎!"#!"# denotes the standard deviation of the origi-nal sigorigi-nal amplitude distribution. Usually, both parameters are chosen empirically [13].
In this study, E = {5, 10, 15} and 𝛾 = {0.05, 0.1, 0.2} were tested. These are usual values found in the literature [15]. All 10 s signal segments recorded in lead V1 were decomposed into 𝐽 = 8 IMFs, a number high enough to cover the spectral range of interest.
3.2. Adaptive singular value cancellation
Adaptive singular value cancellation (ASVC) belongs to the family of ABS-based methods for cancelling ventricu-lar activity from ECG signals to keep only the atrial ac-tivity [1]. The use of this particular technique is justified by the high degree of temporal redundancy present in the ECG.
Firstly, the algorithm detects the R-peaks and both the starting and ending points of every QRST complex. Then, all the QRST complexes are aligned on their R-peak loca-tions and their eigenvector sequence is computed by means of singular value decomposition (SVD). In this way, the most representative ventricular activity can be obtained by the highest variance according to the eigen-values and used as the cancelling template. Next, this template is adapted to the width and amplitude of every QRST occurrence, and temporally re-aligned with the R-peaks. Finally, each customized template is subtracted from its corresponding QRST complex. Thus, the atrial activity is preserved in these segments, where it was masked by the ventricular activity contribution.
This SVD–based algorithm provides a more accurate ventricular activity representation, better adapted to each individual QRST complex, than traditional ABS ap-proaches, and a more reliable atrial activity extraction is consequently expected. This methodology has been wide-ly used in the AF framework for f-wave anawide-lysis [1].
In this work, the ASVC-based analysis was applied on 20 s segments from lead V1, so that the number of beats
was sufficiently high to guarantee an accurate algorithm performance [1].
3.3. RobustICA-f
Another approach to noninvasive atrial activity extraction exploits the spatial diversity of the multi-lead ECG by means of BSS based on ICA. In this study, we employ the RobustICA-f algorithm proposed in [14], since it has been shown to compare favorably to other atrial signal extrac-tion techniques [6]. RobustICA-f searches for direcextrac-tions of maximum independence within the space of data by relying on higher order statistics (kurtosis). By working in the frequency domain, this method simultaneously ex-ploits the statistical independence between atrial and ven-tricular components and the narrowband character of the atrial activity signal.
In this study we applied RobustICA-f to 20 s segments of the 12-lead ECG. Out of the independent sources esti-mated by the algorithm, the one with the highest spectral concentration and DF in the range of 3 to 9 Hz was select-ed as the atrial source [14]. However, an accurate source selection required visual confirmation, since the above automatic criteria sometimes led to residual ventricular activity (T-wave components) overlapping in the frequen-cy range of interest.
3.4. AF DF estimation
The surface AF DF was determined as the maximal peak frequency of Welch’s power spectral density after apply-ing one of the different noninvasive methods for atrial signal extraction described in the previous section.
Concerning invasive recordings, 20 s segments were preprocessed following the method proposed by Botteron and Smith [5] to overcome the drawbacks brought by the
sharp biphasic morphology of the atrial depolarization waves in bipolar EGMs, which makes Fourier analysis unsuitable for representing the depolarization rate of the atrial tissue. After this preprocessing step, the intracardiac AF DF was also determined as the maximal peak frequen-cy of Welch’s power spectral density.
4. RESULTS 4.1. Intrinsic mode function DF
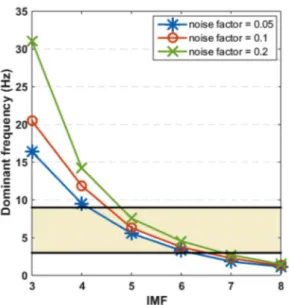
To determine which IMFs present DF values belonging to the typical AF frequency range (between 3 and 9 Hz) [9], EEMDs were performed in lead V1 of every patient for different values of the noise factor 𝛾. For a given value of 𝛾, the DF of each IMF was averaged over the AF patient database. Results are depicted in Fig. 1. IMFs 1 and 2 are omitted from this plot as they correspond to noisy artifacts, whose frequency content has most probably no biological meaning. Results by EMD are also discarded due to its sensitivity to spurious artifacts.
According to the range of interest, IMFs number 5 and 6 are the modes that may represent the fibrillatory activity for any of the noise factors tested. However, 𝛾 = 0.1 was the selected value for subsequent analysis, since it yields the closest estimate of the mean intracardiac frequency in the case of IMF 5. Interestingly this noise factor value is also typically used in research works dealing with EEMD [15].
Table 1 shows the DF values as a function of the ensemble factor E. There are no relevant differences in the measurements for different ensemble factors. Hence, to reduce computational cost and simplify the interpretation, only the case with E = 5 and 𝛾 = 0.1 is considered in the sequel.
E IMF 4 (Hz) IMF 5 (Hz) IMF 6 (Hz)
5 11.89 6.30 3.76
10 11.57 6.52 3.86
15 12.05 6.40 3.78
Table 1. Average DF values in lead V1 obtained for different values of the ensemble size E over the AF patient database, with
noise factor γ = 0.1.
4.2. Accuracy of ECG AF DF estimates
Table 2 compiles the basic statistics of DF values comput-ed by the different methods considercomput-ed in this work, in-cluding the benchmark values from intracardiac EGM. To evaluate the accuracy of the approximation, the difference between surface ECG and intracardiac EGM AF DF esti-mations was computed. Table 3 shows the mean differ-ence between DF value obtained by the three noninvasive approaches explained in Sec. 2 and the intracardiac DF value. Note that there is not statistically significant differ-ence between the intracardiac DF values and the DF from IMF 5 after decomposition by means of EEMD. IMF 5 also presents the most favorable CI in the sense that zero is included within its range, whereas the rest of techniques Fig. 1. Mean DF values for several IMFs computed in lead
V1 over the AF patient database for different noise factors γ, with ensemble sizeE = 5. The horizontal solid
have a tendency to underestimate the EGM measures (negative mean difference and CI). Hence, IMF 5 approx-imates most accurately the intracardiac DF values among the noninvasive approaches considered.
AF DF measurement Mean (Hz) Std. Deviation
Intracardiac 6.12 0.92
RobustICA-f 5.41 1.34
ASVC 5.65 0.93
EEMD (IMF 5) 6.30 1.30
EEMD (IMF 6) 3.76 0.97
Table 2. DF mean and standard deviation values by different computation methods over the AF patient database. Ensemble size E = 5 and noise factor γ = 0.1 were used in the EEMD.
Method Difference (Hz) Difference CI (95%) Sig. RobustICA-f –0.72 [–1.04, –0.40] <0.001 ASVC –0.47 [–0.74, –0.21] 0.001 EEMD (IMF 5) 0.19 [–0.17, 0.55] 0.291 EEMD (IMF 6) –2.36 [–2.70, –2.01] <0.001 Table 3. Mean differences and confidence intervals (CI) when comparing the intracardiac DF with the surface DF estimated by
the methods of Table 2. Sig.: significance value after applying paired t-tests over the AF patient database to contrast
intracardiac and noninvasively estimated DF values. To check if there exist relevant spatial variations across the different lead locations for the EEMD method, Table 4 shows the accuracy values in terms of mean dif-ference and CI for every lead. Of note that lead V1 pre-sents the lowest difference that is not statistically different from zero.
Figure 2 shows an example of a raw ECG signal from an AF patient from our database and Fig. 3 shows the resultant IMF 5 from the same patient, whose DF estima-tion by means of EEMD was exact in comparison to the intracardiac DF value (5.10 Hz). ECG lead Difference (Hz) Difference CI (95%) Sig. I 1.17 [0.70, 1.65] <0.001 II 0.42 [0.01, 0.83] 0.044 III 0.66 [0.17, 1.16] 0.009 aVR 0.83 [0.37, 1.29] 0.001 aVL 0.68 [0.21, 1.14] 0.005 aVF 0.82 [0.38, 1.27] <0.001 V1 0.19 [–0.17, 0.55] 0.291 V2 0.82 [0.36, 1.28] <0.001 V3 1.25 [0.84, 1.66] <0.001 V4 1.69 [1.26, 2.12] <0.001 V5 1.63 [1.15, 2.11] <0.001 V6 1.24 [0.79, 1.69] <0.001
Table 4. Mean differences and confidence intervals (CI) when comparing the intracardiac DF with the estimated surface DF by
means of EEMD (IMF 5) for every lead in the standard ECG.
5. DISCUSSION
In any clinical context, protocols to obtain physiological information about internal organs, such as the heart, from noninvasive measurements are highly desirable. In addi-tion, reliable, powerful and easy to handle automatic sig-nal processing techniques are also encouraged. Following this line, EEMD shows interesting advantages over other mathematical approaches to estimate noninvasively spec-tral features of intracardiac signals.
A preliminary analysis concluded that IMF 5 with en-semble factor E = 5 approximates well the AF DF (Fig. 1, Table 1) needing a small number of iterations of the EMD algorithm. Then, we focused on the mean difference and its associated CI between the true DF (considering the intracardiac recordings as benchmark) and the IMF DF. According to the results detailed in Tables 2 and 3, EEMD is the method that best approximates the intracardiac AF DF. This fact is reflected in the mean difference < 0.2 Hz and a short CI around zero, pointing to a narrow error
Fig. 2. A lead V1 signal from our AF ECG database.
Fig. 3. IMF 5 obtained by EEMD with ensemble size E = 5 and noise factor γ = 0.1 on the ECG signal of Fig. 2.
margin with a 95% of significance level, robust against outliers.
Even more relevant, the measurements obtained by means of EEMD show no statistically significant differ-ence between groups, meaning that this technique neither overestimates nor underestimates the DF. Variability around the average DF values in the study population is relatively small (Table 2), but is in agreement with other studies on persistent forms of AF.
Techniques based on BSS for noninvasive atrial activi-ty extraction need several ECG leads (sufficient spatial diversity) [6, 14], whereas EEMD can be applied on sin-gle leads. In addition, selecting the proper source linked to the atrial activity is not trivial. Although some criteria exist for choosing atrial sources (see Sec. 3.3), visual inspection was required in our analysis to check the selec-tion of the most suitable source from RobustICA-f. In-deed, the method failed in 11 out of the 61 cases, due to the presence of several possible atrial sources, thus ham-pering the automatic processing. By contrast, EEMD does not suffer from the scaling and permutation indetermina-cies typical of BSS techniques.
Furthermore, EEMD works properly without requiring QRST cancellation. Therefore, the mathematical complex-ity of the implementation is reduced and shorter time intervals can yield satisfactory performance, as shown in our experiments. Research works dealing with EMD and ECG are concerned with QRST amplitude distortion as a consequence of the decomposition [3, 15]. This is not a crucial issue for AF analysis, since we are just interested in atrial activity while ventricular activity is considered as an artifact. A residual T-wave contribution can be ob-served in Fig. 3, but these waves are modulated by a high-er frequency component that cannot be dhigh-erived from ven-tricular activity and seems to be linked to atrial activity. It should be remarked, however, that our goal is AF DF estimation and not atrial waveform recovery.
Showing the highest accuracy in Table 4, V1 is the lead that best represents the atrial activity and the conse-quent AF DF, in line with previous works pointing to this lead as the most suitable for AF analysis [11].
6. CONCLUSIONS
This work has applied the EMD approach to estimate the intracardiac DF from AF ECGs. The results have been compared to other noninvasive techniques such as BSS (RobustICA-f) and QRST complex cancellation (ASVC). In our AF patient database, EEMD outperforms the other techniques in terms of mean difference between the intra-cardiac AF DF, considered as ground truth, and its nonin-vasive computation from the surface ECG, and thus arises as the most accurate option to implement an automatic and efficient algorithm to extract spectral information for AF analysis. Future works should deepen the study of IMF properties to evaluate other atrial signal features characterizing AF, such as amplitude or spatiotemporal variability. The sample size robustness of EMD should also be assessed.
REFERENCES
[1] R. Alcaraz, and J.J. Rieta, “Adaptive singular value can-celation of ventricular activity in single-lead atrial fibrilla-tion electrocardiogram,” Physiological Measurement, vol. 29, no. 12, pp. 1351-1369, 2008.
[2] M.A. Arafat, J. Sieed, and K. Hasan, “Detection of ventric-ular fibrillation using empirical mode decomposition and Bayes decision theory,” Computers in Biology and Medi-cine, vol. 39, pp. 1051-1057, 2009.
[3] M. Blasco-Velasco, B. Weng, and K.E. Barner, “ECG signal denoising and baseline wander correction based on the empirical mode decomposition,” Computers in Biology and Medicine, vol. 38, pp. 1-13, 2008.
[4] M. Bojarnejad, J.R. Blake, J. Bourke, E. Shepherd, A. Murray, and P. Langley, “Non-invasive estimation of left atrial dominant frequency in atrial fibrillation from different electrode sites: insight from body surface potential map-ping,” J. Atrial Fibrillation, vol. 7, no. 3, pp. 6-10, 2014. [5] G.W. Botteron, and J.M. Smith, “A technique for
measure-ment of the extent of spatial organization of atrial activation during atrial fibrillation in the intact human heart,” IEEE Transactions on Biomedical Engineering, vol. 42, no. 6, pp. 579-586, 1995.
[6] M. Garibaldi and V. Zarzoso, “Algorithms for atrial signal extraction in atrial fibrillation ECGs: a comparison based on the correlation between endocardial and surface domi-nant frequency,” In: Proc. 7th International Workshop on Biosignal Interpretation, Como, Italy, 2012.
[7] N.W. Hsu, Y.J. Lin, C.T. Tai, et al., “Frequency analysis of the fibrillatory activity from surface ECG lead V1 and in-tracardiac recordings: implications for mapping of AF,” Eu-ropace, vol. 10, no. 4, pp. 438-443, 2008.
[8] N.E. Huang, Z. Shen, S.R. Long, M.C. Wu, H.H. Shih, Q. Zheng, N.C. Yen, C.C. Tung, and H.H. Liu. “The empirical mode decomposition and the Hilbert spectrum for nonlinear and non-stationary time series analysis,” Proc. Royal Socie-ty of London. Series A: Mathematical, Physical and Engi-neering Sciences, vol. 454, no. 1971, pp. 903-995, 1998. [9] C.T., January, L.S. Wann, J.S. Alpert, M.E. Field, H.
Cal-kins, K.T. Murray, J.C. Cleveland et al, “2014 AHA/ACC/HRS guideline for the management of patients with atrial fibrillation: executive summary." J. American College Cardiol., vol. 64, no. 21, pp. 2246-2280, 2014. [10] M. Mohebbi, and H. Ghassemian, “Predicting termination
of paroxysmal atrial fibrillation using empirical mode de-composition of the atrial activity and statistical features of the heart rate variability,” Medical and Biological Engi-neering and Computing, vol. 52, pp. 415-427, 2014. [11] S. Petrutiu, J. Ng, G.M. Nijm, H. Al-Angari, S. Swiryn, and
A.V. Sahakian, “Atrial fibrillation and waveform character-ization,” IEEE Engineering in Medicine and Biology Maga-zine, vol. 25, no. 6, pp. 24-30, 2006.
[12] Z.E.H. Slimane, and A. Naït-Ali, “QRS complex detection using empirical mode decomposition,” Digital Signal Pro-cessing, vol. 20, pp. 1221-1228, 2010.
[13] Z. Wu, and N.E. Huang, “Ensemble empirical mode de-composition: a noise-assisted data analysis method,” Adv. Adaptive Data Analysis, vol. 1, no. 1, pp.1-41, 2009. [14] V. Zarzoso, and P. Comon, “Robust independent
compo-nent analysis by iterative maximization of the kurtosis con-trast with algebraic optimal step size,” IEEE Transactions on Neural Networks, vol. 21, no. 2, pp. 248-261, 2010. [15] Z. Zhao, L. Yang, D. Chen, and Y. Luo, “A human ECG
identification system based on ensemble empirical mode decomposition,” Sensors, vol. 13, no. 5, pp. 6832-6864, 2013.