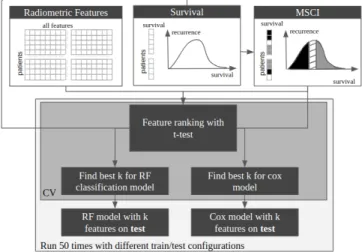
Prediction performance of radiomic features when obtained using an object detection framework
Texte intégral
Figure
Documents relatifs
All versions of ComBat described in sections A, B and C above were applied using the non-parametric version of ComBat, using the labels defined either as the 3 clinical centers
Finally, the Evidential K-NN (EK-NN) rule (Denœux, 1995), a stable classification method based on DST, is used with selected feature subsets to output prediction results.. The rest
L’archive ouverte pluridisciplinaire HAL, est destinée au dépôt et à la diffusion de documents scientifiques de niveau recherche, publiés ou non, émanant des
The advantage of TensorRT using is that this platform is able to accelerate a neural network using an algorithm to simplify the network architecture not changing the
When constructing the dependency graph, we have selected only those dependencies whose composing nodes contains at least one class, which means that the
Indeed, when an object enters (resp leaves) a cell i at time t, and when sensors agree on the same state occupied (resp free), hence, the perception conflict pair (7) will be
L’archive ouverte pluridisciplinaire HAL, est destinée au dépôt et à la diffusion de documents scientifiques de niveau recherche, publiés ou non, émanant des
Detection of signs of Parkinson’s disease using dynamical features via an indirect pointing device.. Rosane Ushirobira, Denis Efimov, Géry Casiez, Laure Fernandez, Fredrik
