C E N T R E D' ÉT U D E S E T D E R E C H E R C H E S S U R L E D E V E L O P P E M E N T I N T E R N A T I O N A L
SÉRIE ÉTUDES ET DOCUMENTS
Volcanic hazards, land and labor
Johanna Choumert
Pascale Phélinas
Études et Documents n° 9
July 2018
To cite this document:
Choumert J., Phélinas P. (2018) “Volcanic hazards, land and labor ”, Études et Documents, n° 9,
CERDI.
CERDI POLE TERTIAIRE 26 AVENUE LÉON BLUM F-63000 CLERMONT FERRAND TEL.+33473177400 FAX +33473177428 http://cerdi.uca.fr/2
The authors
Johanna Choumert
Head of Research - Economic Development Initiatives (EDI) Limited, High Wycombe, United
Kingdom.
Email address:
[email protected]
Pascale Phélinas
Director of Research, IRD-CESSMA and CERDI, University of Clermont Auvergne,
Clermont-Ferrand, France.
Email address:
[email protected]
Corresponding author: Pascale Phélinas
This work was supported by the LABEX IDGM+ (ANR-10-LABX-14-01) within the program “Investissements d’Avenir” operated by the French National Research Agency (ANR).
Études et Documents are available online at: http://www.cerdi.org/ed
Director of Publication: Grégoire Rota-Graziosi
Editor: Catherine Araujo Bonjean
Publisher: Mariannick Cornec
ISSN: 2114 - 7957
Disclaimer:
Études et Documents is a working papers series. Working Papers are not refereed, they constitute
research in progress. Responsibility for the contents and opinions expressed in the working papers rests solely with the authors. Comments and suggestions are welcome and should be addressed to the authors.
3
Abstract
We study the behavior of farmers living under the threat of the Tungurahua Volcano in
Ecuador. Recent eruptions have caused significant damage, including crop loss, death of
livestock, and destruction of dwellings. We collected a unique data set after a major eruption
in 2016. We interviewed 222 farmers in the area affected by the eruption and 260 in a nearby
control zone to understand why they choose to remain in the risky zone despite the existence
of public programs aimed at relocating them to safe zones. We examine land and labor, which
are farmers’ primary productive assets. Firstly, we investigate the capitalization of volcanic
hazards in farmland values and find a negative price premium of 21% compared to the control
zone. Secondly, we explore non-farm labor in response to volcanic risk. Finally, we argue that
repeated ash fall events increase the illiquidity of farm household assets, such as farmland,
and that agricultural human capital is difficult to convert into non-agricultural capital. Our
results convey important information for public policies aimed at supporting adaptation and
resilience of people living under the threat of volcanoes and other natural disasters.
Highlights
- Farm households remain in volcanic areas despite repeated loss of crops and livestock.
- We analyze the case of the Tungurahua Volcano in Ecuador using primary data.
- We investigate the role that productive assets, i.e., land and labor, play in the decision
to remain in the risky zone.
- We show the significance of integrated land and labor policies to address natural
hazards.
Keywords
Ecuador, Volcano, Agriculture, Labor, Natural disasters.
JEL Codes
Q15, D81, Q54.
Acknowledgments
This research has been made possible in part thanks to funding from LABEX CLERVOLC. In
addition, we would like to thank the FERDI (Fondation pour les Etudes et Recherches sur le
Développement International) and the ANR (Agence Nationale de la Recherche, France) for
their financial support through the program ‘‘Investissements d’avenir’’ and the LABEX IDGM+
(ANR-10-LABX-14-01) mechanism. Thanks also to Emily Wilkinson (Overseas Development
Institute) and Teresa Armijos Burneo (University of East Anglia) for useful discussions and to
Olivier Santoni (FERDI) and Jean-Luc Le Pennec (IRD) for their help in the field survey and
control area choice. The usual disclaimers apply.
1. Introduction
As natural disasters increasingly affect the livelihoods of vulnerable populations across the globe, significant research efforts and financial resources are being devoted to risk mitigation, adaptation and resilience policies. Among natural disasters, volcanic activity is classified as a geophysical natural disaster that is “a hazard originating from solid earth”, with four potential outcomes, i.e., ash fall, pyroclastic flow and lahar flow. Between 1900 and 2017 there have been 242 volcanic events worldwide, causing 96,366 deaths and affecting more than 6.6 million people
(Emergency Events Database - EM-DAT1), and causing a wide range of economic, social, and
psychological impacts (Doocy et al., 2013; Glaser, 1996; Wilson et al., 2011). Volcanic disasters also have dramatic impacts on agriculture, as eruptions and ash falls degrade farmland and vegetation and cause severe livestock and crop losses. Nevertheless, in the long-term, ashes can improve agricultural land quality, as they provide nutrients for the soil (Cook et al., 1981; Kelman and Mather, 2008; Wilson et al., 2011), which constitutes an incentive to farm under the threat of volcanoes.
Ecuador is strongly plagued by volcanic hazards. According to the EM-DAT, between 1975 and
2017, Ecuador had 12 episodes of volcanic activity, affecting a total of 1,479,426 people.2 The
Tungurahua, 5,023 m, located in the central Andean region in the Tungurahua province, is the most active volcano in the country. In 1999, after a nearly 80-year period of quiescence, the volcanic activity restarted, from violent explosions with pyroclastic flows and tephra falls to minor eruptions with ash emissions (Le Pennec et al., 2012). These geological hazards have produced large private economic losses as well as severe damage to physical infrastructure, such as road, water systems and electricity, schools, health centers and official buildings, putting a repeated drain on public resources. As a result, disaster management policy has evolved from ad hoc solutions to a long term and nationwide disaster management policy (Solberg et al., 2003). Among the new policy instruments implemented by the Ecuadorian government are the assembling of a community-based network of volunteers known as vigías an early warning system for civil protection and evacuation (Armijos et al., 2017; Stone et al., 2014), public awareness campaigns, and, almost importantly, the construction of houses in resettlement zones. Public authorities hoped that relocating households from exposed areas to safe areas would help mitigate volcanic risk.
However, despite the existence of relocation programs, recent research has stressed that some populations living under the threat of the Tungurahua do not want to be relocated to safe areas (Armijos and Few, 2015). Some families have definitively resettled in safe zones while continuing to cultivate their land on the slopes of the volcano, whereas others have remained at their dwellings in communities affected by ash falls. This phenomenon is not specific to Ecuador and often occurs in other areas of the world threatened by volcanic hazards (Gaillard, 2008; Lavigne et al., 2008; Wilson et al., 2007).
1 Université catholique de Louvain (UCL) - CRED, D. Guha-Sapir - www.emdat.be, Brussels, Belgium 2 “In EM-DAT, this is the sum of those left injured, affected and homeless after a disaster”. “Affected: People
requiring immediate assistance during an emergency situation. The indicator “affected” is often reported and is widely used by different actors to convey the extent, impact, or severity of a disaster in non-spatial terms. The ambiguity in the definitions and the different criteria and methods of estimation produce vastly different numbers, which are rarely comparable” (http://www.emdat.be/guidelines).
The literature has looked into factors that shape the behavior of people who face volcanic hazard, i.e., cultural, social and economic factors and risk perception, which has attracted the widest range of studies. A good overview can be found in the special issue of Journal of Volcanology
and Geothermal Research 2008 (See also Van Manen, 2014; Rodrigez-Vangort, 2015). Cultural
beliefs and social values have been studied by sociologists, anthropologists and geographers (Armijos et al., 2017; Few et al., 2017; Tobin and Whiteford, 2002). Evidence from case studies suggests that populations tend to stay in volcanic areas for the following reasons: lack of knowledge of volcanic hazards, marginal status of populations living in risky zones, volcanoes as a vector of cultural identity (Bachri et al., 2015; Gaillard, 2008). Economic studies usually focus on risk and time preferences (e.g. Bchir and Willinger, 2013; Willinger et al., 2013).
This paper aims to contribute to the literature by investigating the extent to which productive assets, land and labor play a role in a farm household’s decision to remain in the risky zone after an ash fall event. Despite their importance in households’ coping strategies under shocks (Dercon, 1998; Ellis, 1998; Rose, 2001), productive assets have received little attention in the literature on volcanic risk. After repeated ash fall events, a portfolio position in these productive assets becomes at least temporarily irreversible. The land may become hard to trade or lose its value and only be saleable at a discount price. Agricultural human capital and skills have a farm-specific component; knowledge is experientially obtained and may not be easily transferable to other places. In addition, occupational mobility is limited by a worker’s abilities and by geographical mobility constraints. Farmers are, thus, effectively trapped in a portfolio they cannot exit. Meanwhile, land remains a strategic asset that provides the basis for rural livelihoods while labor skills match the needs required by agricultural tasks. This leaves little option other than to “rationally choose” to live with volcanic risk.
To address the research question, we conducted a field survey allowing us to collect detailed information on the livelihoods of farmers in volcanic areas of Ecuador. However, the relevance of our analysis goes beyond the specific context of Tungurahua and applies to a wide range of natural hazards. Our results also convey important information for public policies aimed at supporting adaptation and resilience of people living under the threat of natural disasters.
The rest of the paper is organized as follows. Section 2 discusses the literature on coping responses of farm households under shocks. Section 3 provides information on the study area. Section 4 explores the land and labor characteristics that can shed light on why farm households stay in the risky zone despite volcanic threat and policy that explicitly encourage migration out of this area, and Section 5 concludes with some policy recommendations.
2. Coping responses of farm housholds under shocks
Farm households are an emblematic case of the dilemmas faced by populations living under the threat of volcanoes: on the one hand, ash falls often destroy (or decrease) their productive capital, i.e. land and labor; and on the other hand, volcanic activity can increase farmland quality in the long run. The economic literature on consumption smoothing, asset accumulation and coping strategies of farm households under shocks is prolific (Carter and Barrett, 2006; Dercon, 1998; Ellis, 1998; Hoddinott, 2006; Kochar, 1999; Reardon and Vosti, 1995; Rose, 2001; Rosenzweig and Wolpin, 1993; Rosenzweig and Binswanger, 1993; Zimmerman and Carter, 2003). It lays down the foundations on the behavior of farm households’ in terms of consumption, production and risk-response strategies, with a focus on their accumulation and use of productive and non-productive assets and on labor allocation decisions between farm and non-farm labor.
Farm households put in place various self-insurance strategies to cope with risks to their livelihoods (Corbett, 1988). The imperfection or inexistence of credit and insurance markets affect household decision-making (Rosenzweig and Wolpin, 1993). Income shocks can lead farm households to decrease their consumption, health and education expenses, which has an impact on their long-term welfare through lower nutrition, human capital and long term consumption (Carter and Barrett, 2006; Corbett, 1988; Jensen, 2000). Savings may also be used to smooth consumption (Udry, 1995). Likewise, management of assets is central, such as livestock used as buffer stock against income shocks (Fafchamps et al., 1998; Rosenzweig and Wolpin, 1993). Households also carry out trade-offs between productive and non-productive assets, as well as between liquid assets and illiquid asset accumulation (Dercon, 1998). Household members may also supply labor to the non-farm labor market in order to cope with risk in farm production (Fafchamps, 1993; Kochar, 1999; Rose, 2001).
Response patterns to shocks will also depend on farmers’ risk preferences.3 Risk-neutral
farmers will likely devote more time to activities that provide a higher expected marginal return (Mishra and Goodwin, 1997) while risk-averse farmers will tend to allocate fewer labor resources to a risky activity (i.e., farming in the risky zone) and devote more resources to labor in safe zones (non-farm).
Individual behaviors in the presence of natural hazards must thus be approached in the light of the concepts of vulnerability, resilience and risk assessment. There are various types of household vulnerability: vulnerability to the risk of not being able to meet basic needs, such as access to food, housing and health services; vulnerability to the risk of falling into poverty (non-poor households who experience a shock and fall into poverty); and for already (non-poor households vulnerability of becoming caught in a poverty trap (i.e. chronic poverty) with limited resilience. Whatever the type of vulnerability, these coping strategies overlap in three ways: the degree of risk (probability) for a household to be exposed to a volcanic shock; the magnitude of the shock; and the household's ability to respond to these shocks and return to its initial position (resilience). A household’s level of resilience depends largely on its asset endowments and the liquidity of these assets.
3 See Binswanger (1980), Brunette et al. (2015), and Holt and Laury (2002) for discussions on farmers’ risk
3. Presentation of the study area and sample
3.1.
Study area
The Tungurahua is one of the Ecuadorian volcanoes that entered an eruptive phase in 1999 (after nearly a century-long quiet period). Major eruptions occurred in 2006, 2008 and 2010 but ongoing volcanic activity has been observed since 1999. More than 30,000 people live under the direct threat of the Tungurahua, and more than 200,000 live under the threat of sporadic ash falls (Armijos and Few, 2015). The primary economic damage and losses associated with Tungurahua eruptions, even minor, result from ash and tephra falls that destroy crops and natural pastures, impact the roofs and glazes of houses, kill livestock, cause respiratory diseases for both humans and animals. Since most people in the affected communities are heavily dependent on agriculture for their livelihood, eruptions translate into significant income loss, food vulnerability, and for the poorest, enormous difficulties to recover. Resilience to volcanic activity is thus key for the affected populations.
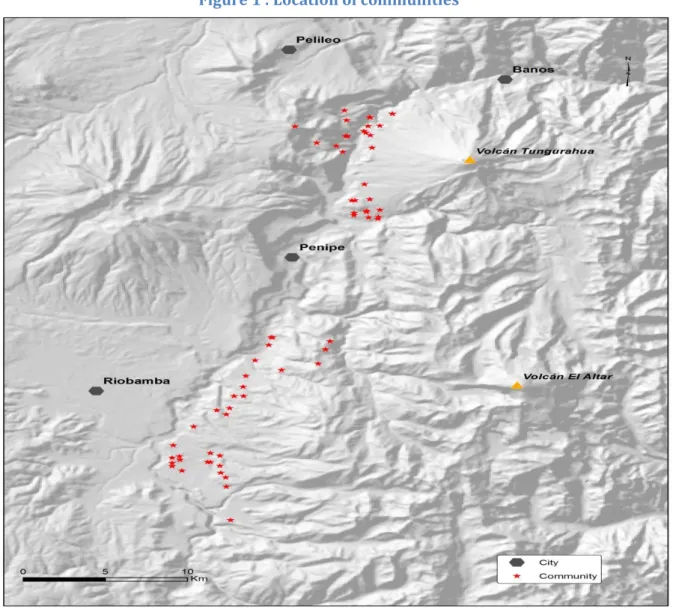
Our sample of households is located in three provinces of Ecuador, Tungurahua and Chimborazo, which surround the Tungurahua volcano for the affected zone and Morona Santiago for the control zone. The affected area was chosen using the map of eruptive deposits (see figure 1). The choice of the control zone was based on the similarity in agro-climatic conditions, using several sources of data capturing topography, climate and other geographical characteristics including altitude, slope, theoretical sunning, azimuth and distance from the village center to the
nearest main road.4 We began with the calculation of the mean value of each criterion for the two
villages Puela and Bilbao,5 within a one-kilometer radius. For each criterion, we designated a band
with limits defined by the average +/- one standard deviation. We searched for similar zones throughout the country so that the average of each criterion in a circle of one kilometer falls into the band defined for the affected zone. Among all the possible areas that emerged from this exercise, we chose those zones which were the closest to the affected area, i.e., the parish Quimiag located in the province of Morona Santiago.
We conducted a quantitative survey in both zones in August 2016, .four months after the eruption of March 2016. A total of 489 farm households were randomly selected by random walk. 222 who farm land in the risky zone (111 were living in the risky zone and 111 were living in a
resettlement zone) and 260 who farm land in the control zone.6 Data were collected from
household heads. The objective was to establish a snapshot of inhabitants’ responses to volcanic activity. Many issues, such as risk exposure and perception, risk coping, agricultural land values, and residential location choice were addressed. We collected a large amount of plot-specific 4 Theoretical sunning is calculated as a function of the orientation of the slopes. The azimuth is the angle
between the direction of a place and the geographic North. The source of the altitude data is the Shuttle Radar Topography Mission (SRTM) with an accuracy of 90m in Jarvis et al. (2008) International Centre for Tropical Agriculture (CIAT), available from http://srtm.csi.cgiar.org. The slope, azimuth and the theoretical sunshine are derived from the altitude and calculated with ArcGIS10 (Spatial Analyst module). The main roads are extracted from the Open Street Map database: http://www.openstreetmap.org.
5 The values are: slope: 9.72 – 25.66 %; altitude: 2396 - 2845 m; sunning: 1 738 857 - 1 794 563 W.m-2.s ;
azimuth: 121 - 274 ° ; distance to main road: 6573 - 12859 m.
6 The target population has been defined as farm households, i.e., households that operate a holding
regardless of the residential choice. According to the 2010 Census, a total of 854 households, including 2,670 members, were living in the three parishes located in the most affected zone. In the parish of the control zone, the census indicates 1,480 households and 5,257 individuals.
information on soil quality, slope, location and accessibility, as well as on agricultural use. Finally, we collected socio-demographic characteristics of household members, as well as their employment status.
Figure 1 : Location of communities
3.2.
Household socio-economic characteristics
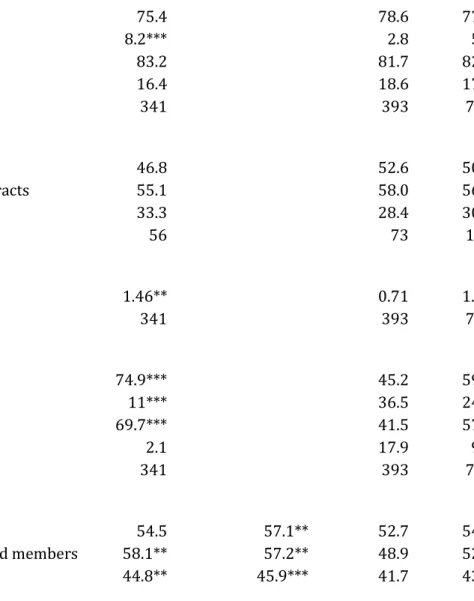
Land is the most important key asset in agriculture. Table 1 gives some information about land tenure, land size and type of activity. Most respondents in both the risky and control zones, own farmland: 75.4% and 78.6%, respectively, of the plots for which we have characteristics are owned by farmers that belong to our sample. As a result, the renting of land is not extensive: 16.4% of plots in the risky zone and 18.5% in the control zone. Contractual arrangements are divided into equal parts for cash rent and sharecropping. Land is often rented on a short-term basis. Approximately 50% of contracts last less than one year. However, nearly one third of contracts have an indefinite term. Formal property rights have been secured through titling for the vast majority of parcels (83%).
Table 1. Household socio-demographic characteristics
Description Risky zone Resettlement zone Control zone All sample
Tenure
Percentage of owned plots 75.4 78.6 77.1
Percentage of usufruct plots 8.2*** 2.8 5.3
Percentage of plots with formal property rights 83.2 81.7 82.4
Percentage of rented plots 16.4 18.6 17.6
N= total number of plots 341 393 734
Contractual arrangements
Percentage of rented plots under cash rent 46.8 52.6 50.0
Percentage of rented plots under short term contracts 55.1 58.0 56.6
Percentage of rented plots with indefinite term 33.3 28.4 30.8
N= total number of rented plots 56 73 129
Landholding size
Mean holding size (ha) 1.46** 0.71 1.06
N= total number of plots 341 393 734
Plot activity
Percentage of plots allocated to agriculture 74.9*** 45.2 59.0
Percentage of plots allocated to livestock 11*** 36.5 24.7
Percentage of plots allocated to maize cultivation 69.7*** 41.5 57.0
Percentage of plots allocated to potato cultivation 2.1 17.9 9.1
N= total number of plots 341 393 734
Labor
Average age of household head 54.5 57.1** 52.7 54.1
Percentage of working men among total household members 58.1** 57.2** 48.9 52.6
Education level of household working members
Percentage of working members without education 6.5*** 5.6*** 10.6 8.7
Percentage of working members with primary education 64.9*** 65.1*** 48.9 55.8
Percentage of working members with secondary education 22.6*** 24.2*** 33.7 29.3
Percentage of working members with superior education 6.0 5.2 6.8 6.3
N = total number of working members 248 270 696 1214
Non-productive assets per household
Number of rooms in the home 2.81 (***) 3.35** 2.93 3.0
Number of working television sets 0.74 *(*) 0.89 0.98 0.90
Number of working radios 0.69** 0.77 0.80 0.77
Number of operating washing machines 0.22*** 0.19*** 0.08 0.13
Number of operating refrigerators 0.46 0.53 0.55 0.52
Number of bicycles 0.10*** 0.18 0.24 0.10
Number of motorcycles 0.09 0.13** 0.06 0.08
Number of DVD players 0.23* 0.27 0.36 0.31
Number of stereo systems 0.11***(**) 0.23 0.25 0.21
Number of computers 0.13 0.14 0.16 0.15
Number of vehicles 0.19** (**) 0.27 0.26 0.24
N= total number of households 111 111 260 482
*** p<0.01, ** p<0.05, * p<0.1 indicate if the difference between the risky/resettlement zones and the control zone are statistically significant. Stars in brackets refer to the difference between the risky and resettlement zones.
The landholding size is very small in the areas considered: 47.9% of households cultivate less than one hectare and the mean landholding size is 1.5 hectares. In addition, farmland distribution is highly unequal: farms with less than one hectare cultivate only 6.8% of the total land whereas farms with more than 5 hectares, which represent 8.7% of farms, occupy 56.2% of total land.
The evidence is mixed as to the degree of specialization of farmers. Farmers in the risky zone allocate most of their plots to agriculture (74.7%) whereas farmers in the control zone choose a mixed farming system in which 58.6% of plots are allocated to crops and 24.6% to pasture and livestock, leaving the remaining land fallow. Maize is the main crop cultivated on agricultural land in both zones. In the control zone potatoes are the second largest crop whereas in the risky zone it is beans.
Family labor is the second largest key asset in agriculture. Since the family labor force depends on the personal characteristics of household members, the relevant parameters are family size, age and gender composition of the household labor force, and human capital accumulation. Table 1 gives an overview of the main household members’ characteristics. Overall, households in risky, resettlement and control zones are relatively homogenous in terms of age and gender. There are slightly more men in the risky zone (51.8% of the risky zone population and 52.2% in the resettlement zone) than in the control zone, where men account for 47.3% of the population. The population is relatively younger in the control zone (where the average age is 34) than in the risky (34.6) and resettlement zones (37.6). This also holds true for the household head. As far as human capital is concerned, the level of schooling of members who are economically active is low. If we consider the whole sample, nearly 8.7% of workers never attended school or attended only kindergarten and 55.8% completed only primary school. Only 29.3% of the workers completed secondary school and 6.3% have completed a university cycle. In both the risky and resettlement zones, most workers have completed primary school whereas workers in the control zone tend to have completed more years of education. Since education is essential for improving individual employment prospects, this low educational attainment may prevent people from looking for distant jobs or engaging in local non-farm income generating activities.
Non-productive assets consist mainly of dwellings, durable (electronic) goods and vehicles. Because of the ongoing threat of destruction, households in the risky zone logically hold significantly fewer durable goods than households in the resettlement and control zones.
3.3.
Exposure and responses to volcanic shocks
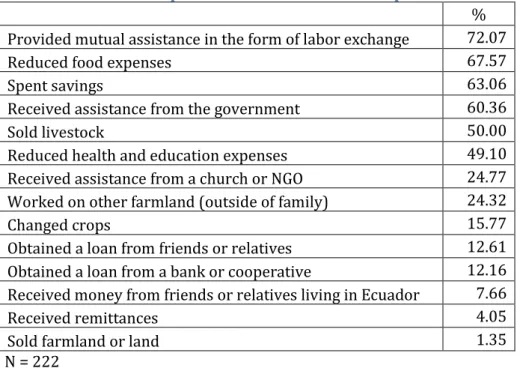
Among the 222 farmers farming land in the risky zone, 56% experienced damage to their dwelling following the eruption of March 2016, such as damaged roof, walls, windows, and interior furniture. 57% had a total loss of their crops and 32% a partial loss. 46% experienced loss of livestock. These farmers implemented several coping strategies, as shown in Table 2. When facing a shock, households are expected to implement insurance mechanisms, dispose of productive assets, borrow money from friends, relatives, a bank or cooperative, and reduce their consumption levels (Corbett, 1988). They tend first to protect income-generating assets, even to the detriment of current consumption, selling or abandoning productive assets as a last resort
(Ellis, 1998). In our study area, farmers behaved as expected7 with two interesting features. Many
farmers sold livestock, which can be explained by the fact that they did not have a place to shelter them; and worse, livestock owners were paid very low for the livestock as buyers took advantage
of the situation (Armijos and Few, 2015). Also, relatively few of them were able to obtain a loan.8
Table 2. Responses to the March 2016 eruption
%
Provided mutual assistance in the form of labor exchange 72.07
Reduced food expenses 67.57
Spent savings 63.06
Received assistance from the government 60.36
Sold livestock 50.00
Reduced health and education expenses 49.10
Received assistance from a church or NGO 24.77
Worked on other farmland (outside of family) 24.32
Changed crops 15.77
Obtained a loan from friends or relatives 12.61
Obtained a loan from a bank or cooperative 12.16
Received money from friends or relatives living in Ecuador 7.66
Received remittances 4.05
Sold farmland or land 1.35
N = 222
Logically, 45% respondents report the Tungurahua volcano to be very dangerous, 39% dangerous, 13% somewhat dangerous and 3% not dangerous. Nevertheless, people living on the slopes of the volcano overwhelmingly decided to stay despite both the human and economic risks from eruptions and the government's program of household relocation to safe areas: 84% of the respondents in the risky zone sample reported that their main residence was in an exposed area although 50% of them also have a residence in a protected zone. When asked if they would still be living in the exposed area while the volcano remains active, more than 94% of household heads said yes. The main reason for their reluctance to move (55.9% of answers) was related to economic opportunities, either because family income sources exist in the home location through farming, or because employment opportunities in other places were lacking or inaccessible. In addition, most family members (women, children and elders) stay at night in the resettlement home and go back to farm their land during the day, whereas only males stay overnight in the risky villages. This might give household members a feeling that the family is safe from the volcano’s threat. Other obstacles to relocation, such as old age, lack of education, difficulty renting houses, and a dependent family member, are also frequently mentioned (27% of answers). Finally, 11% said they had adapted to the ash fall so did not need to relocate.
7 Previous studies show evidence that farmers also cope with shocks through land rental markets (Eskander
and Barbier, 2016; Ward and Shively, 2015). However, we do not have such information in our data.
8 Berg and Schrader (2012) analyzed the effects of volcanic shocks on the demand and access to credit in
the area of the Tungurahua. Using a natural experiment, they found that the number of loans demanded increased in response to volcanic activity and that the access to credit depended on the extent of the client-bank relationship, even in the agricultural sector most severely affected by volcanic shocks.
4. Why do farm households stay in the risky zone?
The literature has explored factors that could explain a household’s decision to remain in volcanic areas (See Section 1). However, land illiquidity and labor immobility have received relatively little attention despite the potential insight that studying these factors might provide in understanding the behavior of farm households living on the slopes of volcanoes.
4.1.
Does the proximity of the volcano depreciate land values?
In the risky zone, all households in our sample are farmers and their primary asset is land. Therefore, analyzing their behavior calls for an understanding of farmland values. To this end, we use a hedonic pricing framework. Land is composed, not only of characteristics relating to the productive quality itself, but also of characteristics determined by location. The latter includes a wide range of location-determined characteristics, such as the quality of the environment (including proximity to the volcano), and the distance to markets or main roads. The hedonic price model consists of the analysis of the price of differentiated goods based on their characteristics. Rosen (1974) formalized the model for real estate prices, which was further developed for agricultural land by Palmquist (1989) and Palmquist and Danielson (1989). The hedonic model consists of revealing the implicit prices of various attributes of heterogeneous goods. It implies that farmland is a heterogeneous good consisting of a set of characteristics Z = (z1,…,zk ,…,zK) sold in bulk. Plots are distinguished from each other, both through their intrinsic and extrinsic characteristics. The hedonic model calculates the implicit marginal price of these different characteristics from the overall price (value) P(Z) of the plot. At equilibrium, each implicit marginal price pk is equal to the marginal willingness to pay for this characteristic and is calculated, in the case of quantitative variables, as the derivative of the aggregate price P(Z) with respect to the quantity zk. The empirical calculation of different marginal implicit prices thus requires the estimation of the hedonic price function by regressing prices of agricultural land on their various characteristics. Here, we focus on land that is owned and cultivated by farmers.
During the survey, farmers were asked to report the per-cuadra (1 cuadra = 84 square meters)
value of each plot of land they cultivate.9 Table 3 provides the description and summary statistics
of several intrinsic and extrinsic characteristics that explain farmland values. Annex 1 provides the regression results and implicit prices. The model explains 58.2% of land value variations. Since we estimated a log-log model, for continuous variables a 10% increase in the variable leads to a 10*coeff % change in the value of the cuadra; and for binary variables the impact in % is measured
by 100(ecoeff-1). The results support several commonly-held hypotheses about farmland prices.
We find that the larger the surface of the plot, the lower the value per cuadra is. In the model, we have three accessibility variables that play a significant role in the formation of agricultural land prices. We find that poor access to parcels in case of rain lowers their value and the closer a plot
is to the main road, the higher its value.
C
onstruction is also an important variable that addssignificant value to land. Among plots on which there is construction, 83% are dwellings and 17%
9 There are several convincing arguments that support the assumption that self-reported farmland values
closely approximate their market value. First, since we focus here on farmers who own and cultivate their land, we can postulate that they are the best informed on the various attributes of the plots. In particular, the accumulated experience conveys information about the previously adverse conditions, i.e. ash falls that have a plot-specific component. Second, farmers interviewed did not have any incentive to misreport the value of their land. Farmers are, thus, expected to be well informed about land prices.
are prefabricated house (mediagua). We introduced three variables that measure the productive potential of the plot, i.e., the reported quality of the soil, its slope and access to irrigation water. Flat land is positively valued compared to more sloping land and both are negatively valued compared to a mixed slope. Soil quality is not significant, but this may be related to the fact that 91% is of good quality.
The most interesting and relevant result is that farmland in the risky zone has a negative premium of 21% compared to land in the control zone, ceteris paribus. This depreciated value of land near volcanoes means that a farmland loses its value to serve as an insurance mechanism, despite it being a farm household’s main productive asset. Households thus face several challenges. First, their land capital is degraded by the eruptions. Second, farmland is an illiquid asset. Third, even if households wanted to sell their land, they would suffer a loss of value estimated above, which would not allow them to acquire the same productive capital outside the risky area. Since this loss would increase the cost of moving, this may also reduce the attractiveness of relocating. In addition, acquiring information on the land market of a new location might be difficult and searching for new land could entail high opportunity costs, transaction costs and uncertainty and reinforce the option of staying at the current place of work.
Table 3. Summary statistics for the hedonic model
Owned and cultivated plots in both
zones Control Risky
Variable Mean Std. Dev. Min Max Mean Mean
ln_pricesur Logarithmic transformation of the value per cuadra 0.95 1.41 -3.68 5.19 1.26 0.57 ***
ln_superficie Surface (in cuadra) 8.09 1.55 4.09 14.00 7.86 8.37 ***
irrigation =1 if irrigated 0.47 0.50 0 1 0.74 0.14 ***
goodsoil =1 if good quality (self-reported soil quality) 0.91 0.29 0 1 0.90 0.92
tilt_flat =1 if the tilt is flat 0.51 0.50 0 1 0.55 0.45 **
tilt_slope =1 if the tilt is sloping 0.26 0.44 0 1 0.25 0.27
tilt_ravine =1 if the tilt is on a ravine 0.03 0.17 0 1 0.02 0.04 *
tilt_mixt =1 if tilt is mixed 0.21 0.40 0 1 0.18 0.24
construction =1 if construction on the plot 0.70 0.46 0 1 0.75 0.64 ***
rain =1 if difficulty to access when it rains 0.36 0.48 0 1 0.33 0.38
ln_road Logarithmic transformation of the distance from the nearest road (km) -3.30 3.39 -9.21 3.91 -3.81 -2.70 ***
ln_canton_time Logarithmic transformation of the distance from the nearest canton (min) 3.19 1.10 -9.21 4.79 3.21 3.16
zonaland_risky =1 if in the risky zone 0.45 0.50 0 1
N=535 N=293 N=242
*** p<0.01, ** p<0.05, * p<0.1 indicate if the difference between the control zone and the red zone is statistically significant. Note: To allow the logarithmic transformation of ln_road and ln_canton_time, we added 0.0001 to all observations.
4.2.
Geographical and occupational immobility
Labor immobility is an important issue in determining the response of farmers to a volcanic threat. The more immobile labor is, the more difficult a location change in both residence and occupation would be. There is a fairly large body of empirical work on both aspects of labor immobility in rural areas.
Among all the factors that are known to attach people to a place and reduce mobility, the extent to which farming skills are transferable across space is a main concern that has recently received attention in the literature (Autor, 2013; Bazzi et al., 2016; Gathmann and Schönberg, 2010; Huffman and Feridhanusetyawan, 2007). Most crops are sensible to growing conditions, such as soil conditions, soil management techniques, soil nutrient disorder etc. (Cox et al., 2006). Farming technical knowledge is thus usually associated with specific location and specific crop. As a result, farmers may encounter difficulties in transferring their human capital to safe locations where growing conditions may be different. As a result, a large productivity loss may occur that causes significant foregone earnings. Barriers to skill transferability may thus imply an adjustment cost that is out of reach of most farmers (Gollin and al., 2014).
Labor immobility also refers to the difficulty in taking advantage of opportunities in other sectors in nearby or distant areas. Numerous studies have examined the extent to which rural
workers engage in non-farm activities,10 as well as the rationale behind this behavior, well
summarized by Ellis (1998).11 It is now widely held that labor mobility depends on the availability
of attractive non-farm opportunities arising from a dynamic local economy and the capacity of household members to exploit these opportunities, which, in turn, depends on the level of their human, social and financial capital.
In the sampled areas, on-farm activities are the main occupation of the majority of household members: nearly 90% of them declare working on their own farm, in whichever zone they live. However, in addition to working on their farm, household members engage in non-farm work: 20.2% of household members declare a non-farm occupation in the risky zone, 15.2% in the resettlement zone and 27.1% in the control zone. These figures tend to suggest a significantly lower degree of participation in the non-farm labor market in the resettlement and risky zones compared to that in the control zone. This result contradicts most findings in the literature that document a positive relationship between risk exposure and participation in non-farm activities. As we will see, this indicates strong barriers to the adjustment to risk exposure.
10 Non-farm activities include non-agricultural wage work and self-employment activities which generate
income. Note that some activities linked to agriculture, such as agro-processing, sales of agricultural products, or agricultural wage jobs are often undertaken by households. Since this analysis focuses on the occupational mobility out of agriculture, they have been excluded from the calculations.
11 For a comprehensive survey of the determinants of labor mobility in rural areas in Latin America, see also
the special issue of World Development “Rural Non-farm Employment and Incomes in Latin America”, published in March 2001.
Table 4. Characteristics of non-farm occupations Risky zone Resettlement zone Control zone All sample Share of workers participating in (%)
Farm work 90.0 91.4 89.1 89.8
Non-farm work 20.2**(*) 15.2*** 27.5 23.3
N = total number of workers 248 270 696 1214
Share of non-farm occupation in (%)
Sales and related occupations 42.0*** 48.8** 66.5 59.6
Manufacture, construction, transportation,
repair 40.0** 31.7 25.7 29.1
Office and administrative support 2.0 1.0 0.0 3.0
Management, health, education, art, design 14.0 17.1 7.9 10.3
N= total number of non-farm occupation 126 243 48 369
Share of non-farm wage occupation in (%)
Same parish 54.5 26.1 42.3 41.2
Same province 31.8 65.2 38.5 43.3
other province 13.6 8.7 19.2 15.5
N= total number of non-farm wage occupation 22 23 52 97
*** p<0.01, ** p<0.05, * p<0.1 indicate if the difference between the risky/resettlement zones and the control are statistically significant. Stars in bracket refer to the difference between the risky and resettlement zone.
The range of non-farm occupations appears rather limited: commerce is the primary subsector that attracts workers in all three zones (66.5% of occupations in the control zone, 48.8% in the resettlement zone and 45.1% in the risky zone). Manufacture, construction and transport represent together the second largest subsector of occupations, with 40% of occupations in the risky zone, 31.7% in the resettlement zone, and 25.7% in the control zone. The third largest subsector of occupations, but far behind the other two, includes all of the occupations ranging from managerial to medical and administrative occupations and constitutes no more than 13.3% of occupations.
Most occupations are performed quite close to dwellings: 41.2% of non-farm activities are exercised in the same parish where workers live, another 43.3% are undertaken in the same province and only 15.5% in another province.
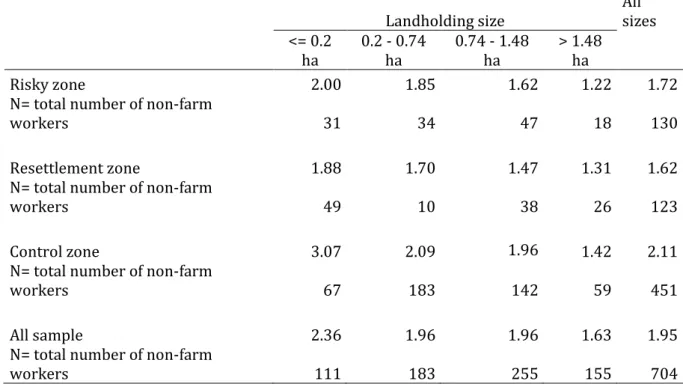
Table 5 shows that the weight of agricultural-related occupations is much greater for landed than for landless households. Multi-activity as well as non-farm occupation declines with an increase in landholding size: households whose landholding size falls in the first quartile have a higher number of workers engaged in non-farm activities on average than those whose landholding size falls in the last quartile. Hence, non-farm activities appear to be an inferior good. Households that lack farmland, and thus farming income, are those that engage more in the labor market or develop non-farm enterprises. Although the information on incomes is not available from survey data, the inverse relationship between land size and non-farm labor tends to suggest that diversification away from farm labor is mainly driven by push rather than by pull factors.
Table 5. Average number of members working non-farm per household
Landholding size All sizes
<= 0.2 ha 0.2 - 0.74 ha 0.74 - 1.48 ha > 1.48 ha
Risky zone 2.00 1.85 1.62 1.22 1.72
N= total number of non-farm
workers 31 34 47 18 130
Resettlement zone 1.88 1.70 1.47 1.31 1.62
N= total number of non-farm
workers 49 10 38 26 123
Control zone 3.07 2.09 1.96 1.42 2.11
N= total number of non-farm
workers 67 183 142 59 451
All sample 2.36 1.96 1.96 1.63 1.95
N= total number of non-farm
workers 111 183 255 155 704
Overall, diversification of economic activities in our sample appears quite low, in particular in the risky and resettlement zones. In most empirical studies, the drivers of geographical mobility involve many factors, among which are the availability of jobs the capacity of rural workers to perform these jobs, and the cost of commuting or moving.
The spatial distribution of economic activities and the resulting local labor market dynamism in nearby areas is a primary issue in understanding involvement by rural workers in non-farm activities. Access to a wide range of jobs for rural people depends on the availability of these jobs. A diversified local economy is better able to offer many jobs, and some industries offer jobs that are more flexible, better adapted to agricultural seasonality, and better suited to a farmer’s skill set.
The survey does not provide information on the local labor market, such as the conditions in nearby urban market centers or other prosperous villages. However, we have qualitative information on the main cities close to the survey areas. Baños, which is the nearest city to both the risky and resettlement zones, is a major tourist center of around 20,000 inhabitants, so most job opportunities are in the leisure, entertainment or hospitality industries and require skills (communication, computer know- how, interpersonal skills) that are far beyond the reach of workers with a farming background. Riobamba is the capital city of the province Chimborazo and has 250,000 inhabitants. It is close to the control zone and has a large market which supports the demand for both agricultural and non-agricultural products and services that farm households are able to produce or supply. It is also expected to have a wider range of production activities and greater opportunities for farm jobs. This partly explains why the participation in non-farm activities is higher in the control zone.
A second main source of labor immobility of rural workers comes from the fixed costs they incur when they enter the labor market. Among these costs, the commuting or moving costs associated with the distance between the residential and workplace is key. People living far from cities bear higher transport costs and have less information about employment opportunities, either directly or through social networks. These costs clearly reduce the probability of wage employment. Individuals living in rural environments also remain constrained in their self-employment opportunities. Distance to a large urban center restrains the demand for non-agricultural products and services that farms are able to offer.
At first glance, the differences between the risky, resettlement and control zones in terms of distance (by road) to main urban centers cannot be considered as a significant impediment to non-farm work. The communities of the risky zone are on average 45 km away from the closest city Baños, whereas resettlement zones are a little bit closer (23.3 km). The closest city to the control zone communities is Riobamba, which is only 12 km away. Both zones have access to relatively good paved roads.
Finally, many empirical studies show that labor mobility of agricultural workers is low because they usually lack the skills to work in non-farm jobs (ILO, 2011). The noticeable differences in the time-allocation pattern between the three zones are consistent with the level of education of the rural labor force. Unskilled workers make up the vast majority of the workforce in the risky and resettlement areas where most workers have acquired only a primary education and thus retraining would be difficult and/or costly. In comparison, educational attainment in the control zone is higher, so the capacity of household members to take non-farm opportunities is better.
5. Discussion and conclusion
Natural disasters, such as volcanic eruptions, impose severe non-productive and productive asset loss to affected populations. Dwellings, land, crops and livestock are damaged with every natural hazard. Despite this regular destruction, some populations choose to live under the threat of volcanoes. In this paper, we use primary data collected from farmers living under the threat of the Tungurahua volcano in Ecuador from farmers living in a nearby control zone to examine farm household behavior, with the specific intention of proposing natural hazard-response economic policies. Our attention is particularly directed to the examination of the household’s main productive assets, i.e., farmland and labor.
Farm households living near active volcanoes face hard choices since the maintenance of livelihoods depends on the return on economic activities. Their decision to stay should be understood as the result of asset illiquidity and labor immobility. We have shown that farmers tend to own location-specific assets and would thus incur significant costs in relocating. Assets, such as farmland that are not easily marketable (or at a low value) clearly restrict a farmer’s ability to relocate. Farmers may also lack resources to move or change occupations. Such barriers suggest that adjustment to volcanic shocks through the diversification of economic activities may be extremely difficult for some workers. Our paper thus complements anthropological, social and geographical approaches such as Armijos and Few (2015), Armijos et al. (2017), and Few et al. (2017).
Nonetheless, there are many reasons for living near the Tungurahua. First, land on the slopes of the Tungurahua volcano is highly productive, with soils fertilized by ashes and a favorable climate. Second, efforts by Ecuadorian authorities to inform the population through the community-based network of vigias have helped people to return to their original homes in the volcanically threatened area around the Tungurahua with less risk (Stone et al., 2014). As a result, people tend to perceive the risk as acceptable. All of this has thwarted the government's efforts to induce risk area residents to evacuate and relocate to safe areas.
However, current public policies in Ecuador are not sufficient because they adopt a disaster risk management approach that consists of aid provided during emergency periods (Armijos and Few, 2015). Considering the impact of ash fall on productive assets and constraints faced by farm households with respect to their occupational attributes, we argue that relocation policies should be complemented by interventions on land and labor markets to address natural hazards. There is a need for more integrated policies that account for land and labor specificities.
Ash falls compromise the agricultural production of farmers already burdened by poverty. Increasing agricultural productivity should greatly help to manage the inherent risks of agricultural production in areas threatened by volcanic eruptions. Enhanced agricultural productivity should also be passed on in land prices and compensate, at least partly, for the discount in land prices linked to eruptions. As there are so many aspects that determine agricultural productivity, there is a large scope for policy intervention. The uptake of new technologies, such as use of improved seed varieties, expansion of irrigation and the adoption of higher value crops depend foremost on the availability of technologies appropriate to local conditions. Scientists have the responsibility to provide information on suitable options. Agricultural extension services, broad access to credit services and potentially the creation of crop and livestock insurance against volcanic shocks are also vital means to ensure widespread adoption of productivity-enhancing technologies.
However, the poorest farmers might not have sufficient land or access to strategic inputs to escape poverty. Diversification of household income sources is another common means of managing the risks associated with eruptions. The principal policy challenge is how to unlock employment opportunities and ensure that farmers can access alternative jobs. Policies should therefore facilitate development of opportunities in neighboring areas in tourism, small shops, transport cooperatives, and small-scale mining. Common means of supporting enterprise development include improved access to credit services, markets, and technology, as well as entrepreneurship training. Integrating rural workers into non- agricultural labor jobs would require entire households to transform their assets and skills. Public authorities should thus consider implementing a training policy in non-agricultural activities that would ease occupational mobility.
Policymakers who have implemented resettlement strategies in the past must acknowledge the lack of realism of expecting households to resettle away from dangerous zones without taking into account the livelihood opportunities (or lack thereof) elsewhere. A balance must be found between volcanic risk and livelihood transferability when designing resettlement schemes. Our findings are certainly relevant for other natural disasters, especially in areas under repeated shocks as landslides, floods and drought.
References
Armijos, M.T., Few, R., 2015. Living with volcanic risk: Vulnerability, knowledge and adaptation in the slopes of Tungurahua, Ecuador. DEV Report and Policy Papers Series. School of International Development, University of East Anglia, Norwich, UK.
Armijos, M.T., Phillips, J., Wilkinson, E., Barclay, J., Hicks, A., Palacios, P., Mothes, P., Stone, J., 2017. Adapting to changes in volcanic behaviour: Formal and informal interactions for enhanced risk management at Tungurahua Volcano, Ecuador. Global Environmental Change 45, 217–226. https://doi.org/10.1016/j.gloenvcha.2017.06.002
Autor, D. H. 2013. The" task approach" to labor markets: an overview. Journal for Labour Market Research, 46, 185-199. Doi 10.1007/s12651-013-0128-z
Bachri, S., Stötter, J., Monreal, M., Sartohadi, J., 2015. The calamity of eruptions, or an eruption of benefits? Mt. Bromo human–volcano system a case study of an open-risk perception. Nat. Hazards Earth Syst. Sci. 15, 277–290. https://doi.org/10.5194/nhess-15-277-2015 Bazzi, S., Gaduh, A., Rothenberg, A. D., & Wong, M. 2016. Skill Transferability, Migration, and
Development: Evidence from Population Resettlement in Indonesia. American Economic
Review, 106(9), 2658-98. doi: 10.1257/aer.20141781
Bchir, M.A., Willinger, M., 2013. Does the exposure to natural hazards affect risk and time preferences? Some insights from a field experiment in Perú. Unpublished Manuscript. Berg, G., Schrader, J., 2012. Access to credit, natural disasters, and relationship lending. Journal of
Financial Intermediation 21, 549–568. https://doi.org/10.1016/j.jfi.2012.05.003
Binswanger, H.P., 1980. Attitudes Toward Risk: Experimental Measurement in Rural India. Am J Agric Econ 62, 395–407. https://doi.org/10.2307/1240194
Brunette, M., Choumert, J., Couture, S., Montagne-Huck, C., 2015. A Meta-analysis of the Risk Aversion Coefficients of Natural Resource Managers Evaluated by Stated Preference Methods (Working Papers - Cahiers du LEF No. 2015–13). Laboratoire d’Economie Forestiere, AgroParisTech-INRA.
Carter, M.R., Barrett, C.B., 2006. The economics of poverty traps and persistent poverty: An
asset-based approach. Journal of Development Studies 42, 178–199.
https://doi.org/10.1080/00220380500405261
Cook, R.J., Barron, J.C., Papendick, R.I., Williams, G.J., 1981. Impact on Agriculture of the Mount St. Helens Eruptions. Science 211, 16–22. doi:10.1126/science.211.4477.16
Corbett, J., 1988. Famine and household coping strategies. World Development 16, 1099–1112. https://doi.org/10.1016/0305-750X(88)90112-X
Cox, T. S., Glover, J. D., Van Tassel, D. L., Cox, C. M., & DeHaan, L. R. (2006). Prospects for developing perennial grain crops. BioScience 56 (8): 649-59
Dercon, S., 1998. Wealth, risk and activity choice: cattle in Western Tanzania. Journal of Development Economics 55, 1–42. https://doi.org/10.1016/S0304-3878(97)00054-0 Doocy, S., Daniels, A., Dooling, S., Gorokhovich, Y., 2013. The Human Impact of Volcanoes: a
Historical Review of Events 1900-2009 and Systematic Literature Review. PLoS Curr 5. https://doi.org/10.1371/currents.dis.841859091a706efebf8a30f4ed7a1901
Ellis, F. 1998. Household strategies and rural livelihood diversification. The Journal of Development Studies, 35(1), 1-38. https://doi.org/10.1080/00220389808422553 Eskander, S., Barbier, E., 2016. Adaptation to natural disasters through the agricultural land rental
market: evidence from Bangladesh. In 2016 Annual Meeting, July 31-August 2, 2016, Boston, Massachusetts (No. 235648). Agricultural and Applied Economics Association. Fafchamps, M. 1993. Sequential labor decisions under uncertainty: An estimable household model
of West-African farmers. Econometrica: Journal of the Econometric Society, 1173-1197. Fafchamps, M., Udry, C., Czukas, K., 1998. Drought and saving in West Africa: are livestock a buffer
stock? Journal of Development Economics 55, 273–305. https://doi.org/10.1016/S0304-3878(98)00037-6
Few, R., Armijos, M.T., Barclay, J., 2017. Living with Volcan Tungurahua: The dynamics of
vulnerability during prolonged volcanic activity. Geoforum 80, 72–81.
Gaillard, J.-C., 2008. Alternative paradigms of volcanic risk perception: The case of Mt. Pinatubo in the Philippines. Journal of Volcanology and Geothermal Research, Volcanic risk perception and beyond 172, 315–328. https://doi.org/10.1016/j.jvolgeores.2007.12.036
Gathmann, C., & Schönberg, U. 2010. How general is human capital? A task-based approach. Journal of Labor Economics, 28(1), 1-49. doi: 10.1086/649786
Glaser, A.N., 1996. The Global Effects of Volcanic Eruptions on Human Health and Agriculture: A Review. Journal of Agromedicine 3, 31–43.
Gollin, D., Lagakos, D., & Waugh, M. E. (2014). Agricultural productivity differences across
countries. American Economic Review, 104(5), 165-70. DOI: 10.1257/aer.104.5.165
Hoddinott, J., 2006. Shocks and their consequences across and within households in Rural
Zimbabwe. Journal of Development Studies 42, 301–321.
https://doi.org/10.1080/00220380500405501
Holt, C.A., Laury, S.K., 2002. Risk Aversion and Incentive Effects. American Economic Review 92, 1644–1655. https://doi.org/10.1257/000282802762024700
Huffman, W. E., & Feridhanusetyawan, T. 2007. Migration, fixed costs, and location-specific amenities: A hazard analysis for a panel of males. American journal of agricultural economics, 89(2), 368-382. Doi: 10.1111/j.1467-8276.2007.00993.x
International Labour Office (ILO). 2011, World Employment and Social Outlook 2016:
Transforming jobs to end poverty, Geneva. Available at
http://www.ilo.org/wcmsp5/groups/public/---dgreports/---dcomm/---publ/documents/publication/wcms_481534.pdf
Jarvis, A., Reuter, H.I., Nelson, A., Guevara, E., 2008. Hole-filled seamless SRTM data V4, International Centre for Tropical Agriculture (CIAT).
Jensen, R., 2000. Agricultural Volatility and Investments in Children. American Economic Review 90, 399–404. https://doi.org/10.1257/aer.90.2.399
Kelman, I., Mather, T.A., 2008. Living with volcanoes: the sustainable livelihoods approach for volcano-related opportunities. Journal of Volcanology and Geothermal Research 172, 189–198.
Kochar, A., 1999. Smoothing Consumption by Smoothing Income: Hours-of-Work Responses to Idiosyncratic Agricultural Shocks in Rural India. Review of Economics and Statistics 81, 50–61. https://doi.org/10.1162/003465399767923818
Lavigne, F., De Coster, B., Juvin, N., Flohic, F., Gaillard, J.-C., Texier, P., Morin, J., Sartohadi, J., 2008. People’s behaviour in the face of volcanic hazards: Perspectives from Javanese communities, Indonesia. Journal of Volcanology and Geothermal Research, Volcanic risk perception and beyond 172, 273–287. https://doi.org/10.1016/j.jvolgeores.2007.12.013 Le Pennec, J. L., Ruiz, G. A., Ramón, P., Palacios, E., Mothes, P., & Yepes, H. 2012. Impact of tephra falls on Andean communities: The influences of eruption size and weather conditions during the 1999–2001 activity of Tungurahua volcano, Ecuador. Journal of Volcanology and Geothermal Research, 217, 91-103.
Mishra, A. K., & Goodwin, B. K. (1997). Farm income variability and the supply of off-farm labor. American Journal of Agricultural Economics, 79(3), 880-887.
Palmquist, R.B., 1989. Land as a Differentiated Factor of Production: A Hedonic Model and Its Implications for Welfare Measurement. Land Economics 65, 23–28. doi:10.2307/3146260 Palmquist, R.B., Danielson, L.E., 1989. A hedonic study of the effects of erosion control and
drainage on farmland values. American Journal of Agricultural Economics 71, 55–62. Reardon, T., Vosti, S.A., 1995. Links between rural poverty and the environment in developing
countries: Asset categories and investment poverty. World Development 23, 1495–1506. https://doi.org/10.1016/0305-750X(95)00061-G
Rodríguez-VanGort, F., & Novelo-Casanova, D. A. 2015. Volcanic risk perception in northern Chiapas, Mexico. Natural Hazards, 76(2), 1281-1295. https://doi.org/10.1007/s11069-014-1549-x
Rose, E., 2001. Ex ante and ex post labor supply response to risk in a low-income area. Journal of Development Economics 64, 371–388. https://doi.org/10.1016/S0304-3878(00)00142-5
Rosen, S., 1974. Hedonic Prices and Implicit Markets: Product Differentiation in Pure Competition. Journal of Political Economy 82, 34–55. doi:10.1086/260169
Rosenzweig, M.R., Wolpin, K.I., 1993. Credit Market Constraints, Consumption Smoothing, and the Accumulation of Durable Production Assets in Low-Income Countries: Investments in Bullocks in India. Journal of Political Economy 101, 223–244.
Rosenzweig, M.R., Binswanger, H.P., 1993. Wealth, Weather Risk and the Composition and Profitability of Agricultural Investments. The Economic Journal 103, 56–78. https://doi.org/10.2307/2234337
Solberg, S., Hale, D., & Benavides, J. 2003. Natural disaster management and the road network in Ecuador: Policy issues and recommendations. Washington, DC: Inter-American Development Bank.
Stone, J., Barclay, J., Simmons, P., Cole, P. D., Loughlin, S. C., Ramón, P., & Mothes, P. 2014. Risk reduction through community-based monitoring: the vigías of Tungurahua, Ecuador. Journal of Applied Volcanology, 3(1), 11.
Tobin, G.A., Whiteford, L.M., 2002. Community resilience and volcano hazard: the eruption of Tungurahua and evacuation of the faldas in Ecuador. Disasters 26, 28–48.
Udry, C. 1995. Risk and saving in Northern Nigeria. The American Economic Review, 85(5), 1287-1300.
Van Manen, S. M. 2014. Hazard and risk perception at Turrialba volcano (Costa Rica); implications
for disaster risk management. Applied Geography, 50, 63-73.
https://doi.org/10.1016/j.apgeog.2014.02.004
Ward, P.S., Shively, G.E., 2015. Migration and Land Rental as Responses to Income Shocks in Rural China. Pacific Economic Review 20, 511–543. https://doi.org/10.1111/1468-0106.12072 Willinger, M., Bchir, M.A., Heitz, C., 2013. Risk and time preferences under the threat of background risk: a case-study of lahars risk in central Java. Working Paper LAMETA, Montpellier DR n°2013-08.
Wilson, T., Cole, J., Cronin, S., Stewart, C., Johnston, D., 2011. Impacts on agriculture following the 1991 eruption of Vulcan Hudson, Patagonia: lessons for recovery. Natural Hazards 57, 185–212. doi:10.1007/s11069-010-9604-8
Wilson, T., Kaye, G., Stewart, C., Cole, J., 2007. Impacts of the 2006 eruption of Merapi volcano, Indonesia, on agriculture and infrastructure. GNS Science Report 2007/07 69p.
Zimmerman, F.J., Carter, M.R., 2003. Asset smoothing, consumption smoothing and the reproduction of inequality under risk and subsistence constraints. Journal of Development Economics 71, 233–260. https://doi.org/10.1016/S0304-3878(03)00028-2
Appendix
Annex 1. Hedonic pricing results and marginal effects Regression
results
Variation of the value per cuadra due to a
10%
Variation of the value per cuadra due for having the
characteristic VARIABLES
Ln_superficie -0.636*** -6.36
(0.0327)
(0.107) Goodsoil 0.186 20.44 (0.142) Tilt_flat12 -0.322*** -27.53 (0.112) Tilt_slope -0.619*** -46.15 (0.133) Tilt_ravine -0.0762 -7.34 (0.308) Construction 0.266*** 30.47 (0.0932) Rain -0.236** -21.02 (0.0923) Ln_road -0.0224* -0.22 (0.0124) Ln_canton_time -0.0809 -0.81 (0.0586) Zonaland_risky -0.239** -21.26 (0.113) Constant 6.369*** (0.332) Observations 535 R-squared 0.582
Robust ordinary least squares, log-log model
Robust standard errors in parentheses *** p<0.01, ** p<0.05, * p<0.1