Saving incentives, old-age provision and
displacement effects : evidence from the recent
German pension reform
AXEL BO¨RSCH-SUPANMannheim Research Institute for the Economics of Aging(MEA), Mannheim University ANETTE REIL-HELD
Mannheim Research Institute for the Economics of Aging(MEA), Mannheim University (e-mail : reil-held@mea.uni-mannheim.de)
DANIEL SCHUNK
Institute for Empirical Research in Economics, University of Zurich
Abstract
In response to population aging, pay-as-you-go pensions are being reduced in almost all de-veloped countries. In many countries, governments aim to fill the resulting gap with subsidized private pensions. This paper exploits the recent German pension reform to shed new light on the uptake of voluntary, but heavily subsidized private pension schemes. Specifically, we investi-gate how the uptake of the recently introduced ‘ Riester pensions ’ depends on state-provided saving incentives, and how well the targeting at families and low-income households works in practice.
We show that, after a slow start, private pension plans took off very quickly. While saving incentives were effective in reaching parents, they were less successful in attracting low-income earners, although Riester pensions exhibit a more equal pattern by income than occupational pensions and unsubsidized private pension plans.
We also provide circumstantial evidence on displacement effects between saving for old-age provision and other purposes. Households who plan to purchase housing are less likely to have a Riester pension. The same holds for households who attach high importance to a bequest motive. Occupational pensions and other forms of private pensions, however, act as comp-lements rather than as substitutes.
Many thanks to Christian Goldammer, Katharina Flenker, Do¨rte Heger, Verena Niepel, Martin Werner, and Keren Ladin for their outstanding assistance, and two anonymous referees for their helpful advice. We are grateful for financial support by the Federal Ministry for Education and Research, the German Science Foundation (DFG) through the SFB504, as well as the State of Baden-Wu¨rttemberg and the German Insurers Association (GDV) through the basic funding of MEA. All remaining errors are ours. doi:10.1017/S1474747208003636 First published online 9 May 2008
1 Introduction
Demographic change poses major problems for public pay-as-you-go pension schemes around the world. Many countries have therefore introduced pension re-forms that reduce the level of pay-as-you-go-financed public pensions. Since this will create a gap in old-age income relative to the current benefit level, many governments have accompanied public pension reform with a strengthening of funded second- and third-pillar pensions. In order to accelerate the uptake of such pensions, savings are often heavily subsidized, usually in the form of flat-rate benefits, tax credits, and/or tax deductions. Sometimes, these subsidies are targeted, e.g. for low-income in-dividuals or families with children.
Do these subsidies work ? This is the key question addressed by this paper. We exploit the recent German pension reform in order to shed new light on this question. Specifically, we are interested in public acceptance of the new pension plans and its dynamics over time. Moreover, we want to better understand the distributional aspects : for whom the saving incentives work, i.e. who has joined the new subsidized pension scheme, and who is likely to be left with a pension gap. Finally, we investigate whether the new private pension plans displace saving for other purposes.
Voluntary, but highly subsidized supplemental private pensions, so-called ‘ Riester pensions, ’ were introduced in 2001 as part of a general overhaul of the German pension system.1
Subsidies increased in a step-wise fashion from 2002 until 2008, allowing us to identify the effects of subsidies on uptake rates. We use the German SAVE data, a new panel data set on households’ saving and asset choices, socio-demographic characteristics, and psychological determinants of saving and old-age provision behavior. Currently, the SAVE data capture the time period between 2001 and 2006 and offer a unique opportunity to investigate old-age provision based on very recent data with a broad set of explanatory variables.
The issues investigated in our paper contribute to the discussion about the impact of retirement saving incentives in various countries. In the US, Venti and Wise (1990) on the one side and Gale and Scholz (1994) on the other side have sparked a very controversial discussion about the efficacy of Individual Retirement Accounts (IRAs) as saving devices ; see Skinner and Hubbard (1996) for an early review. Disney et al. (2001) have provided a helpful review tailored to the UK situation. These con-troversies have accompanied pension reform in almost all developed countries, generating an interest in cross-national analyses of retirement saving behavior under different tax and subsidy regimes, see Bo¨rsch-Supan (2003, 2004). This paper adds the recent German experience to this discussion.
The paper is also linked to recent research in behavioral economics and comp-lements the laboratory evidence on behavior in complex dynamic decision situations (e.g., Schunk and Winter, 2007) with experiences from real-life decision situations, specifically decisions about old-age provision. Our paper provides striking evi-dence that the uptake of Riester pension plans occurred only after substantial
1In essence, the formerly monolithic German pay-as-you-go system is transiting to a multi-pillar system
with public, occupational and private pensions. For a detailed description of the pension reform process in Germany see Bo¨rsch-Supan and Wilke (2004). The ‘ Riester pensions’ are named after Walter Riester, former German Secretary of Labor and Social Security, who introduced the 2001 pension reform.
simplifications had been made. This provides evidence that customers are deterred by overly complex pension products, which are not easily understood. It also adds to the evidence provided by Madrian und Shea (2001) who demonstrated that the decision for or against specific pension products depends to a large extent on how the different products were presented. Moreover, we find that the extent of information about the pension system is a key factor in the participation decision. This has been sug-gested by Boeri et al. (2002). Many respondents in our sample lack the information deemed necessary for taking the appropriate retirement saving decisions (Lusardi and Mitchell, 2006). This lack of information is particularly high among respondents with low education and income, confirming US results by Lusardi (1999).
Therefore, it is not surprising that we find striking differences in private pension enrolment by socio-demographic characteristics. We find that these enrolment patterns do not always follow the incentive scheme. In many cases, they better fit the patterns predicted by the availability of information about the pension system. In general, households with higher levels of educational attainment and households in the middle- and upper-income brackets are more likely to make use of Riester subsidies than low-income and low-education households.
Finally, we provide circumstantial evidence for displacement effects. For example, households who plan to purchase housing property are less likely to enrol in a Riester pension plan. The same holds for households who attach high importance to a be-quest motive. Occupational pensions and other forms of private pensions, however, act as complements rather than as substitutes.
The remainder of the paper is structured as follows. Section 2 sets the stage by presenting the key institutional features of subsidized pension schemes in Germany and the uptake of Riester pensions between 2001 and 2006. Sections 3 and 4 provide descriptive and econometric evidence on the dynamics of enrolment in Riester pen-sion plans by socio-economic and psychological characteristics. Section 5 concludes.
2 The incentives for Riester pensions
While Riester pensions are voluntary, they have been designed to fill the gap that will be created by the scheduled reduction of public pension benefits in response to the pressures of population aging. In order to achieve this aim, the German Retirement Savings Act2
introduced a comprehensive regime of saving incentives for certified pension products (‘ Riester pensions ’). These retirement saving plans are eligible for subsidies in the form of flat-rate benefits or tax relief. Initially, certification regu-lations and subsidy mechanisms were rather complex, but they were significantly simplified in 2005. We first describe the initial situation because it bears many lessons for effective subsidy design.
2.1 Initial criteria and incentives
Criteria for ‘ certifiable ’ products. Initially, private pension plans were eligible for subsidies if they fulfilled 11 criteria stipulated by the Certification of Retirement Pension Contracts Act. These criteria included, among others, the following
requirements : savers must make regular contributions ; providers must guarantee that the nominal rate of return in each calendar year be strictly positive ; pension benefits must be disbursed as certain types of lifelong annuities ; lump sum payments at retirement must not exceed 20 % of the accumulated wealth ; administrative and marketing costs must be spread over at least ten years ; and all providers must register at a supervisory board.
Eligibility. Not all households are eligible for the subsidies. The eligibility criteria are complex, although the intension was that everyone affected by the reduction in public pension benefits should be eligible for private pension subsidies. Hence, the group of eligible beneficiaries includes employees paying mandatory social insurance con-tributions ; recipients of wage compensation benefits (such as unemployment benefit, child-raising benefits, etc.) ; self-employed people who are mandatory members of the public pension system ; farmers ; and tenured civil servants.3Spouses of eligible in-dividuals are also entitled to receive subsidies (‘ indirect entitlements ’) provided that they enroll in a separate pension plan of their own.
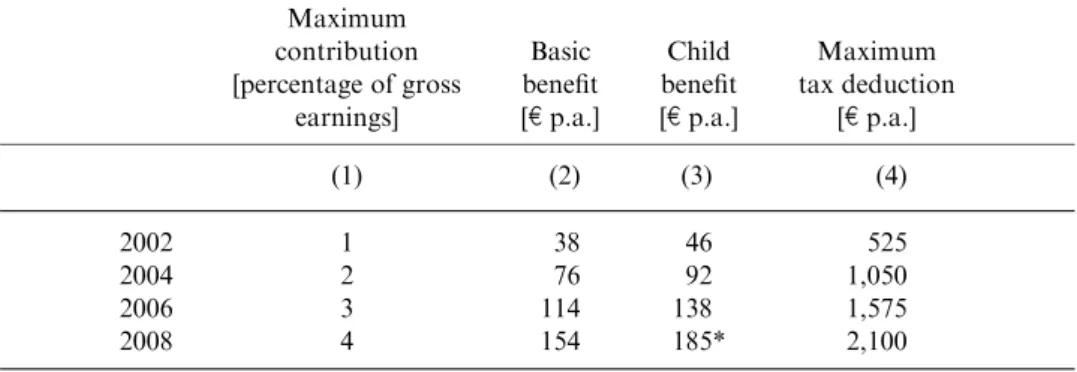
Subsidies. Due to government budget constraints, the subsidy scheme was phased in step-by-step, starting in 2002 and ending in 2008, doubling the applicable parameters in each step. This is shown in Table 1. Column 1 shows the percentage of gross earnings that must be contributed to the plan in order to qualify for the full subsidy. The full subsidy is displayed in columns 2–4 and has three elements. First, there is a flat-rate benefit (column 2) for low- and middle-income households. Individuals eligible for this flat-rate benefit pay their savings into a certified pension plan and file an application form for subsidies each year. The plan provider receives the flat-rate
Table 1. State incentives for supplementary pension provision
Maximum contribution [percentage of gross earnings] Basic benefit [e p.a.] Child benefit [e p.a.] Maximum tax deduction [e p.a.] (1) (2) (3) (4) 2002 1 38 46 525 2004 2 76 92 1,050 2006 3 114 138 1,575 2008 4 154 185* 2,100
Note: * The child allowance ise300 for children born after 2007.
3The precise definition of persons eligible for state subsidies is very complicated. Reform proposals include
widening entitlements to the entire active population or all tax payers. Simpler eligibility rules are ex-pected to increase uptake more than proportionally. Such a reform would also reach individuals with very low levels of social security – such as people in low-income ‘ mini jobs ’ or the part-time self-employed (Commission for the Sustainable Financing of the German Social Security System, 2004).
benefit and credits it to the account as part of the total contribution. Second, all eligible savers receive an additional benefit for each child (column 3). Third, con-tributions to Riester pension plans can be tax deductable as special expenses up to a maximum amount (column 4). This amount has been fixed in nominal terms at e2,100 from 2008 onwards, which will, unless changed, eventually erode this third subsidization mechanism.4
Subsidies are reduced proportionally if contributions to the Riester plan are lower than the maximum indicated in column 1. Since the subsidy itself is counted as part of that contribution, some mathematical skills are required to compute the exact own contribution required for the full subsidy – another feature reducing the transparency of the subsidy design. Moreover, the minimum own contribution depended on the number of children and the year in which the Riester plan was signed.
The complexity of the design has distracted households from the substantial depth of the subsidies. While low earners receive a relatively high subsidy due to the flat-rate subsidy, higher earners benefit additionally from the tax deductions. Overall, the subsidies average about 45 % of contributions, varying between 24 % and 90 % depending on income and number of children, and generated annual expenditures of 740 million Euro in 2007.5
Use for the purchase of real estate. Another institutional feature is worth mentioning because it affects potential displacement effects discussed in Section 4. While savings usually must be accumulated until retirement and then disbursed in some type of annuity, there is an exception for owner-occupied housing where between e10,000 and e50,000 may be withdrawn from the accumulated capital for the purpose of purchasing owner-occupied property. The amount withdrawn must be paid back into the pension plan in monthly instalments by the age of 65 ; otherwise the subsidies must be paid back.
2.2 Uptake of ‘ Riester pensions ’ and amended eligibility criteria
Quarterly uptake figures are provided by the Federal Ministry for Labor and Social Affairs and displayed in Figure 1.
Around 1.4 million Riester pension plans were taken up in the first year after the introduction of incentives.6After a period of initial enthusiasm, however, demand for Riester pensions flattened in 2003 and 2004. This lackluster development and widespread criticism of the complex eligibility and subsidy design led to simplification in 2005 in an attempt to improve acceptance by households and providers :
1 The application procedure was simplified by replacing it with a one-off perma-nent benefit application. Savers eligible for subsidies can now authorize their pension provider to submit an allowance application on their behalf every year.
4 An automatic inflation adjustment was suggested for instance by the Commission for the Sustainable
Financing of the German Social Security Systems (2004), of which one author was a member, and Sommer (2007).
5 See Bundesbank (2002).
2 The number of certification criteria was reduced from 11 to 5. Specifically, the amount to be annualized was reduced from 80 % to 70 %.
3 The saver’s minimum own contribution is now standardized toe60 per annum. 4 The information duties of pension providers were extended. Information about investment options, the structure of the portfolio, and the risk potential were also given. Providers were required to introduce a standardized calculation facilitating comparisons of alternative products.
5 Acquisition and marketing costs can now be spread over five rather than ten years ; thereby selling Riester pensions became more attractive for providers. Demand for Riester pensions rose significantly in 2005 after these changes came into effect, see Figure 1. Around 900,000 new policies – around four times as many as during the whole of 2004 – were signed in the last quarter of 2005 alone. This upward trend continued throughout 2006. By the end of 2006, a total of more than 8 million pension plans eligible for subsidy support had been taken up. About 37 million in-dividuals are estimated to have been eligible for subsidies (Sommer, 2007) ; hence, coverage is about 23 %.
Besides the quarterly uptake figures, there is only limited information on socio-economic characteristics provided by the Central Riester Subsidy Office. Stolz and Rieckhoff (2005, 2006) claim that individuals with low labor incomes, women, fam-ilies, and employees in East Germany are well represented among subsidy recipients. Stolz and Rieckhoff therefore suggest that social policy objectives have been achieved.7
Figure 1. Development of Riester pensions
Source: Bundesministerium fu¨r Arbeit und Soziales (2006).
7In the contribution year 2003, 56.1 % of beneficiaries were female and 43.9 % male. Of those receiving
allowances, 29 % were from the new federal states in eastern Germany, 71 % from the former territory of West Germany. Around 2.4 million people received a basic allowance and 1.1 million people an ad-ditional child’s allowance. These shares remained more or less unchanged in 2004.
3 Uptake by socio-economic class using the SAVE data
The aggregate numbers analyzed by Stolz and Rieckhoff do not precisely tell us which population groups are covered by Riester pensions. They do not contain household income, specifically income not due to social security taxes and income from in-dividuals indirectly entitled to Riester subsidies. Hence, they do not provide a sound statistical basis to study the distributional aspects of the subsidy scheme. Moreover, the aggregate figures do not give information about possible displacement effects ; for example, they do not show competing products for old-age provision (which are not subsidized) or any other savings.
This and the following section therefore use new micro data, the SAVE panel, to shed light on these issues. We first briefly describe this data set, and then present bivariate descriptive statistics shedding light on the socio-economic status of the subsidy recipients. Section 4 deepens the analysis by employing a multivariate re-gression approach.
3.1 The SAVE data
SAVE is a new longitudinal data set containing information on households’ saving and asset choices, socio-demographic characteristics, and psychosocial determinants of savings behavior, particularly related to old-age provision.8The SAVE data offer the unique opportunity to investigate saving and old-age provision because the data are released very timely and include a broad variety of explanatory variables. In each year, the survey asked households about their financial decisions in the previous year. Thus far, the panel was surveyed in 2001, 2003, 2005, 2006, and 2007.
The unit of SAVE is the respondent and the respondent’s spouse (referred to in the following as household). In 2006, the total sample size was about 3,500 households. We restrict the analysis in this paper to those households who have not yet retired.9 All descriptive statistics in this paper are weighted. The weights are based on the income and age distribution of the German Microcensus.10
3.2 Dynamics of uptake
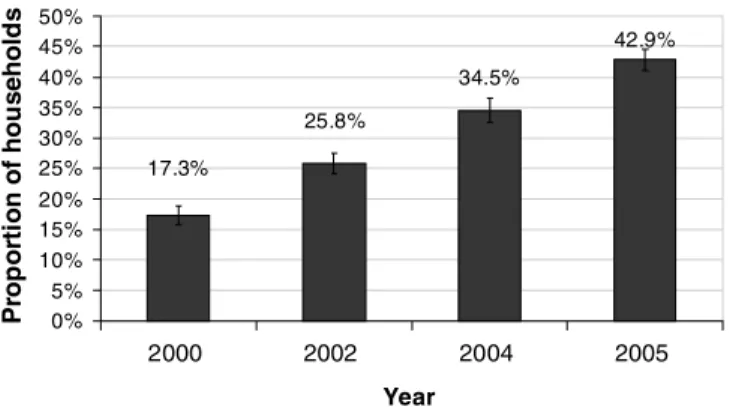
Figure 2 shows how the proportion of households making supplementary provision for old age developed between 2000, the year before the Riester reform, and 2005. Supplementary pension provision is broadly defined including occupational pensions,
8 See Bo¨rsch-Supan et al. (2008) for a detailed description of the dataset. Essig (2005), Bo¨rsch-Supan and
Essig (2005) and Schunk (2006) provide further details. We are grateful to the German Science Foundation (DFG) for funding this data set.
9 To be precise : the interview is conducted with the individual who knows best about the household’s
finances.
10 As in all surveys that deal with sensitive topics such as household finances, item non-response to sensitive
questions is not ignorable (see Essig and Winter (2003) and Schunk (2006) for discussion and docu-mentation). To prevent biased inference based on an analysis of complete cases only, an iterative mul-tiple imputation procedure has been applied to the SAVE data (Schunk, 2008). Mulmul-tiple imputation simulates the distribution of missing data and allows for a more realistic assessment of variances in subsequent analyses than single imputation. The procedure uses a Markov-Chain Monte-Carlo method to replace missing data by draws from an estimate of the conditional distribution of the data (Hoynes et al., 1998; Kennickell, 1998). All results in this paper use the fully imputed SAVE data.
state-subsidized pension products, and all other forms of private old-age provision such as private pension schemes, which are not eligible for direct state support or which were started before the subsidy scheme was introduced.11
Figure 2 shows that the proportion of households with supplementary pension provision grew enormously from 17 % to 43 % in the few years between 2000 and 2005. This development is remarkable in a country such as Germany, which features a first pillar of retirement income support that has traditionally been extremely dominant. The aggregate replacement rate (average net pension income divided by average net wage income) is currently about 70 %. Even after the recent reforms, it is scheduled to be above 55 % in 2030 when population aging reaches its peak. This is still substantially higher than the current replacement rate of 48 % in the US.
Which different forms of supplemental pension provision have contributed to this development ? We distinguish between occupational pensions, subsidized Riester pensions, and other unsubsidized private pension instruments.12
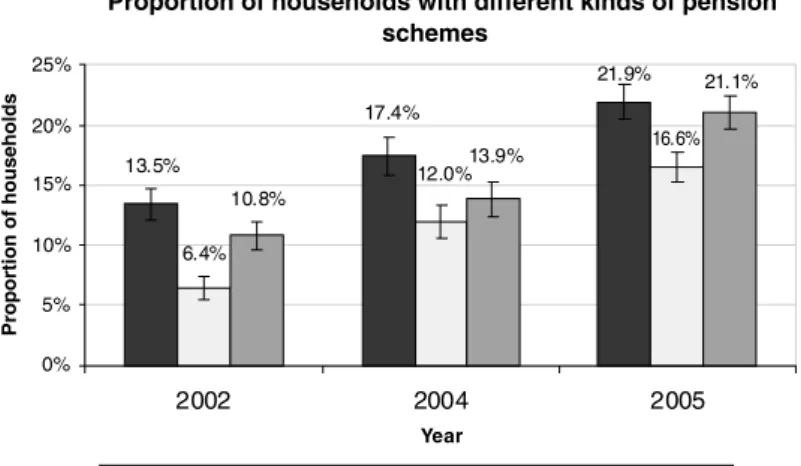
Figure 3 shows how these three vehicles of private old-age provision have developed in the period from 2002 to 2005.13
There has been a marked increase in all three instruments. The proportion of households with occupational pensions almost doubled between 2002 and 2005, and so did the share of households with unsubsidized private pensions. The share of households with Riester pensions almost tripled.
Proportion of households with occupational pensions, Riester-pensions and other pension schemes
42.9% 34.5% 25.8% 17.3% 0% 5% 10% 15% 20% 25% 30% 35% 40% 45% 50% 2000 2002 2004 2005 Year Pr op or ti on of hou s e hold s
Figure 2. Spread of private pension provision
Note: The thin line shows the 90 % confidence interval.
Weighted figures.
Source: Own calculations based on SAVE 2001, 2003, 2005, 2006, non-retired households.
11 For the precise wording of the question in the questionnaire refer to question 1 in the appendix. 12 See the appendix for the exact wording of the question in the SAVE survey instrument covering these
products.
13 The year 2000 has not been taken into account as pension provision had not been included in the SAVE
Unsubsidized private pensions are still more widespread than Riester pensions. Between 2004 and 2005, i.e. just before the changes in the legislation making Riester pensions more transparent, unsubsidized pensions even grew faster than the Riester pensions, in spite of the high subsidy levels. In addition to the intransparent design of Riester products, other possible explanations include the demand by households who are ineligible for state subsidies, a shift in demand towards private pensions as a response to the abolishment of tax benefits for whole life insurance policies, and a preference for more flexible and potentially higher profit-yielding products.
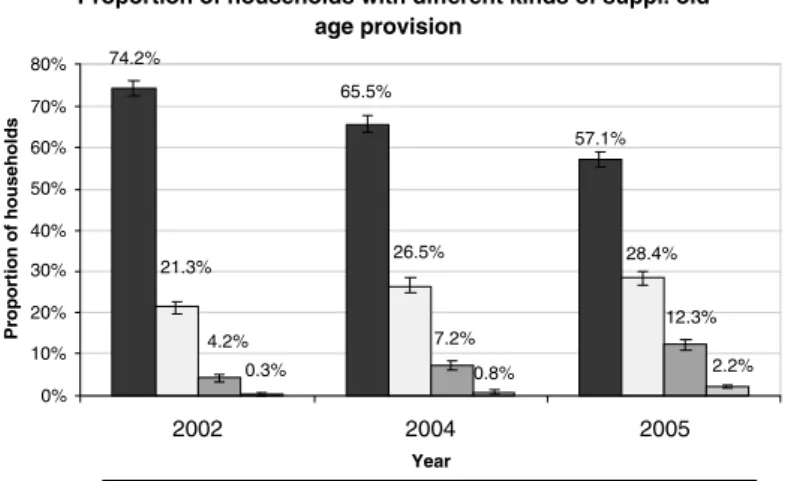
The large proportion of households with supplemental pension plans may disguise the fact that some households have several plans while others have none at all. Figure 4 therefore shows how many households subscribe to more than one sup-plemental pension scheme.
Indeed, combining several instruments is common. While Figure 4 shows that the share of households without any supplemental pension instrument has declined, it is still more than half of the population. In 2002, three quarters of households had neither their own occupational pension nor a Riester or any other private pension. In 2005, this was still true for about 57 % of households. If whole life insurance policies are also taken into account (not depicted in Figure 4), this percentage declines to 38 %. Compared to Anglo-Saxon countries, the saturation point has clearly not yet been reached in Germany.
The proportion of households with several pension instruments also increased in the observed period. This suggests that the increasing prevalence of supplemental pensions is not simply due to households, which had not previously made private provision for old age, but is also increasingly due to the number of households which use several such instruments.
Proportion of households with different kinds of pension schemes 21.9% 16.6% 21.1% 13.5% 17.4% 12.0% 6.4% 13.9% 10.8% 0% 5% 10% 15% 20% 25% 2002 2004 2005 Year Proportion of households
Occupational pension Riester-pension Other pension schemes
Figure 3. Spread of different private pension instruments
Note: The thin line shows the 90 % confidence interval. Weighted figures.
Source: Own calculations based on SAVE 2001, 2003, 2005, 2006, non-retired households.
3.3 Uptake by household characteristics
We now examine which households – stratified by age, number of children, edu-cation, and income – were actually reached by the various supplemental pension schemes.14
Supplementary pension uptake by age
When examining the prevalence of demand for private pensions by age, one would expect to find differences because the replacement rate of the public pension system will slowly decline in response to population aging. Younger generations are thus more strongly affected than older generations. One would therefore anticipate higher participation rates among younger households relative to among older ones.
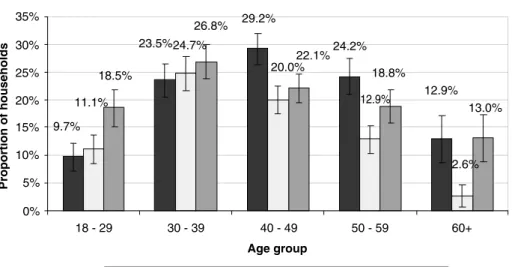
The distribution of Riester pensions across age groups in Figure 5 more or less reflects this anticipated profile. Despite the high rate of return, which heads of household aged 50 to 59 can expect to receive with a Riester pension, fewer older households have taken out a Riester pension than younger ones. Riester pensions are most common in the group aged 30 to 49, which also includes the baby boom gen-eration that will be most affected by the lower replacement rate of future public pension benefits. Participation is also significantly lower among younger households ; partly because many members of these households are not yet gainfully employed, e.g. in training or education. In addition, this age group has fewer children and thus receives a lower subsidy. The data reflect this in a higher proportion of younger rather than older households, which hold unsubsidized private pension instruments.
Proportion of households with different kinds of suppl. old-age provision 57.1% 0.8% 65.5% 74.2% 28.4% 26.5% 21.3% 12.3% 7.2% 4.2% 0.3% 2.2% 0% 10% 20% 30% 40% 50% 60% 70% 80% 2002 2004 2005 Year Proportion of households
No suppl. pension provision One scheme Two schemes Three schemes
Figure 4. Households with several pension instruments
Note: The thin line shows the 90 % confidence interval. Weighted figures.
Source: Own calculations based on SAVE 2001, 2003, 2005, 2006, non-retired households.
Supplementary pension uptake by number of children
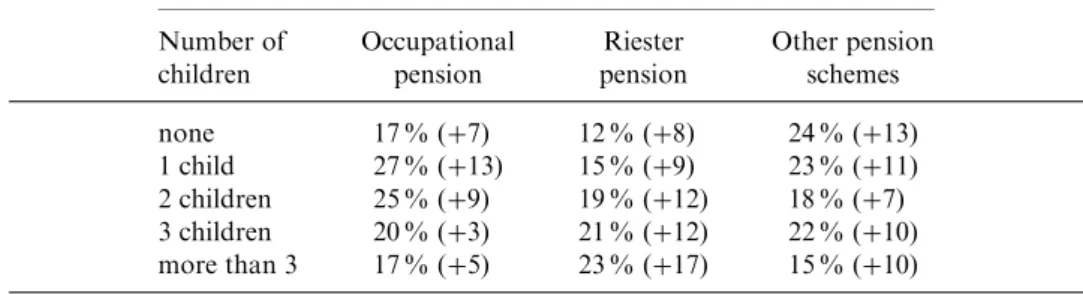
Figure 6 shows the strong positive relationship between the number of children and the proportion of households with a Riester pension plan. As pointed out in Table 1, Riester subsidies increase linearly with the number of children. Hence, it is not sur-prising that there is strong demand for Riester products among parents with more than two children.
One in five households with two or more children – almost twice as many as among childless households – had a Riester pension plan in 2005. Another striking finding is that Riester pensions are particularly popular with larger families with children. This is confirmed by the development over time shown in Table 2 for the period 2002 to 2005 when Riester pension plans were proliferating most markedly among house-holds with more than three children.
Supplemental pension uptake by education
As pointed out in the introduction, demand for private pension provision is closely related to knowledge about financial issues in general, and information about the social security system in particular. More specifically, the awareness of supplemen-tary pension provision and the willingness to postpone consumption today for more consumption tomorrow is contingent on knowledge about the conditions attached to state subsidies and the various take-up options available.
Figure 7 shows the proportion of households investing in old-age provision by vocational qualification, which we use as an indicator for financial knowledge.
Proportion of households with private pension schemes
9.7% 23.5% 29.2% 24.2% 12.9% 11.1% 24.7% 20.0% 12.9% 2.6% 18.5% 26.8% 22.1% 18.8% 13.0% 0% 5% 10% 15% 20% 25% 30% 35% 18 - 29 30 - 39 40 - 49 50 - 59 60+ Age group Proportion of households
Occupational pension Riester-pension Other pension schemes Figure 5. Supplementary pension provision by age group in 2005
Note: The thin line shows the 90 % confidence interval. Weighted figures.
Indeed, the presence of vocational training and the uptake of supplementary pen-sion provipen-sion are positively related. The prevalence of occupational penpen-sions among university graduates is particularly high. Riester pensions are now equally common among heads of household with intermediate and higher educational qualifications.15
Table 2. Development by number of children
Pension provision by number of children 2005 (change from 2002) Number of children Occupational pension Riester pension Other pension schemes none 17 % (+7) 12 % (+8) 24 % (+13) 1 child 27 % (+13) 15 % (+9) 23 % (+11) 2 children 25 % (+9) 19 % (+12) 18 % (+7) 3 children 20 % (+3) 21 % (+12) 22 % (+10) more than 3 17 % (+5) 23 % (+17) 15 % (+10)
Proportion of households with private pension schemes
17.3% 20.1% 25.0% 26.9% 17.3% 22.9% 20.9% 19.2% 15.2% 11.6% 15.2% 21.7% 18.0% 23.3% 23.8% 0% 5% 10% 15% 20% 25% 30%
none 1 child 2 children 3 children more than 3
children Number of children
Proportion of households
Occupational pension Riester-pension Other pension schemes Figure 6. Demand for private pensions by number of children in 2005
Note: The thin line shows the 90 % confidence interval. Weighted figures.
Source: Own calculations based on SAVE 2001, 2003, 2005, 2006, non-retired households.
15 Looking at educational levels shows that people leaving school with a lower secondary school
qualifi-cation make somewhat less provision for old age in any of the forms considered here than do heads of household with a secondary school leaving certificate or general university entrance qualification. While there are no differences between people holding a secondary school leaving certificate and those with
While there has been an increase in the number of supplemental pension plans held by households without any vocational training across all three schemes, the increase in the number of occupational and Riester pensions since 2002 trails behind that of the other two education groups, see Table 3.
Supplemental pension uptake by income
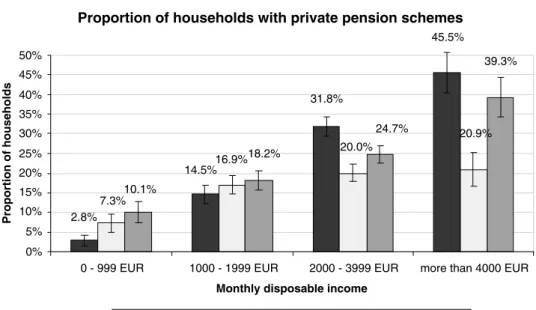
Finally, we consider the relationship between income and the demand for sup-plementary pension provision. Figure 8 shows that the proportion of households holding private pension instruments increases with growing disposable household income. This pattern is most apparent for occupational pensions. Around 7 % of households in the lowest income bracket have taken up Riester pension plans, while about a third is in the upper income bracket. It is remarkable that Riester pensions are much more equally distributed by income than occupational pensions or un-subsidized private pension schemes.
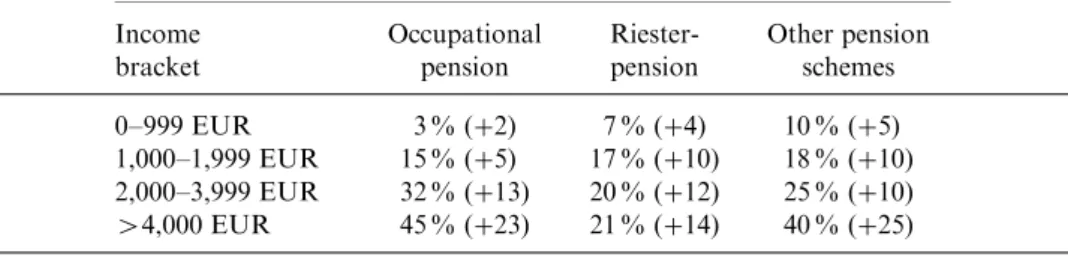
All income groups have exhibited an increasing demand for supplemental pensions since 2002, see Table 4. Starting from an already lower initial level, the increase in percentage points is least apparent in the lowest income bracket. This effect is less pronounced when expressed in relative percentage terms. Particularly striking is the
Proportion of households with private pension schemes
26.8% 23.1% 7.7% 18.1% 6.3% 17.7% 20.4% 8.8% 31.4% 0% 5% 10% 15% 20% 25% 30% 35%
None Professional training University degree Vocational training
Proportion of households
Occupational pension Riester-pension Other pension schemes
Figure 7. Demand for private pensions by vocational training in 2005 Note: The thin line shows the 90 % confidence interval. Weighted figures.
Source: Own calculations based on SAVE 2001, 2003, 2005, 2006, non-retired households.
higher qualifications as far as Riester pensions are concerned, occupational pensions are much more common among more highly educated heads of household. Overall, the differences are larger if we differentiate by vocational qualifications.
impressive growth of occupational pensions and unsubsidized private pension in-struments among high-income households.
Table 5 focuses on Riester pensions. It shows the development between 2004 and 2005 and provides some idea about the dynamic development in the four income brackets.
An important result from Table 5 is the markedly lower increase of the share of households with Riester pension plans in the lower-income range since 2004. This
Table 3. Development by vocational training between 2002 and 2005
Demand for private pensions by vocational training 2005 (change from 2002) Vocational training Occupational pension Riester-pension Other pension schemes None 8 % (+4) 6 % (+3) 9 % (+8) Professional training 23 % (+8) 18 % (+11) 20 % (+9) University degree 27 % (+10) 18 % (+10) 31 % (+13)
Note: Weighted figures.
Source: Own calculations based on SAVE 2001, 2003, 2005, 2006, non-retired households.
Proportion of households with private pension schemes
2.8% 45.5% 31.8% 14.5% 7.3% 20.9% 20.0% 16.9% 10.1% 39.3% 24.7% 18.2% 0% 5% 10% 15% 20% 25% 30% 35% 40% 45% 50%
0 - 999 EUR 1000 - 1999 EUR 2000 - 3999 EUR more than 4000 EUR Monthly disposable income
Proportion of households
Occupational pension Riester-pension Other pension schemes Figure 8. Demand for private pensions by monthly household disposable income in 2005 Note: Weighted figures.
finding is at odds with the data from the Central Riester Subsidy Office described in Section 2, which show that mostly low-income earners receive Riester subsidies.
The discrepancy can be explained by the already mentioned difference between income concepts in the two data sets. While the data from the Subsidy Office is based on individual labor income earned in the previous year (the base relevant for subsidy computation), the SAVE data records total disposable household income and thus also includes labor income earned by a spouse and other forms of income such as income from assets and transfers. Since the welfare position of a household is better described by its overall disposable income rather than labor income of a single part-ner, we are convinced that our broader income measure is a more appropriate cri-terion in assessing whether a target group has been reached by the Riester subsidies.16 The difference between our results and those by the administrative data suggests that many subsidy recipients with low labor income have other income sources they use to accumulate pension savings.17A recent analysis based on income tax returns confirms this view. It shows that Riester pensions are most prominent among de-clared household incomes between 30.000e and 100.000e; they are less prevalent among low and very high earners (Kriete-Dodds and Vorgrimler, 2007).
4 Multivariate analyses and displacement effects
Section 3 has evaluated bivariate relationships. In this section, we now evaluate the impact of household characteristics on the uptake of supplemental pensions using a multivariate regression approach. We also take account of many additional variables,
Table 4. Development by income brackets between 2002 and 2005
Demand for private pensions by monthly disposable household income 2005 (change from 2002) Income bracket Occupational pension Riester-pension Other pension schemes 0–999 EUR 3 % (+2) 7 % (+4) 10 % (+5) 1,000–1,999 EUR 15 % (+5) 17 % (+10) 18 % (+10) 2,000–3,999 EUR 32 % (+13) 20 % (+12) 25 % (+10) >4,000 EUR 45 % (+23) 21 % (+14) 40 % (+25)
Note: Weighted figures.
Source: Own calculations based on SAVE 2001, 2003, 2005, 2006, non-retired households.
16 The Subsidy Office, for example, classifies a wife working in a low-paid part-time job as being on a low
income, even if the husband was on a high salary. In our analysis using the SAVE data, we assign such couples to the upper-income bracket.
17 Second, a more technical issue is the unit of reference based on which the calculated proportions are
calculated. While we relate the rates of participation in the Riester pension scheme to all households in the population as a whole, Stolz and Rieckhoff (2005, 2006) calculate their proportional figures from within the group of allowance beneficiaries. This latter approach neglects the distribution of the observed characteristics in the total population.
specifically competing motives for saving and indicators, which reflect knowledge about the pension system and general financial matters.
As already pointed out, Riester pensions are not the only vehicle for voluntary contract-based retirement saving. We therefore employ a bivariate probit regression model, in which the decision to take up a subsidized Riester pension plan and the decision to enroll in other unsubsidized private pension plans are modeled simul-taneously. In other words, we model unobserved factors influencing both the demand for Riester products and other private pension plans which might be correlated.
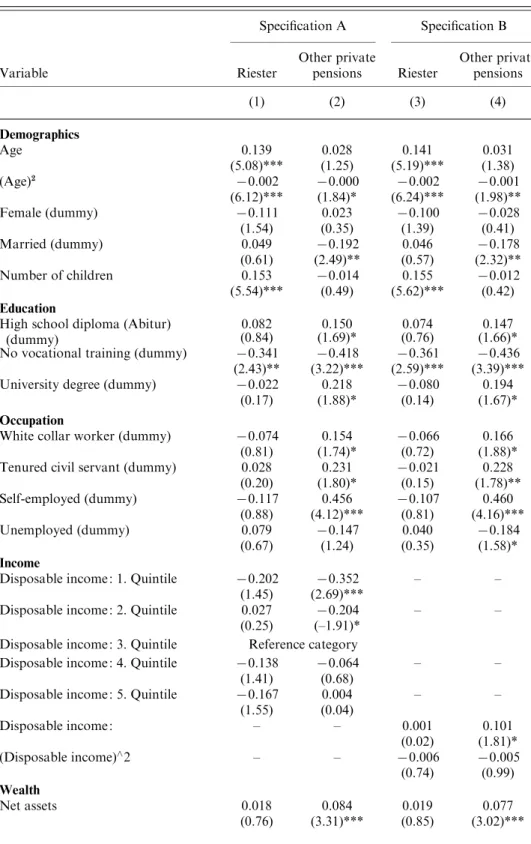
Table 6 presents the results of two bivariate probit regression specifications. Specification A describes disposable income as a set of four quintile indicators. Specification B employs a quadratic function of disposable income. In both specifi-cations, the first dependent variable, shown in columns 1 and 3, indicates whether a household has a Riester pension plan, while the second dependent variable, shown in columns 2 and 4, indicates whether a household has an unsubsidized private pension plan. All variables refer to the end of year 2005.
The regressions have a very satisfactory fit, here measured as McFadden’s R-squared (see the lower part of Table 6). Moreover, the estimated model indeed exhibits a positive correlation between the two equations, or, more precisely, between the unobservables in the decision to take up a subsidized Riester pension plan and the decision to enroll in unsubsidized private pension plans. The bivariate probit model therefore provides some efficiency gains relative to two separate probit regressions. The correlation, however, is small and not statistically significant.
In the following discussion, we will first focus on Riester pension plans (columns 1 and 3) and then move on to other private pension products (columns 2 and 4).
4.1 Who has taken up Riester pensions ?
The upper part of Table 6 contains coefficients of the most important socio-demographic characteristics. Personal characteristics such as age, gender, and education refer to the financial respondent of the household.
Age is specified as a quadratic function. The estimated age profile is similar to the one reported in Figure 5 : the probability of taking up a Riester pension increases initially, reaches its maximum at the age of about 40 and then falls steadily towards retirement age. Using higher order polynomials does not significantly affect the shape of the age profile.18
Table 5. Riester pension plans by income brackets in 2004 and 2005
Monthly disposable
household income [e] 0–999 1000–1999 2000–3999 Over 4000
2004
Participation rate 4.4 % 10.5 % 16.0 % 17.1 %
2005
Participation rate 7.3 % 17.0 % 20.0 % 20.9 %
Table 6. Determinants of the demand for Riester and other private pension products(bivariate probit estimates)
Specification A Specification B Variable Riester Other private pensions Riester Other private pensions (1) (2) (3) (4) Demographics Age 0.139 0.028 0.141 0.031 (5.08)*** (1.25) (5.19)*** (1.38) (Age)2 x0.002 x0.000 x0.002 x0.001 (6.12)*** (1.84)* (6.24)*** (1.98)** Female (dummy) x0.111 0.023 x0.100 x0.028 (1.54) (0.35) (1.39) (0.41) Married (dummy) 0.049 x0.192 0.046 x0.178 (0.61) (2.49)** (0.57) (2.32)** Number of children 0.153 x0.014 0.155 x0.012 (5.54)*** (0.49) (5.62)*** (0.42) Education
High school diploma (Abitur) (dummy)
0.082 0.150 0.074 0.147
(0.84) (1.69)* (0.76) (1.66)*
No vocational training (dummy) x0.341 x0.418 x0.361 x0.436
(2.43)** (3.22)*** (2.59)*** (3.39)***
University degree (dummy) x0.022 0.218 x0.080 0.194
(0.17) (1.88)* (0.14) (1.67)*
Occupation
White collar worker (dummy) x0.074 0.154 x0.066 0.166
(0.81) (1.74)* (0.72) (1.88)*
Tenured civil servant (dummy) 0.028 0.231 x0.021 0.228
(0.20) (1.80)* (0.15) (1.78)** Self-employed (dummy) x0.117 0.456 x0.107 0.460 (0.88) (4.12)*** (0.81) (4.16)*** Unemployed (dummy) 0.079 x0.147 0.040 x0.184 (0.67) (1.24) (0.35) (1.58)* Income
Disposable income : 1. Quintile x0.202 x0.352 – –
(1.45) (2.69)***
Disposable income : 2. Quintile 0.027 x0.204 – –
(0.25) (–1.91)*
Disposable income : 3. Quintile Reference category
Disposable income : 4. Quintile x0.138 x0.064 – –
(1.41) (0.68)
Disposable income : 5. Quintile x0.167 0.004 – –
(1.55) (0.04) Disposable income : – – 0.001 0.101 (0.02) (1.81)* (Disposable income)^2 – – x0.006 x0.005 (0.74) (0.99) Wealth Net assets 0.018 0.084 0.019 0.077 (0.76) (3.31)*** (0.85) (3.02)***
Table 6. (cont.) Specification A Specification B Variable Riester Other private pensions Riester Other private pensions (1) (2) (3) (4) (Net assets)2 x0.000 x0.000 x0.000 x0.000 (0.46) (–2.52)** (0.46) (2.39)**
Property owner (dummy) 0.081 x0.093 0.067 x0.084
(0.93) (1.06) (0.77) (0.97)
Financial knowledge
Contact with tax advisor (dummy) 0.019 0.158 0.029 0.157
(0.25) (2.27)** (0.39) (2.25)** No awareness of anticipated replacement rate x0.119 x0.099 x0.119 x0.106 (1.64)* (1.43) (1.64)* (1.53) Saving motives
Intention to buy real estate 0.001 0.143 x0.001 0.147
(0.01) (1.67)* (0.01) (1.71)*
Reason for saving : Buy real estate x0.090 x0.057 x0.089 x0.058
(2.11)* (1.39) (2.08)** (1.43)
Reason for saving : Provide for unforeseen events
x0.096 x0.057 x0.086 x0.052
(1.44) (0.86) (1.28) (0.79)
Reason for saving : Pay off debts x0.055 x0.041 x0.054 x0.043
(1.24) (0.99) (1.22) (1.03)
Reason for saving : Old-age provision 0.229 0.694 0.218 0.691
(3.06)*** (7.87)*** (2.92)*** (7.86)***
Reason for saving : Holiday 0.009 x0.068 0.012 x0.069
(0.18) (1.49) (0.25) (1.51)
Reason for saving : Finance major purchases
0.042 0.039 0.035 0.037
(0.81) (0.77) (0.68) (0.72)
Reason for saving : Finance grand-child education
x0.038 x0.091 x0.038 x0.094
(0.81) (2.02)** (0.80) (2.09)**
Reason for saving : Inheritance x0.124 0.090 x0.128 0.090
(2.32)** (1.80)* (2.39)** (1.80)*
Reason for saving : State subsidies 0.264 x0.015 0.269 0.008
(6.03)*** (0.38) (6.13)*** (0.20)
Alternative instruments Other form of suppl. pension
provision (dummy) 0.469 0.462 0.466 0.466 (6.27)*** (6.56)*** (6.25)*** (6.64)*** Constant x3.936 x2.714 x4.023 x3.069 (6.30)*** (4.98)*** (6.69)*** (5.84)*** Mc-Fadden R2 0.137 0.136 Rho [Chi2(1)] 0.055 [1.32] 0.060 [1.54] Number of observations 2255 2255
Notes: Absolute value of the z statistics in parentheses.
The number of children is highly significant. The strong relationship between taking up a Riester pension and the number of children already depicted in Figure 6 is robust and persists even if the influence of additional household characteristics is taken into account.
The financial respondent’s gender, marital status, and occupational status have statistically insignificant coefficients. Financial respondents with a high school dip-loma that qualifies for university admission are statistically no more likely to have enrolled in a Riester pension. This insignificant result is interesting because it appears to contradict the bivariate pattern depicted in Figure 7 and the coefficient on vocational training, which is highly significant. One interpretation is that the more theoretical general schooling is less suited as an indicator for financial knowledge than the more practical vocational training.
The next group of variables in the regression concerns the financial situation of the surveyed households. We test the robustness of the income effect by using two specifications for disposable household income. In specification A, we include household income using a set of dummy variables indicating income quintiles (reference category is the third income quintile). Only households in the bottom income quintile have a weakly significant lower probability in 2005 of having a Riester pension than households in the medium-income range ; all other quintile indicators are insignificant. Thus, households with very low incomes have lower uptake rates of Riester pensions, while there is no measurable difference among the higher-income quintiles. To investigate the sensitivity of this result, the second regression variant involves a quadratic specification. This specification B does not show significant t-statistics, although the polynomial coefficients are jointly significant (p-value 0.0625). Using higher order polynomials yields similar results.19
Being unemployed has no additional effect on taking up Riester pensions, neither does the value of other financial assets, specified again as a quadratic polynomial.
Two variables are designed to capture how well a household is informed about financial matters and the pension system. First, we include a dummy variable, which indicates contact with a tax advisor. This variable is insignificant. A second variable indicates the ability of the financial respondent to estimate the correct replacement rate of public old-age pensions (i.e., the expected retirement income relative to the expected pre-retirement income). This variable is significantly negative at a 10 % confidence level :20
respondents who lack knowledge about their future income in old age are less likely to enrol in the Riester pension scheme. The causality of this relationship is unclear, however, as households which opt for a Riester pension are usually informed by their financial advisors about their statutory pension en-titlements during the sales process. Hence, households tend to learn the correct replacement rate during the decision-making process.
Saving decisions are complex and may involve psychological aspects not captured by the conventional set of socio-economic variables. We have therefore included a set of variables in the regression which reflect the importance of different
19 See footnote above.
saving motives for respondents. We are specifically interested in three saving motives : the acquisition of real estate, the wish to bequeath wealth, and pocketing state subsidies.
First, there is evidence pointing to a possible displacement effect between old-age provision and real estate purchase. This is apparent when looking at households who report a particular interest in saving for the purchase of real estate property. The more important this savings motive is, the less likely respondents have taken up a Riester pension plan.
A second significantly negative coefficient is attached to the variable indicating a wish to save for a bequest. Our interpretation is that the requirement for Riester plans to be paid out as an annuity acts as a disincentive for households for whom making a bequest is an important saving motive.
Third, the high level of subsidization was designed as an enticement to attract savers towards Riester pensions. Do respondents confirm this ? Indeed, our findings show a strongly significant positive coefficient, demonstrating that households for which state subsidies represent an important savings motive are most likely to take up a Riester pension plan.
We conclude that, as far as old-age pension provision and the three mentioned saving motives are concerned, expressed attitudes to savings correspond with actual saving behavior.
As mentioned earlier, Riester pension plans and unsubsidized private pension plans are not the only vehicles for supplementalold-age provision. In addition, there are occupational pension plans. Moreover, whole life insurance products have been very popular as instruments to provide a lump-sum payment immediately after re-tirement.21The coefficient of a variable indicating the presence of such instruments is statistically significant and positive : households which are already covered by one of these alternative pension types are also more likely to have a Riester pension plan. One interpretation is that households who think ahead and invest in old-age provision at all tend to use several instruments for this purpose. As opposed to saving for real estate acquisition or saving for bequests, where we found substitution, this result gives evidence for a form of ‘ crowding in ’ among pension products.
Finally, it is informative to compare the results of Table 6, which refer to the year 2005, with the same regression applied to the data a year earlier.22This comparison is interesting because the application procedure for Riester pensions was simplified and many eligibility criteria were removed in 2005 (see Section 2). As a result, a large number of new Riester policies were taken up in 2005. In turn, with a broader range of households enrolled in 2005 than in 2004, households enrolled in 2004 are likely to have been better informed and have in general been less challenged by the complexity of savings decisions.
We confine our analysis to two key examples : education and income. First, both variables used as indicators for financial education (high school exam qualifying for university admission and the extent to which someone is informed about the
21 See German Federal Ministry for Labor and Social Affairs (2006).
replacement level of the public pension system) are highly significant in the 2004 regression, while they were insignificant and only weakly significant, respectively, in the regression using the 2005 data. Second, the significance of the income brackets changed. In 2004, the two lowest income quintiles had significantly lower enrolment into Riester pension plans, while a year later, this was only true for the lowest 20 %. This demonstrates that the acceptance of the Riester products has reached the lowest income bracket in 2005, with no significant differences left in all higher income brackets.
Summarizing our regression results regarding Riester pensions, the most important factor determining whether or not Riester pension plans are taken up appears to be the number of children. This is, as described in Section 2, also a key factor de-termining the size of the subsidy. As far as income is concerned, only the lowest 20 % of the income distribution have a significantly lower probability of being enrolled in a Riester pension plan. The desire to purchase property and the wish to bequeath assets are savings motives which compete with taking up Riester pensions, while occupational pensions and whole life insurance are found to be complements rather than substitutes.
4.2 Who has enrolled in unsubsidized private pension plans ?
In order to obtain a comprehensive picture of the diffusion of Riester pensions, it is essential to take unsubsidized private pension plans into account. It may well be a rational decision to avoid the highly regulated Riester pension and to choose a pension product that corresponds more closely with one’s own preferences and/or that may promise a higher rate of return, despite foregoing the state subsidy. Bearing this in mind, columns 2 and 4 in Table 6 describe the probability of having a private pension plan that does not qualify for state subsidies.
The age effect is similar to the results for the Riester pension. However, in stark contrast to the results in the Riester pension equation, respondents with a high school degree qualifying for university admission are more likely to have made alternative provisions for old age. This effect is strongly significant. Lack of knowledge about future pension replacements rates also correlates negatively with enrolment into private pension plans, again pointing to the importance of information about the pension system and general financial education.
As one might expect, the self-employed who, for the most part, are not eligible for direct subsidies, have a higher demand for other private pension plans. Unmarried households are less likely to enroll in a private pension.
The influence of children is another important difference to the results in the Riester pension equation. The number of children has no influence at all on the enrolment in unsubsidized pension plans. This shows that the child-related subsidies indeed attracted demand for Riester pension plans.
Income and asset effects are also strikingly different between subsidized and un-subsidized pension plans. The two lowest income quintiles show a significantly lower probability of enrolling into unsubsidized pension plans than for the middle-income quintile (specification A), and the linear term of the polynomial is now highly
significant (specification B). In contrast to the Riester pension equation, other financial wealth has considerable explanatory power for the probability to enroll in unsubsidized pension plans.
The indicator variables for various savings motives are largely insignificant. In contrast to the Riester pension equations, this also applies to the acquisition of real estate property and the wish to bequeath assets. For the interpretation of the latter finding, it is noteworthy that most unsubsidized private pension plans have an option to be paid lump-sum at retirement, in contrast to the mandatory annuitization of Riester products. We also included a variable measuring how strong the household feels motivated to save for old-age provision. The positive and significant coefficient shows that, as far as old-age pension provision is concerned, expressed attitudes correspond with actual behavior.
‘ Financial support from the state ’ is insignificant as a savings motive. This is no surprise given that these forms of retirement saving do not qualify for subsidies. In contrast, this motive was highly significant in the Riester pension equation. Households clearly distinguish between forms of saving which qualify for state sub-sidy and those which do not ; households for which such state support is important make conscious decisions in favor of the related products.
5 Conclusions
The recent pension reform in Germany provides helpful evidence to better under-stand whether and how voluntary state-subsidized private pension plans are able to fill the gap that will be created by the reduction of pay-as-you-go public pension benefits.
A first lesson is that new forms of subsidized saving need time before they really take off. It took over ten years in the U.S., for example, before Individual Retirement Accounts (IRAs) were accepted by households in the top two income tertiles. In Germany, the Riester pension plans have exhibited a much more dynamic growth. Growth in the first few years was very steep, then stalled, but then rebound after the 2005 legislative changes. Overall, growth rates are much higher than those experi-enced in the US.
There are several explanations for the discontinuous development of Riester pen-sions. Poor product design is likely the cause for the initially poor performance of Riester pensions. Moreover, the learning process regarding the need and way to invest in old-age provision took time, despite heavy advertising. As people learn from their social environment, the pace of this development depends on how widespread such pensions are in the population at large (‘ critical mass ’, Ruprecht, 2004), gen-erating exponential growth until saturation is reached.
We cannot exactly identify whether the dynamic spread of Riester pensions is due to the financial incentives, the availability of information, or the marketing efforts made by government and providers, mainly insurance companies. However, it is striking that the acceleration in Riester saving only kicked in after substantial simplifications had been made to the scheme, i.e. after the changes in regulations described in section 2, such as the introduction of a simpler one-off subsidy
application and the reduction of eligibility criteria. Therefore, an important second lesson is to avoid complex savings plans which are not immediately understood by customers. It now takes time to make up for the damage which has been caused by excessive complexity.
The target groups of the Riester reform in 2001 were mainly families with children and individuals with low income. Among those, parents with more than one child were best reached. Given the increased child benefit ofe300 per child which will be available for children born after 2007, it seems that Riester pension plans will almost certainly become more widespread among new parents. It remains to be seen whether this subsidy increase will result in households switching from existing unsubsidized savings vehicles to the subsidized Riester pension plans, and whether it will stimulate additional saving.
The evidence is less compelling for the other target group, low-income households. While administrative data of subsidy beneficiaries based on previous year’s earned income show that people with below average earnings make up almost 70 % of ben-eficiaries, our SAVE data on disposable household income tells another story. The share of households with Riester pensions is much lower in the lowest quintile of household income distribution than in the middle- and upper-income brackets. A third lesson is therefore that even deep subsidies do not appear to provide a suffi-ciently strong incentive to households with very low incomes to postpone current consumption in favor of retirement consumption.
Households with higher levels of educational attainment are more likely to enroll in Riester pensions than households with financial respondents who have not com-pleted any vocational training. Similarly, knowing future pension replacement levels correlates positively with enrolling in private pension schemes. A fourth lesson, therefore, is that information and the knowledge about arrangements relating to old-age pension provision are clearly vital to achieving high uptake rates.
Finally, we have gained new insights about possible displacement effects. While the SAVE data do not allow for a cleanly designed experiment, they provide cir-cumstantial evidence. First, households who desire to purchase real estate property are significantly less likely to have a Riester pension plan. The clumsy withdrawal rule offered by the Riester regulations clearly do not provide these households with sufficient liquidity in order to persuade them to make provision for old age alongside with saving to acquire real estate property. We find similar evidence that stated bequest motives displace Riester pension plans with their strict annuity rules. We do not conclude that these restrictions should be alleviated. On the contrary, they are needed since Riester pensions are designed to fill the gap in public pension benefits after pension reform, and these pay-as-you-go pensions are paid out as a life-long annuity.
While the desire to purchase property and the wish to bequeath assets are saving motives which compete with taking up Riester pensions, occupational pensions and whole life insurance are found to be complements rather than substitutes. This is an important fifth lesson. One interpretation is that households that think ahead and invest in old-age provision tend to use several instruments for this purpose. In this sense, there are ‘ crowding in ’ effects of fostering retirement saving.
References
Boeri, T., Bo¨rsch-Supan, A., and Tabellini, G. (2002) Would you like to reform the pension system ? The opionions of European citizens. American Economic Review, 92 : 396–401. Bo¨rsch-Supan, A. (ed.) (2003) Life-Cycle Savings and Public Policy : A Cross-National Study of
Six Countries. London : Academic Press.
Bo¨rsch-Supan, A. (2004) Mind the gap incentives : the effectiveness of incentives to boost retirement savings in Europe. OECD Economic Studies, 39 : 111–144.
Bo¨rsch-Supan, A. and Essig, L. (2005) Household saving in Germany : results of the first SAVE study. In D. A. Wise (ed.), Analyses in the Economics of Aging. Chicago : The University of Chicago Press, pp. 317–52.
Bo¨rsch-Supan, A., Coppola, M., Eymann, A., Essig, L., and Schunk, D. (2008) The German SAVE study : design and results. MEA Study No. 6. MEA – Mannheim Research Institute for the Economics of Aging, University of Mannheim, forthcoming.
Bundesministerium fu¨r Arbeit and Soziales (2006) Renten- und Alterssicherungsbericht 2005, http://www.bmas.de, Berlin.
Commission for the Sustainable Financing of the German Social Security System (2004) Bericht der Kommission. German Federal Ministry for Health and Social Affairs, Berlin. Deutsche Bundesbank (2002) Funded old-age provision and the financial markets. Monthly
Report July 2002 : 25–39. Frankfurt.
Disney, R., Emmerson, C., and Wakefield, M. (2001) Pension reform and saving in Britain. Oxford Review of Economic Policy, 17(1) : 70–94.
Du¨nn, S. and Fasshauer, S. (2003) Ein Jahr Riesterrente – Eine U¨bersicht aus Sicht der geset-zlichen Rentenversicherung. Deutsche Rentenversicherung 1–2.
Essig, L. (2005) Methodological aspects of the SAVE data set. MEA Discussion-Paper 80-05. MEA – Mannheim Research Institute for the Economics of Aging, University of Mannheim. Essig, L. and Winter, J. (2003) Item nonresponse to financial questions in household surveys : An experimental study of interviewer and mode effects. MEA Discussion Paper 39-03. MEA – Mannheim Research Institute for the Economics of Aging, University of Mannheim. Gale, W. J. and Scholz, J. K. (1994) IRAs and household saving. American Economic Review,
84 : 1233–60.
German Federal Ministry for Health and Social Security (2005) National strategy report on old-age pension provision. http://www.bmas.band.de/BMAS/Redaktion/Pdf/Publikationen/ national-strategy-report-on-old-age-pension-provision.
Hoynes, H., Hurd, M., and Chand, H. (1998) Household wealth of the elderly under alternative imputation procedures. In D. A. Wise (ed.), Inquiries in the Economics of Aging, Chicago : The University of Chicago Press, pp. 229–57.
Kennickell, A. B. (1998) Multiple imputation in the survey of consumer finances. Proceedings of the 1998 Joint Statistical Meetings, Dallas TX.
Kriete-Dodds, S. and Vorgrimler, D. (2007) Staatliche Fo¨rderung der Riester-Rente fu¨r das Jahr 2002. Wirtschaft and Statistik 3/2007.
Lang, O. (2000) Steueranreize and Geldanlage im Lebenszyklus : empirische Analysen zu Spar-and Portfolioentscheidungen deutscher Privathaushalte. Baden-Baden : Nomos-Verlags-Gesellschaft.
Lusardi, A. (1999) Information, expectations, and savings for retirement. In H. J. Aaron (ed.), Behavioral Dimensions of Retirement Economics, Washington, DC : Brookings Institution Press and Russell Sage Foundation, pp. 81–115.
Lusardi, A. and Mitchell, O. (2006) Financial literacy and planning : implications for retire-ment wellbeing. Wharton School Discussion Paper, University of Pennsylvania.
Madrian, B. and Shea, D. (2001) The power of suggestion : inertia in 401(k) participation and savings behavior. Quarterly Journal of Economics, 116(4) : 1149–87.
Ruprecht, W. (2004) Automatische Entgeltumwandlung in der betrieblichen Altersversor-gung – eine Replik. Wirtschaftsdienst, 10 : 651–6.
Schunk, D. (2006) The German SAVE Survey : documentation and methodology. MEA Discussion-Paper 109-06. MEA – Mannheim Research Institute for the Economics of Aging, University of Mannheim.
Schunk, D. (2008) A Markov Chain Monte Carlo algorithm for multiple imputation in large surveys. Advances in Statistical Analysis, 92(1) : 101–14.
Schunk, D. and Winter, J. (2007) The relationship between risk attitudes and heuristics in search tasks : a laboratory experiment. Mu¨nchener Wirtschaftswissenschaftliche Beitra¨ge (VWL) 2007–9.
Skinner, J. and Hubbard, R. G. (1996) Assessing the effectiveness of saving incentives. Journal of Economic Perspectives, 10(4) : 73–90.
Sommer, Mathias (2007) Fiskalische Auswirkungen einer Erweiterung des Fo¨rderrahmens von Riesterrenten. MEA Discussion Paper 122-07. MEA – Mannheim Research Institute for the Economics of Aging, University of Mannheim.
Stolz, U. and Rieckhoff, C. (2005) Aktuelle Ergebnisse der zulagengefo¨rderten Alters-vorsorge. Die AngestelltenVersicherung, 9/05, 409–16.
Stolz, U. and Rieckhoff, C. (2006) Zulagenzahlungen der zentralen Zulagestelle fu¨r Altersvermo¨gen – Auswertungen fu¨r das Beitragsjahr 2003. RV-aktuell 08/06, 306–13. Venti, S. and Wise, D. (1990) Have IRAs increased US Savings ? Evidence from consumer
expenditure surveys. Quarterly Journal of Economics, 105 : 661–98.
6 Appendix : Relevant questionnaire items
1. Did your or your partner hold one of the following types of pension savings con-tracts in December 200X ?
– Occupational pension scheme, e.g. occupational pensions from type A (Pensionsfonds) or type B (Pensionskasse) staff pension fund and provident funds as well as occupational direct pension promises or direct insurance schemes
– State-subsidized private pension scheme (‘ Riester pension ’), i.e. state-pro-moted and certified savings accounts which cannot be liquidated prior to re-tirement
– Other contractually agreed private pension scheme, e.g. investment funds geared specifically to the provision of pension cover, private pension insurance policies which are not promoted by the state or which were taken out before such support was available.
– No none of these, or already paid out.
2. What percentage of your anticipated last wage/salary will you receive as your pension from the state pension insurance or civil service scheme ?
– Estimated percentage :
– Do not know ; not possible to estimate